5.2 GENDER GAPS IN TEST SCORES IN INTERNATIONAL COMPARISON
Zoltán Hermann
It is a well-known fact, that there are significant differences among countries regarding the gender gap in test scores (Marks, 2008). Gender gaps in test scores (hereafter GGTS) based on the data of the latest PISA programme of 2015 are presented below. The PISA Programme measures students’ skills in mathematics, natural sciences and literacy with standardized tests to assess how well students can apply what they learnt in school to real-life situations out of the context of school exercises. The programme measures the skills of students at the age of 15.
There are significant differences among countries in the average performance level of students. In order to precede its influence on the measured GGTS, test scores were standardised by country thus the unit of the GGTS is the standard deviation (SD). Raw scores were divided by the standard deviation excluding gender differences, calculated from the average of boys’ variance and girls’ variance (Baye–Monseur, 2016).This way the variance component generated by the gender gap itself is eliminated from the standard deviation.
The GGTS was measured from the boys’ aspect; positive values indicate the better performance of boys.
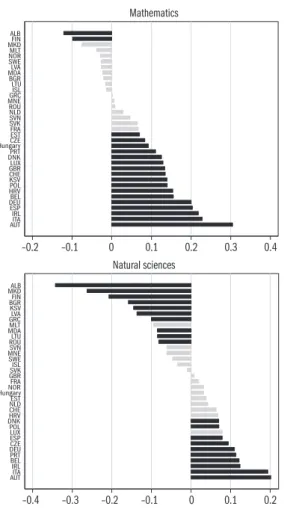
Figure 5.2.1 presents the average values of the GGTS in European coun- tries. Gender gaps are the largest in the field of literacy. The performance of girls exceeds that of boys in every European country, by a country average of 0.35 standard deviation, which denotes a significant difference. In mathemat- ics, it is rather boys who perform better on average but this is not the case in every country. In some countries, the difference is not significant while in Finland and Albania girls perform better than boys. In the average of coun- tries, the advantage of boys is 0.07 standard deviation. As regards natural sci- ences the picture is rather mixed. In one-third of the countries boys achieve better scores, in one-third girls while there is no significant difference in the remaining countries.
However, differences among countries are significant in all the three fields.
Although the standard deviation of the GGTS among countries is the larg- est in literacy (0.14 SD) its value is quite similar in mathematics and natu- ral history (0.10 and 0.12 SD). In the case of Hungary the GGTS is around the medium level. There is no significant difference in the field of natural sciences. The performance of boys is somewhat better (0.09 SD) in math- ematics. The advantage of girls in literacy (0.27 SD) is somewhat below the European average.
–0.2 –0.1 0 0.1 0.2 0.3 0.4
AUTITAIRL DEUESPBEL HRVPOL KSVCHE GBRLUX DNKPRT HungaryMNEMKDMDASWENORSVKSVNNLDROUGRCBGRMLTCZEESTFRAALBLTULVAFINISL
Mathematics
–0.7 –0.6 –0.5 –0.4 –0.3 –0.2 –0.1
BELIRLITA ROUDEUPRTLUXAUT GBRNLDESP HungaryMNEMKDMDADNKHRVSWENORBGRCHEPOLSVKMLTGRCSVNKSVFRACZEESTALBLTUISLFINLVA
Literacy
–0.4 –0.3 –0.2 –0.1 0 0.1 0.2
AUTIRLITA BELPRT DEUCZEESPLUX DNKPOLHRVCHENLDEST HungaryMNENORSWEMDAMKDGBRSVNROUMLTGRCBGRFRASVKKSVLTULVAFINALBISL
Natural sciences
Figure 5.2.1: Gender gaps in test scores (boys-girls) in European countries, 2015
Dark grey: significant GGTS at a level of 5 percent Light grey: not significant GGTS at a level of 5 percent
Abbreviations: ALB: Albania, AUT: Austria, BEL: Belgium, BGR: Bulgaria, CHE:
Switzerland, CZE: Czech Republic, DEU: Germany, DNK: Denmark, ESP: Spain, EST: Estonia, FIN: Finland, FRA: France, GBR: United Kingdom, GRC: Greece, HRV: Croatia, HUN: Hungary, IRL: Ireland, ISL: Iceland, ITA: Italy, KSV: Kosovo, LTU: Lithuania, LUX: Luxemburg, LVA: Latvia, MDA: Moldova, MKD: Macedonia, MLT: Malta, MNE: Montenegro, NLD: Germany, NOR: Norway, POL: Poland, PRT:
Portugal, ROU: Romania, SVK: Slovak Republic, SVN: Slovenia, SWE: Sweden.
Source: Own calculation based on the PISA database of 2015.
It is important to mention that there is a strong positive correlation at the country-level among test score differences measured in the three fields of stud- ies. (Guiso et al. 2008, Marks, 2008). Regarding the European data of 2015 this correlation is around 0.8. This means that the more advantage boys for example have in mathematics in a country typically the less they lag behind in literacy. This, however does not mean that gender differences in total are high
certain education systems perform relatively better in all the three fields (as in Finland or Latvia) while in other countries boys learn relatively more ef- fectively (as in Austria or Italy).
This correspondence leads to two important conclusions. First, it is not likely that different degree of specialization of gender roles is the main driver of the country differences. If this were to be the case, in countries where the education system transmits strongly specialized expectations after gender roles the advantage of boys would be similarly significant in mathematics than the advantage of girls in literacy, i.e. negative correlation could be observed. Sec- ond, cross-country differences could hardly be explained by subject-specific education policies (e.g. teaching methods and curricula in mathematics). It is more likely, that these originate in the more general characteristics of the education systems (Marks, 2008).
Possible reasons for gender gaps in test scores among countries Literature on cross-country differences traditionally explains this variation by social and cultural factors, results are however mixed. A part of the analyses demonstrates a positive association (Guiso et al. 2008, Else-Quest et al. 2010), while others did not find a link at all (Fryer–Lewitt, 2010, Stoet–Geary, 2015).
Another part of the literature links the differences of GGTS among countries with the characteristics of the education system. Van Langen et al. (2006) ex- amined the integration of the education systems (school types, segregation, differences among schools) and found, that girls perform relatively better in a more unified school system. Ayalon–Livneh (2013). Van Hek (2017) arrived at a similar consequence regarding the standardisation of education systems, which was measured by the variation in pedagogic methods among teachers.
Hermann–Kopasz (2018) studied three further characteristics of the school system: early selection among school types, frequency of grade repetition and deployment of the so called, student-oriented teaching practices. The latter is measured by the composite index developed by the OECD (2013). The com- posite index is based on the frequency of classroom practices e.g. when indi- vidual students are allocated different exercises, students work on longer pro- jects or engage in group work. The results of this study regarding European countries are summarized below.
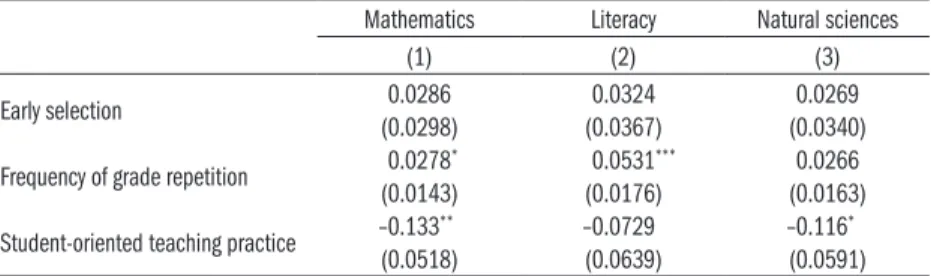
Table 5.2.1 demonstrates the correspondence based on single cross-sectional regression estimates on the European sample. In countries where grade rep- etition is more frequent boys perform relatively better than girls (their ad- vantage is larger in mathematics and their disadvantage is smaller in literacy).
On the contrary, student-oriented teaching practices are more favourable for girls. Early selection (at the age of 14 or earlier) is not closely related to test score differences.
Table 5.2.1: Gender gaps in test scores (boys-girls) and the characteristics of the education system in European countries, 2015
Mathematics Literacy Natural sciences
(1) (2) (3)
Early selection 0.0286 0.0324 0.0269
(0.0298) (0.0367) (0.0340)
Frequency of grade repetition 0.0278* 0.0531*** 0.0266
(0.0143) (0.0176) (0.0163)
Student-oriented teaching practice –0.133** –0.0729 –0.116*
(0.0518) (0.0639) (0.0591)
Note: Cross-sectional regression estimates. N = 30. Due to its outlier values Albania was excluded. Standard errors in square brackets.
*** p < 0.01, ** p < 0.05, * p < 0.1
Source: Own calculation based on the PISA database of 2015.
These correlations themselves, however do not answer the question of whether the characteristics of the education system do have an effect on gender gaps.
To explore causal effects we employ indirect methods.
We can assume that grade repetition has primarily an impact on low achiever students by directly affecting or threatening them. Therefore, correlation be- tween test score differences and grade repetition is expected to be the strong- est in their case. This hypothesis though cannot be proved which implies that the frequency of grade repetition is unlikely to have a direct effect on test score gaps (Hermann–Kopasz, 2018). The correlation with grade repeti- tion is more likely to represent the impact of some other characteristic of the educational system.
The link between student-oriented teaching practices and the gender gap could be examined also within countries, as teaching practices could differ among schools as well as within schools. The results of student level estimates containing country- or school fixed effects confirm that student-oriented teaching practices could have a positive impact on the relative performance of girls. (Hermann–Kopasz, 2018).
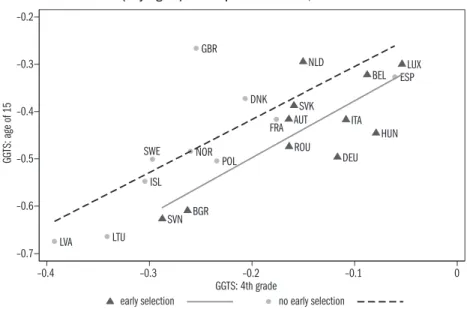
The direct impact of early selection could be examined by the difference-in- differences method, complementing PISA data with the data of the TIMSS and PIRLS data on fourth grade pupils by IEA.1 As no different school types exist in primary education anywhere, the direct impact of early selection could be estimated by comparing the change in GGTS between the fourth grade and the age of 15 in early tracking and late- or non-tracking countries. The impact is shown by the fact that the change is greater in selective school sys- tems than in countries with a unified school system. Figure 5.2.2 presents this effect in the field of literacy based on PISA data of 2012. It is clearly visible, that the disadvantage of boys in literacy increases between the fourth grade and the age of 15 in all countries (except the United Kingdom where it re-
1 IEA: International Associa- tion for the Evaluation of Edu- cational Achievement. TIMSS:
Trends in International Math- ematics and Science Study.
PIRLS: Progress in Interna-
AUT
BEL
BGR
DEU ITA HUN NLD LUX
ROU SVK
SVN
DNK
ESP
FRA GBR
ISL
LVA LTU
NOR POL SWE
–0.7 –0.6 –0.5 –0.4 –0.3 –0.2
GGTS: age of 15
–0.4 –0.3 –0.2 –0.1 0
GGTS: 4th grade
early selection no early selection
with early selection. The average effect is indicated by the difference between the levels of the lines representing the two groups of countries.
Figure 5.2.2: The impact of early selection on the gender gaps in literacy test scores (boys-girls) in European countries, 2015
Note: Abbreviations see under Figure 5.2.1.
Source: Own calculation based on the data of PISA of 2015 (age 15) and PIRLS of 2006 (4th grade).
Regression estimates on whole sample of countries confirm the effect shown by Figure 5.2.2 in all the three fields of knowledge (Hermann–Kopasz, 2018).
In the case of literacy the effect is statistically significant on the European subsample, as well. The direct impact of early selection therefore is advanta- geous for girls. The reason for this is that the share of girls in vocational-type schools providing a lower level of general education is lower in general.
On the whole, it seems that gender gaps in test scores cohere with the charac- teristics of the education system. More traditional education systems – where grade repetition is more frequent, selection is early, and the use of modern pedagogic methods is less widespread – favour boys. The direct impact of early selection however improves the performance of girls.
Gender gaps in test scores and the distribution of student achievement
Beyond differences in average test scores it is worthwhile to examine gen- der gaps both among exceptionally weak and well-performing students. The lower proportion of girls in tertiary education in STEM (natural science, IT, technology and mathematics) programmes is well-known; from this respect GGTS measured among well-performers is more relevant than the average
GGTS (Baye–Monseur, 2016). The analysis of the other tail of the distribu- tion shows the extent of gender-specificity of low achievement.
Figure 5.2.3 presents GGTS in Hungary in deciles by test scores, in three grades based on the standardized data of the National Assessment of Basic Competencies.
0 0.1 0.2 0.3
1. 2. 3. 4. 5. 6. 7. 8. 9. 10.
decile
6th grade 8th grade 10th grade Mathematics
–0.4 –0.35 –0.3 –0.25 –0.2 –0.15
1. 2. 3. 4. 5. 6. 7. 8. 9. 10.
decile Literacy
Figure 5.2.3: Gender gaps in test scores (boys-girls) by students’ performance in Hungary, 2013–2017
Source: Own calculation based on the data of the National Assessment of Basic Com- petencies.
Gender gaps show remarkably different patterns on the two tails of the dis- tribution. In mathematics boys have a larger advantage in the top of the dis- tribution and there is no difference among low achievers. GGTS in primary schools is even smaller, the advantage of boys increase after the 8th grade ex- cept in the group of the weakest performers.
As regards to literacy the difference at the 10th grade is the largest – in fa- vour of girls – among the weak performers. Gender gaps at the 6th and 8th grade however show a balanced picture. Differences at the 10th grade are in line with the PISA data as well as with the general findings of the literature.
In international comparison, however in Hungary girls perform exceptionally well relative to boys in the lower part of the distribution in all the three fields measured by PISA, while gender gaps in other parts of the distribution are of average size. This is probably related to the differences among school tracks.
It is worth mentioning here, that test scores of high achiever boys in Eu- ropean countries typically exceed or at least reach the test scores of the best performer girls in the field of natural sciences while among low achievers it is rather girls who have the advantage. This pattern is consistent with the lower participation rate of girls in STEM education (Baye–Monseur, 2016).
Finally, a further commonly-known characteristic of the gender gap in test scores is that the test score distribution among boys is less equal, the variance is higher than among girls (Baye–Monseur, 2016). In the average of European
all the three fields. This difference in Hungary, however is among the small- est ones.
References
Ayalon, H.–Livneh, I. (2013): Educational standardization and gender differences in mathematics achievement: A comparative study. Social Science Research, Vol. 42.
No. 2. pp. 432–445.
Baye, A.–Monseur, C. (2016): Gender differences in variability and extreme scores in an international context. Large-scale Assessments in Education. IEA-ETS Research Institute Journal, Vol. 4. No. 1.
Else-Quest, N. M.–Hyde, J. S.–Linn, M. C. (2010): Cross-national patterns of gender differences in mathematics: A meta-analysis. Psychological Bulletin, Vol. 136. No.
1. pp. 102–127.
Fryer, Jr. R. G.–Levitt, S. D. (2010): An empirical analysis of the gender gap in mathe- matics. American Economics Journal: Applied Economics, Vol. 2. No. 2. pp. 210–240.
Guiso, L. F.–Monte, P.–Sapienza, P.–Zingales, L. (2008): Culture, gender, and math.
Science, 320. pp. 1164–1165.
Zoltán Hermann– Marianna Kopasz (2018): Educational policies and the gender gap in test scores. A cross-country analysis. BWP 2018/5.
Marks, G. N. (2008): Accounting for the gender gaps in student performance in read- ing and mathematics: evidence from 31 countries. Oxford Review of Education, Vol. 34. pp. 89–109.
OECD (2013): PISA 2012 Results: Ready to Learn: Students’ Engagement, Drive and Self- Beliefs. Vol. III, OECD Publishing, Paris.
Stoet, G.–Geary, D. C. (2015): Sex differences in academic achievement are not related to political, economic, or social equality. Intelligence, Vol. 48. pp. 137–151.
Van Hek, M. (2017): Gender inequality in educational attainment and reading perfor- mance A contextual approach. ICS dissertation series, 248.
Van Langen, A.–Bosker, R.–Dekkers, H. (2006): Exploring cross-national differ- ences in gender gaps in education. Educational Research and Evaluation, Vol. 12.
No. 2. pp. 155–177.