Contents lists available atScienceDirect
Research in Social Stratification and Mobility
journal homepage:www.elsevier.com/locate/rssm
Peers that count: The influence of deskmates on test scores
Tamás Keller
a,b,⁎, Károly Takács
a,caComputational Social Science - Research Center for Educational and Network Studies, Hungarian Academy of Sciences, Hungary
bTÁRKI Social Research Institute, Budapest, Hungary
cThe Institute for Analytical Sociology, Linköping University, Norrköping, Sweden
A R T I C L E I N F O Keywords:
Test score growth Academic achievement Ethnic test-score gap Peer effects Friends Deskmates Social networks
A B S T R A C T
Peer effects have been shown to be important for educational development during adolescence. Peer effect from classmates and friends, nevertheless, could be the target of interventions only to a limited extent. We hy- pothesize that deskmates may affect educational achievement. In contrast to friendship, deskmate relations could realistically be a target of policy intervention by teachers, who can decide on the seating arrangements in class. This study examines whether deskmates have a positive impact on individual test scores that goes beyond the general influence of classmates and friends. The deskmate effect is investigated in ethnically mixed class- rooms. Information on friendship and deskmates from a social network panel was merged with test score register data from secondary schools in Northern and Eastern Hungary. The study finds that, after controlling for stu- dents’ own baseline eighth-grade reading test scores and classroom-fixed effects, deskmates’ eighth-grade reading test score influences positively students’ tenth-grade reading test scores. No similar effect was found for mathematics test scores. We found no evidence that deskmates’ test scores mediate or moderate the ethnic test- score gap between Hungarian and Roma students.
1. Introduction 1.1. Peer effects in school
Policies that result in a change in the composition of peers (e.g., ability tracking, school choice programs, busing, ethnic integration) have the promise of increasing students’ educational achievements through making simple changes. A closer look at the recent experi- mental analyses about the influence of peers’ educational achievements on individual educational achievement shows, however, that this pro- mise has not yet been realized (Sacerdote, 2014), since mixed results have been found, ranging from a small positive peer effect (Feld &
Zölitz, 2017) to a negative one (Antecol, Eren, & Ozbeklik, 2016).
Without such consensus in earlier findings, our recent under- standing of peer effects in educational achievement is torn between the puzzle of empirical evidence and policy-related promise. On the one hand, peers might influence academic achievement via various chan- nels including motivation, advice, guidance, facilitation, help, persua- sion, deception, being role models, via inter-personal interaction such as gossiping and also via cheating. On the other hand, measuring peer effects is difficult, since peers mutually influence each other.
Furthermore, it is often complicated to isolate pure peer effects from the effect of the background of peers, since individuals tend to self-select
into influential peer groups (Manski, 1993). Accordingly, identifying the causal peer effect is not without peril (Angrist, 2014).
A recent strand of literature relies, therefore, on estimating the ef- fect of randomly allocated peers and roommates among young adults (Foster, 2006; Lyle, 2007; McEwan & Soderberg, 2006; Sacerdote, 2001;Stinebrickner & Stinebrickner, 2006;Zimmerman, 2003;Carrell, Fullerton, & West, 2009). The related field experiments found, how- ever, little effect on educational outcomes and concluded that without friendship potential, random assignments are less influential.
Many studies argue that some peers are evidently more important than others (Lomi, Snijders, Steglich, & Torló, 2011). Most of the lit- erature that uses social network methods conceptualizes peer effect as the influence offriends(Crosnoe, Cavanagh, & Elder, 2003;Flashman, 2012a, 2012b; Knecht, 2007). The importance of friendship ties and social networks is also highlighted by research in the school context (Cillessen, 2007; Veenstra, Dijkstra, Steglich, & Van Zalk, 2013;
Veenstra & Dijkstra, 2011). Teachers, however, can hardly manipulate the development of friendship relations. As a consequence, even if studies are able to identify the causal effects of friendship (Back, Schmukle, & Egloff, 2008), intervening through policy is more difficult.
In addition to friends, physical proximity and the opportunities re- sulting from this play an important role in peer influence (Marmaros &
Sacerdote, 2006; Rivera, Soderstrom, & Uzzi, 2010; van Duijn,
https://doi.org/10.1016/j.rssm.2019.05.003
Received 12 February 2018; Received in revised form 13 May 2019; Accepted 16 May 2019
⁎Corresponding author at: Tóth Kálmán utca 4, Budapest, 1097 Hungary.
E-mail addresses:keller.tamas@tk.mta.hu(T. Keller),karoly.takacs@liu.se(K. Takács).
0276-5624/ © 2019 The Authors. Published by Elsevier Ltd. This is an open access article under the CC BY-NC-ND license (http://creativecommons.org/licenses/BY-NC-ND/4.0/).
Please cite this article as: Tamás Keller and Károly Takács, Research in Social Stratification and Mobility,
Zeggelink, Huisman, Stokman, & Wasseur, 2003). Those students who are in close physical proximity and often meet each other in an aca- demic context can exert an influence, while a lack of contact prevents influence. Prior evidence about the proximity-based peer effect, how- ever, is sparse and finds little effect on academic achievement (Lu &
Anderson, 2015).
In the classroom, the students who can exert influence based on physical proximity are deskmates. Deskmates are of tremendous im- portance for real-world school policies since teachers can benefit from and intervene in proximity effects that might even have friendship potential. To construct evidence-based practical recommendations, one should, therefore, study the intervention techniques by which teachers can utilize peer effects to enhance academic achievement in classrooms with a fixed composition. As a major contribution of this study, we seek to provide an empirical understanding of this issue based onobserva- tionaldata. We believe that our findings reveal so far neglected peer relationships and can inspire future research that reconsiders similar areas of research onexperimentaldata.
1.2. Deskmates
One way in which a teacher can intervene in peer effects based on physical proximity and, as a consequence, in the social network dy- namics of the classroom, is in the design of seating arrangements. In current practice, there are no universal standards that guide teachers in determining seating in the classroom (Gremmen, van den Berg, Segers,
& Cillessen, 2016). In many countries, students share desks, and seating locations are determined by the teacher. Some seating-policy guidelines are available on the internet (Appendix Table A1) and in periodicals for teachers. Our qualitative survey evidence and the sources available for various countries (Appendix Table A1) highlight the fact that teachers often consider rotation, collaboration with others, class discipline, class activity, gender similarity, cultural similarity, friendship, disorders, special abilities, height, visual abilities, and handedness when de- termining seating locations. Some teachers in better schools rely on simple, self-conducted sociometric techniques and force friendship- based segregation.
Previous research in the sociology of education has studied the di- rect effect of physical seating location on performance. Reviewing the literature,Montello (1988)found that seating location has little or no effect on school marks, but does have an impact on course participation and academic attitudes. Other studies are more optimistic about the relationship between seating location and performance (Benedict &
Hoag, 2004; Buckalew, Daly, & Coffield, 1986). Some scholars have even translated research results into practical policy recommendations (Rathvon, 2008;Wannarka & Ruhl, 2008).
In terms of social influence, however, it is not the seating location, but who is sat at the same desk that is relevant. Deskmates are of particular importance in school because proximity is a major determi- nant of social influence (Marmaros & Sacerdote, 2006;Rivera et al., 2010;van Duijn et al., 2003). Different mechanisms may contribute to this. First, deskmates may help each other during their studies and also during assignments. They may offer help more than others, because their frequent interaction is framed by the academic context. Second, deskmates might provide good (or bad) examples and act as role models, thus they can motivate (or demotivate) others to study. Third, being seated next to another person can bring about friendship, espe- cially in classrooms that contain freshmen. This is of particular im- portance, since teachers may have the opportunity to foster interethnic contact and friendships by tailoring deskmate relations. Fourth, desk- mates can easily copy answers from each other, which implies a con- vergence in their results.
As deskmates both directly and via friendship evolution play an important role in the formation of academic aspirations and achieve- ment, seating arrangements could in principle be used to ensure ideal conditions for academic achievement. Since deskmates may become
friends over time, the net effect of deskmate influence is difficult to estimate. Similarly, when seating is not determined by the teacher, students often opt to sit next to their friends. As deskmates and friends largely overlap in both cases, to uncover the true nature of peer effects any analysis should assess the deskmate effect that isnetof friendship influence. For such an approach, social network data must be combined with information about the test scores of friends and deskmates. The current study aims to do this by matching two unique datasets from Hungary.
1.3. Deskmates and ethnic integration
The issue of deskmate effects is particularly important in the context of interethnic classrooms. While opportunities for interethnic friendship are enhanced in integrated schools, the selection of friends based on ethnic similarity results in the segregation of friendship relations (Moody, 2001; Stark & Flache, 2012). Friendship networks remain segregated in integrated schools in the USA (Joyner & Kao, 2000;Kao &
Joyner, 2004;Moody, 2001;Quillian & Campbell, 2003) and elsewhere (Baerveldt, Van Duijn, Vermeij, & Van Hemert, 2004; Stark, 2015), including Hungary (Boda & Néray, 2015;Grow, Takács, & Pál, 2016).
Ethnic homophily – the tendency to select peers of the same eth- nicity – biases friendship choice, as well as the endogenous choice of deskmates. Teachers may also be – and typically are – tempted to de- termine seating patterns in line with ethnic similarity. As a con- sequence, it is expected that Roma students will have on average worse- performing deskmates than their non-Roma peers. The question is whether this test-score gap could be eliminated if such a difference were eliminated (i.e. if Roma and non-Roma students had deskmates of identical ability). Despite the likely significant consequences, little is known about how deskmate relations affect interethnic friendship and academic performance. As teachers are able to manipulate seating ar- rangements, this is a possible method of intervening to influence test- scores and may be appropriate for mitigating the ethnic test-score gap.
The potential for using seating arrangements to reduce the dis- advantageous position of an ethnic minority group is certainly pro- mising, but the empirical associations must first be demonstrated. A major contribution of this study is how it tests for the presence of these empirical associations for the first time.
2. Data and method 2.1. The context
Special attention is devoted to a disadvantaged ethnic group: the Roma. The Roma constitute the largest and poorest ethnic minority group in Europe. Roma history has been characterized by separation, exclusion, and sustained disadvantage (Hancock, 2002). In Hungary, inequalities persist because of the high level of residential and school segregation, as well as the prevalent prejudice against the Roma (Kertesi & Kézdi, 2011a, 2012, 2016). The Roma are more highly concentrated in certain areas of the country, including Northern and Eastern Hungary, which region is the focus of our social network data.
Roma students lag behind their classmates in school. They receive lower marks, are more likely to have to repeat a grade or to drop out, and are less likely than Hungarians to pursue study tracks that have high earning potential (Kertesi & Kézdi, 2010). The vast majority of Roma leave education without a secondary school certificate, and only a tiny proportion go on to tertiary education (Kertesi & Kézdi, 2016).
The ethnic test-score gap in the eighth grade is approximately one standard deviation for both reading and mathematics, which is com- parable to the gap that was observed in the 1980s between white and African-American students of the same age group in the United States, or the test-score gap between white and black college-goers (Card &
Rothstein, 2007;Kertesi & Kézdi, 2011b).
The academic aspirations of Roma are hindered by ethnicity-based
segregation of relationships in the classroom. As a consequence, there is no guarantee that school and classroom integration triggers the emer- gence of intergroup friendship relations on a scale capable of moder- ating the large differences that exist (Boda & Néray, 2015;Grow et al., 2016;Kisfalusi, Janky, & Takács, 2018).
2.2. Data
We investigate the effect of friends and deskmates on test-score growth in ethnically mixed classrooms in Hungary by merging two datasets: (1) a longitudinal social network data from secondary schools with a mixed Hungarian-Roma composition (Wired into Each Other;
henceforth Wireo); and (2) individual test scores from a math and reading comprehension task from the National Assessment of Basic Competences (NABC).
2.2.1. Wired into each other
Wireo data was gathered by the Lendület Research Center for Educational and Network Studies (RECENS), part of the Hungarian Academy of Sciences Center for Social Sciences and has been analyzed extensively (Boda, 2019; Boda & Néray, 2015; Grow et al., 2016;
Kisfalusi, Pál, & Boda, 2018;Pál, Stadtfeld, Grow, & Takács, 2016).
With a focus on the dynamics of social networks, Wireo sampled entire classrooms. The non-representative sample of Wireo involved forty classrooms in seven secondary schools with mixed Hungarian-Roma composition in four different Hungarian settlements (Table 1). The survey was self-administered and paper-and-pencil-based, and was completed during regular classes with the help of trained interviewers.
The majority of items assessed multiplex social network information, including friendship and deskmate relationships. The consent of parents (caretakers) was a prerequisite for participation. Students without permission did not participate.
Wireo respondents were ninth-graders in the first wave (N= 1,424, November 2010) and tenth-graders in the third (N= 1,170, April 2012). Note that the majority of students in the first wave did not know each other previously since students change school after the eighth grade when they finish primary school and begin secondary school.
Among freshmen friendships are probably not yet stable and the impact of deskmate relationship may be of paramount importance. Deskmate relations in the first wave were probably the first sources of peer in- fluence to be free of other effects. Moreover, friendship ties might emerge as a consequence of the physical proximity of deskmate ties.
In further waves of Wireo, students were not followed if they had changed classes for whatever reason (the most likely reason was grade repetition), but newcomers were included in the subsequent wave.
From this study, we focused on those individuals who participated in the first and third waves of Wireo. These 999 respondents will be re- ferred as theWireo sample.
2.2.2. National Assessment of Basic Competences (NABC)
The aim of the compulsory NABC test is to assess how students use
the knowledge they have learned in school in new situations with a practical focus. The NABC follows students even if they change class.
The NABC tests in 2012 were completed by all 102,037 students in Hungary who were enrolled in the tenth grade of any track and school type (Balázsi, Lak, Szabó, & Vadász, 2013).
The PISA-likereading comprehensionandmathematicstests in NABC require a total of four 45-minute sessions with a 10-minute break be- tween them. They are completed in the students’ usual classroom, ty- pically overseen by a local teacher, and are marked centrally. They are supplemented with a questionnaire about social background which is filled in at home. Students with special educational needs conduct only the reading test.
The current study uses both the reading comprehension and the mathematics test results as previous research has highlighted large qualitative differences between them. In Hungary, boys score somewhat higher on mathematics tests, and their advantage grows over time, while girls perform better at reading comprehension (e.g.,Balázsi, Lak, Ostorics, Szabó, & Vadász, 2015). For students who progressed nor- mally, the change in test scores between 2010 and 2012 was analyzed;
for students who repeated a grade, the eighth-grade test scores were used from the year in which the students were in this grade. Note that the first measurement of test scores (eighth grade) occurred prior to entering secondary school (also prior to being samled into Wireo). The second measurement took place in secondary schools in the tenth grade.
2.2.3. The matching procedure
Wireo (third wave) and NABC data were matched in the tenth grade. In this year the two surveys were completed within a month of each other. Matching was possible, as the classrooms in Wireo were unequivocally identified in the NABC dataset, and the two surveys contained identical questions. Whereas students filled in Wireo at school, they took the background NABC questionnaire home so they could ask their parents for help. The difference in survey mode might, therefore, explain the differences in students’ answers in Wireo and NABC.
Respondents were matched by their responses to identical survey items in the two datasets. First, gender, year of birth, and month of birth (day of birth was not available) were considered, as these are stable characteristics that are remembered well (standard key variables inTable 2).
If matching was not successful on the basis of the standard key variables, additional variables were used (listed in subsequent rows of the table). The additionally deployed variables were the father’s highest educational achievement, the mother’s highest educational achieve- ment, the student’s postcode, and the estimated number of books at home. All of these questions were asked identically in the two datasets.
Through the use of this method, additional cases with valid NABC test scores could be matched. In Column 1 ofTable 2, each row indicates the number of cases merged from NABC to Wireo based on the standard key variables and the variables in the given row. In Column 2 each row contains the cases that have been added to the sum of the previous rows Table 1
Distribution of 40 classrooms selected for the Wireo survey according to type of school and location.
Location of school Type of settlement School ID Type of school
Grammar school Secondary vocational school Vocational school Total
Northern HU County seat School 1 5 5
School 2 4 5 9
Northern HU Small town School 3 3 1 2 6
Eastern HU Small town School 4 3 1 4
School 5 2 3 5
Central HU Capital School 6 3 4 7
School 7 4 4
15 11 14 40
sequentially, row by row.
If one-to-one matching was not possible (there were more re- spondents with the same values for key variables), then the mean test score of these cases was assigned to each identical case in Wireo. If parents level of education was known, then we calculated the mean according to the standard key variable and parental education. If only the standard key variables were known, than the mean variables were calculated accordingly. In all other cases we simply took the class average.
2.2.4. Limitations of matching
Two biases of the matching algorithm should be noted. First, stu- dents might lack test scores. These cases were imputed by using the classroom mean value. Although the reason for missing data was not known, it is reasonable to assume that students with poor performance were more likely to lack test scores. In addition to the general tendency that poor performance is correlated with absenteeism, schools, con- scious of the importance of test-score statistics, may “recommend” to poor performers that they stay at home on the day of tests (Jacob &
Levitt, 2003). Since average values were calculated using the data of those with valid test scores, imputation was undertaken with a poten- tiallyhigheraverage score than the true test score would have been.
A second bias is in the opposite direction. Our analyses contain those who participated in both the first and the third waves of Wireo.
These respondents, by definition, did not repeat a grade in between.
Therefore, their performance might have been better than those who participated in NABC in the tenth grade. Calculating the average test scores among ten-graders in NABC and assigning them to the missing cases in the Wireo sample might, therefore, have resulted inlowerva- lues than would actually have been the case. Unfortunately, we cannot estimate the extent to which these two counteracting biases influence our results or the extent to which they compensate each other.
2.3. Measures
2.3.1. Dependent variable: standardized test scores from NABC
Individual competence scores for reading comprehension and mathematics in NABC are calculated from several item responses (Balázsi, Felvégi, Rábainé Szabó, & Szepesi, 2006). For the reading comprehension, students read 5–8 short texts and answer 7–15 ques- tions about each. For maths, students have to solve realistic everyday problems and answer 1–4 questions about each problem by applying
their knowledge of mathematics. Test scores are standardized to the total cohort averageofNABC 2012(tenth-grade test scores), with a zero mean and one-unit standard deviation.
2.3.2. Prior test scores and stable background variables
Models contain prior test scores from the eighth grade.
Consequently, they explain change (development) in individual test scores. By including earlier scores, stable personal (ability, personality, etc.) and social (parental and residential) variables that are assumed to have an influence on (prior) test scores are controlled for.
2.3.3. Deskmate relations
Social network information about classmates was collected in mul- tiple dimensions in Wireo. The full roster method was used, hence students could indicate their relationship to all their classmates. In one of the full roster network items, the presence of deskmate relations was identified through an agreement with the statement: “I used to sit next to him/her during class.” Deskmates were identified either in the first (beginning of the ninth grade) or the second (end of the ninth grade) wave of Wireo. Traditionally and typically, but not in every classroom in Hungary, two-person desks are arranged in a grid shape. In certain settings, a student has more than one deskmate. A qualitative report by Wireo survey assistants confirmed that most classrooms in the sample were arranged in the traditional style, and included two-person desks.
In our default operationalization, we considered deskmates to be those individuals who were mentioned by respondents as deskmates, regardless of whether the deskmate nomination was reciprocated. This choice is typical in social network studies that take account of social influence (e.g.,Crosnoe et al., 2003;Knecht, 2007). We must empha- size, however, that since the deskmate relationships are self-reported, the measurement is subject to memory bias. However, this oper- ationalization is consistent with the assumption that those deskmates are influential that are consciously recalled (in contrast to those who are not).
Besides this specification, there are alternative ways of taking into account the influence of deskmate relations. A first alternative is the restriction of the analysis to reciprocated deskmate nominations. This leads to a restricted set, as students did not mention every deskmate they had: 28% of deskmate nominations were reciprocated in the first wave, and 35% in the second. This asymmetry probably occurs due to imperfect recall. Multiple nominations are possible because different subjects are taught in different rooms and students have seats and deskmates specific to the given room only. As a robustness check, we estimated all our models also using only reciprocated deskmate nomi- nations.
A second method involves considering every relationship that was mentioned by at least one of the two students. None of the methods are capable of dealing with those deskmates who are not recalled by any of the students and who might be less influential, as the former are not even remembered. Thus, our measure might scale up the deskmate ef- fect.
2.3.4. Friendship relations
Each student was asked to indicate their relationship with all their classmates using the following five-point scale: “I hate him/her” (coded with -2), “I dislike him/her” (-1), “He/she is neutral to me” (0), “I like him/her” (+1), or “He/she is a good friend” (+2) in Wireo. The last category (+2) was defined asfriendshipin the first and second waves.
Friendship relations could also be asymmetrical and werenotsymme- trized. Relevant friends were defined as those who were nominated by the respondent. Friendship relations from the first wave might not be stable since students reported on their friends at the beginning of the school year when they were starting out in a new type of school (sec- ondary school instead of primary school).
Table 2
Results of matching and imputation of test scores from NABC to respondents in the Wireo sample (N= 999).
Successful added new tenth-grade test scores from NABC to Wireo
Newly added tenth- grade test scores as the ratio of the total sample (N = 999)
ONE-TO-ONE MATCH
Standard key variables 404 40.44%
+ Father’s Education 167 16.72%
+ Mother’s Education 96 9.61%
+ Parents’ Education 14 1.40%
+ Postcode 64 6.41%
+Nof books in household 20 2.00%
Total 764 76.48%
MEAN REPLACEMENT
Standard + Parents’ Edu. 13 1.30%
Standard 56 5.61%
Class average 166 16.62%
Total 235 23.52%
Notes: In Column 1 each row indicates the number of cases merged from NABC to Wireo based on the standard key variables and the variable in the given row.
In Column 2 each row contains the cases that have been added to the sum of the previous rows sequentially, row by row.
2.3.5. Test scores of deskmates and friends
Theaverageof the eighth-grade test scores of identified deskmates and friends was used among the predictors. If an individual had no deskmate (or reported to having no friends), missing data about the test score of deskmates (friends) was imputed using the classroom average.
2.3.6. Seating policy in the classroom
Information about the presence of a seating policy was obtained from the homeroom teacher in the first wave. In 25 classrooms (N= 578) the teacher determined the seating arrangements, while there was a free seating choice in 12 classrooms (N= 339). There were three classrooms (82 students) for which information on the seating policy was missing. Note that there is a significant difference between the subsamples even with regard to the eighth grade test scores (mean difference in reading: 0.80,t= 13.42,p< 0.001; mean difference in math: 0.77,t= 12.70,p< 0.001). Free seating choice is more likely to occur in better-performing classrooms. The distributions of test scores in the two kinds of classrooms are presented in Fig. A1 in the Appendix.
Seating policy seems to be relatively stable: the analysis of teacher survey responses indicates that seating policies did not change in two- thirds of the classrooms across different waves of Wireo.
2.3.7. Ethnicity
Roma ethnicity was coded according to the responses of the homeroom teacher in the first wave of Wireo. Missing cases were im- puted from the teachers’ answers in later waves.
2.3.8. Classroom-fixed effects
Since academic performance depends largely on classroom and teacher characteristics, we included classroom-fixed effects (dummy variables identifying classrooms in the sample) in all models. This means that every variable should be interpreted relative to the class- room level. Using classroom-fixed effects is a parsimonious way to control for unobserved heterogeneity between classrooms (e.g., differ- ences in the quality of teachers, textbooks, pedagogical style).
2.4. Descriptives
Table 3shows the density of deskmate and friendship networks and their overlap in the first two waves of Wireo. While for all students (N= 999) the number of friendship nominations decreased slightly (t
= 2.80, p< 0.01), the number of deskmates increased (t= -8.01, p< 0.01). Additionally, the proportion of deskmates increased among friends (t = -8.20,p< 0.01). Meanwhile, the proportion of friends among deskmates did not change (t= 0.81,p< 0.42). These trends are identical regardless of the classroom seating policy, and support the assumption that deskmates become friends over time.
2.5. Estimation
We estimated standardized individual test scores in the tenth grade using linear models. The outcome variable is explained by (1) a stu- dent’s previous owneighth-grade test score; (2) the mean of eighth-
grade test scores ofall deskmatesof the respondent; and (3) by the mean of eighth-grade test scores ofall friendsof the respondent, controlling for classroom-fixed effects. Unobserved school heterogeneity is con- sidered by clustering standard errors at the school level.
As classrooms with and without a seating policy have very different average scores (Fig. A1), we fitted models for the whole Wireo sample (N= 999), and also for the restricted sample of schools where teachers determined seating (N= 578).
3. Results
3.1. The impact of deskmates
Table 4shows the main results for reading comprehension, and Table 5for mathematics. Models 1–3 and 7–9 are for the total sample, while Models 4–6 and 10–12 are for the restricted sample of classrooms where the teacher allocated the seats. In Panel A (above), deskmate and friendship ties are determined on the basis of networks at the beginning of the ninth grade (when students were freshmen), while in Panel B (below), ties are considered using the second wave (end of the ninth grade).
In terms of reading outcomes (Table 4), former deskmates have a positive effect on test-score development on reading in the total (Model 1:β2= 0.096,p= 0.08) and also in the restricted sample (Model 4:
β2= 0.124, p< 0.06). This indicates that deskmates influence the changein individual reading test scores positively, but this effect is only marginally significant (at the 10% level). Friends’ test scores also po- sitively influence individual changes in test scores between the eighth and the tenth grade. The estimated coefficients (β3) are about 0.121 (p< 0.05) in Model 2, but in Model 5 the parameter is significant at the 8% level. The impact of deskmates and that of friends at the be- ginning of the ninth grade (Panel A) are approximately the same (Models 1 and 2). The individual effect of former deskmates and friends is not sustained when both are included in the estimation (Models 3 and 6), but the more recent deskmate effect prevails as important when networks from the second wave of Wireo are considered (Models 9 and 12).Recent deskmates influence the increase in individual test scores more than former deskmates. The difference between the estimated parameters for deskmates’ reading test scores between Models 1 and 7 inTable 4is marginally significant (χ2= 2.77,p= 0.096). This might indicate that the effect of deskmates is short-lived: the effect of former deskmates is attenuated, and more recent deskmates might affect in- dividual achievement. The same difference, however, was not sig- nificant in classes where the teacher determined the seating (Models 5 and 11; χ2= 0.19,p= 0.66).
Concerning mathematics, it is certainly surprising to find that former friends (Wireo, first wave) negatively influence test score growth (Models 2, 5 and 6). The reasons for this are not fully under- stood. The situation might, however, be connected to the fact that at the time of the first wave of Wireo students had known each other for only a couple of months. Friendships reported in the first wave may, there- fore, not be deep and stable. The estimated parameters for recent Table 3
Mean degrees of deskmate and friendshipnominations(potentially asymmetrical) and their overlap.
Nof friends Nof deskmates % of deskmates among friends % of friends among deskmates
W1 W2 W1 W2 W1 W2 W1 W2
Free seating (N= 339) 6.64 6.00 4.16 5.47 42.40 53.93 61.08 59.24
The teacher determines seating (N= 578) 5.67 5.25 3.24 4.42 35.62 47.56 54.17 53.01
All classrooms
(N= 999) 6.16 5.56 3.71 4.94 38.37 50.39 56.57 55.25
Most classrooms in Wireo had two-person desks, which would result in one deskmate for every student. Subjects, however, are taught in different rooms and students have seats and deskmates specific to the given room only. This explains why the average number of deskmates is larger than one.
friends are smaller and not significant in Models 8, 5 and 12. The dif- ference between the effect of former and recent friends is statistically significant in classes where the teacher determined seating (Models 5
and 11; χ2= 4.31,p< 0.05; Models 6 and 12; χ2= 7.21,p< 0.01), indicating that more recent friends do not provide a negative effect on students' test scores.
Table 4
Deskmates’ and friends’ effect on tenth-gradereadingtest-score, main effects.
No restriction Teacher determines seating
Models (1) (2) (3) (4) (5) (6)
PANEL A β1Reading score, 8thgrade 0.512** 0.510** 0.510** 0.526** 0.529** 0.526**
(0.042) (0.042) (0.041) (0.059) (0.055) (0.058)
β2Deskmates’ (W1) 8thgrade reading score 0.096+ 0.061 0.124+ 0.100
(0.045) (0.068) (0.052) (0.100)
β3Friends’ (W1) 8thgrade reading score 0.121* 0.079 0.121+ 0.053
(0.047) (0.077) (0.055) (0.120)
Constant −0.208** −0.206** −0.203** −0.343** −0.343** −0.330**
(0.008) (0.009) (0.009) (0.026) (0.047) (0.040)
Observations 999 999 999 578 578 578
Adjusted R-squared 0.801 0.801 0.801 0.717 0.716 0.716
Classroom FE YES YES YES YES YES YES
F-test 87.49** 74.51** 61.54** 75.70** 50.35** 52.75**
Models (7) (8) (9) (10) (11) (12)
PANEL B β1Reading score, 8thgrade 0.509** 0.511** 0.509** 0.527** 0.532** 0.527**
(0.043) (0.043) (0.043) (0.058) (0.057) (0.059)
β2Deskmates’ (W2) 8thgrade reading score 0.143* 0.123+ 0.142* 0.148+
(0.040) (0.063) (0.041) (0.071)
β3Friends’ (W2) 8thgrade reading score 0.111 0.046 0.057 −0.016
(0.061) (0.088) (0.071) (0.104)
Constant −0.202** −0.207** −0.199** −0.334** −0.371** −0.339**
(0.008) (0.009) (0.008) (0.033) (0.053) (0.047)
Observations 999 999 999 578 578 578
Adjusted R-squared 0.801 0.800 0.801 0.717 0.714 0.716
Classroom FE YES YES YES YES YES YES
F-test 81.31** 89.94** 62.77** 51.64** 50.90** 36.54**
Robust standard errors (clustered according to schools) are in parentheses. ** p < 0.01, * p < 0.05, + p < 0.1.
W1 refers to the first wave (beginning of the 9thgrade); W2 refers to the second wave (end of the 9thgrade) of theWired into Each Othersurvey.
Table 5
Deskmates’ and friends’ effect on tenth-grademathtest-score, main effects.
No restriction Teacher determines seating
Models (1) (2) (3) (4) (5) (6)
PANEL A β1Math score, 8thgrade 0.482** 0.483** 0.483** 0.497** 0.503** 0.501**
(0.059) (0.057) (0.057) (0.079) (0.073) (0.074)
β2Deskmates’ (W1) 8thgrade math score −0.013 0.027 0.010 0.081
(0.023) (0.037) (0.032) (0.052)
β3Friends’ (W1) 8thgrade math score −0.093+ −0.112 −0.124* −0.183*
(0.043) (0.062) (0.042) (0.068)
Constant −0.288** −0.300** −0.299** −0.459** −0.518** −0.509**
(0.008) (0.013) (0.012) (0.025) (0.045) (0.040)
Observations 999 999 999 578 578 578
Adjusted R-squared 0.761 0.762 0.762 0.653 0.655 0.655
Classroom FE YES YES YES YES YES YES
F-test 41.54** 54.40** 51.89** 196.2** 37.39** 452.4**
Models (7) (8) (9) (10) (11) (12)
PANEL B β1Math score, 8thgrade 0.481** 0.482** 0.481** 0.497** 0.498** 0.498**
(0.059) (0.058) (0.058) (0.077) (0.075) (0.075)
β2Deskmates’ (W2) 8thgrade math score 0.028 0.044 0.043 0.066
(0.027) (0.044) (0.027) (0.062)
β3Friends’ (W2) 8thgrade math score −0.013 −0.039 −0.025 −0.062
(0.051) (0.070) (0.067) (0.100)
Constant −0.282** −0.288** −0.285** −0.443** −0.475** −0.461**
(0.008) (0.013) (0.012) (0.031) (0.063) (0.052)
Observations 999 999 999 578 578 578
Adjusted R-squared 0.762 0.761 0.761 0.653 0.653 0.653
Classroom FE YES YES YES YES YES YES
F-test 45.98** 37.35** 36.37** 52.86** 41.90** 36.61**
Robust standard errors (clustered according to schools) are in parentheses. **p < 0.01, * p < 0.05, + p < 0.1.
W1 refers to the first wave (beginning of the 9thgrade); W2 refers to the second wave (end of the 9thgrade) of theWired into Each Othersurvey.
A major difference in the deskmate effect between math and reading is that whereas with reading deskmates influence individual test-score gains, they do not have a significant effect on scores for math. One reason may be that language skills are easier to influence than mathe- matical skills, whose accumulation involves more of a natural predis- position. Being seated next to someone who is good at reading and who likes reading might motivate students to read more (role adaptation), which can positively influence reading outcomes. It is also more plau- sible to assume that deskmates talk about what they have read in their free time (and this is an inspiration to read more), rather than the math problems they have solved. Furthermore, in the school curriculum, students in lower grades have more Hungarian lessons than math les- sons, and the social influence of deskmates may be correlated to the time students spend together. Peers’ verbal ability might also represent greater social skill that creates the ground for friendship formation. By contrast, mathematical skills might be less visible and useful in the interpersonal social space. Our finding is consistent with some prior evidence.Zimmerman (2003)andCarrell et al. (2009)found that peers' verbal SAT score had, but the peers’ math score did not have a sig- nificant effect on students’ post-treatment GPA.
Our analysis helps to disentangle the effect of deskmates and that of friends on test score growth. We ran models with the effect of desk- mates only (Type I: Models 1, 4, 7, and 10 inTables 4 and 5), with the effect of friends only (Type II: Models 2, 5, 8, and 11), and models that included both (Type III: Models 3, 6, 9, and 12). Type III models show deskmate effects net of the effect of friends. In addition to these models, we further explored the effect of deskmates net of friends. We con- ducted separate analyses for deskmates who were and who were not friends (Table 6). We found (Table 6, Model 7) that the eighth-grade
reading test scores of recent deskmates who were also friends influence tenth-grade reading test scores significantly (0.097 and p< 0.05), while deskmates who were not friends did not have a significant effect (Model 8). In contrast, recent deskmates who werenotfriends, rather than those who were also friends, seem to be marginally influential in terms of math test scores (Models 11 and 12). The differences in the results for reading and math test scores might indicate that friendship as a possible mediator of the deskmate effect is domain specific and the formation of social ties is not a necessary condition under which peer effect occurs (Foster, 2006).
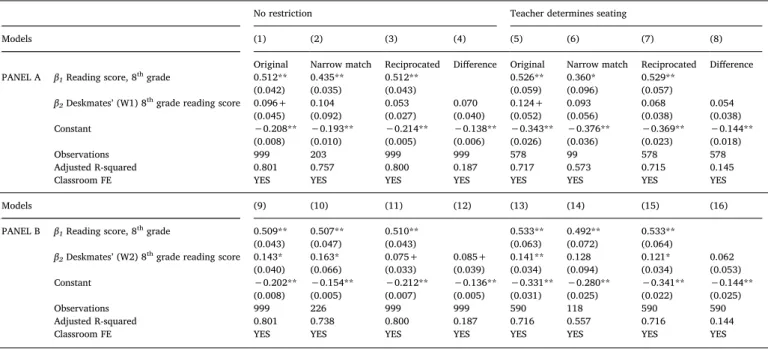
We conducted further robustness checks, employing: (1) models that relied on the narrow one-to-one match of Wireo and NABC data, (2) models that considered reciprocated deskmate nominations, and (3) models that used the difference between individual tenth- and eighth- grade test scores, which difference is explained by the change in ninth- grade deskmates’ tenth- and eighth-grade test scores. Please note that this model does not correspond fully to the requirements of difference- in-difference estimation. We calculated the difference in students’ own test scores between grade 8 (primary school) and 10 (secondary school). Since we had no information about students’ deskmates in primary school, we calculated the difference in test scores (between the eighth and tenth grade) of students’ secondary school deskmates de- fined according to ninth-grade social network information. Ideally, we would have calculated the difference in the scores of students’ primary school- (eighth-grade) and secondary school (tenth) deskmates. As a consequence of this, our difference model is not fully capable of elim- inating unobserved heterogeneity in the selection of deskmates. The consequences of this are discussed later. The results of a robustness check for reading comprehension are shown inTable 7, and for math in Table 8.
InTable 7, there is no sign that the original specification and a specification relying on the narrow one-to-one match of Wireo and NABC data produce statistically different estimations for the deskmate effect. This suggests that our matching procedure did not introduce bias into the estimation of the coefficient of interest.
In models that consider reciprocated deskmate nominations, the effect of deskmates is smaller compared to the original specification (the difference in the deskmate effect is only significant between Models 9 and 11 (χ2= 13.56,p< 0.01). These results correspond to our assumption that deskmates who are consciously recalled are more influential since respondents are more liable to mention those desk- mates whose memories are “burnt-in” and who had an influence. These differences are in line with recent findings of the directionality of peer effects in social ties (An, 2016).
The difference-model i finds a smaller size deskmate effect com- pared to the original specification (the difference in the deskmate effect between Models 1 and 4 is not significant atp< 0.05, but in all other models the deskmate effect differs statistically between the original and the difference-model atp< 0.05). The difference-in-difference esti- mator would provide an unbiased estimation under the assumption of parallel trends over time (Angrist & Pischke, 2009). In our particular case, this would mean that the unobserved selection of deskmates is the same between the two time points (eighth and tenth grades). Because students moved up from the primary to the secondary school, assuming time-invariant unobserved deskmate selection is implausible. First, students have deskmates from a different pool of peers, since they have changed schools. Second, even if the individual characteristics of peer selection are stable over time, students may choose relatively1different deskmates in primary and secondary school. Having only information Table 6
Impact of friend and non-friend deskmates on tenth-grade test scores.
Reading Math
PANEL A (W1) (1) (2) (5) (6)
Own test score, 8thgrade 0.509** 0.448** 0.473** 0.473**
(0.044) (0.049) (0.067) (0.073) Friend deskmates’ test score,
8thgrade 0.089 −0.023
(0.048) (0.021)
Not-friend deskmates’ test
score, 8thgrade −0.008 −0.041
(0.034) (0.039)
Constant −0.172** −0.188** −0.234** −0.247**
(0.002) (0.006) (0.006) (0.005)
Observations 767 552 767 552
Adjusted R-squared 0.790 0.796 0.752 0.757
Classroom FE YES YES YES YES
F-test 178.3** 54.18** 27.47* 22.43**
PANEL B (W2) (7) (8) (11) (12)
Own test score, 8thgrade 0.511** 0.509** 0.476** 0.461**
(0.035) (0.032) (0.060) (0.076) Friend deskmates’ test score,
8thgrade 0.097* 0.017
(0.030) (0.034)
Not-friend deskmates’ test
score, 8thgrade 0.054 0.090+
(0.044) (0.038)
Constant −0.183** −0.159** −0.258** −0.221**
(0.004) (0.004) (0.008) (0.006)
Observations 814 652 814 652
Adjusted R-squared 0.789 0.785 0.761 0.757
Classroom FE YES YES YES YES
F-test 106.8** 135.8** 32.00** 32.61**
Robust standard errors (clustered according to schools) are in parentheses. **
p < 0.01, * p < 0.05, + p < 0.1.
W1 refers to the first wave (beginning of the 9thgrade); W2 refers to the second wave (end of the 9thgrade) of theWired into Each Othersurvey.
1Many former good students in the primary school, for instance, might have become average students in the secondary school, thus if they chose good students as deskmates in primary school, with the same set of individual characteristics they might have chosen average deskmates in secondary school.
Please note that this argument also counters the parallel trend assumption.
about students’ secondary school deskmates when they were in the eighth grade of primary school, and lacking information on students’
primary school deskmates, we are not able to eliminate the unobserved selection mechanism of deskmates. Under these circumstances, our original model using the lagged dependent variable is more efficient (O’Neill, Kreif, Grieve, Sutton, & Sekhon, 2016).
Table 8summarizes the same robustness checks for math. Relying on reciprocated deskmate nominations, former deskmates exert a ne- gative influence on tenth-grade test scores (Models 3 and 7). Though the difference in the deskmate effect relative to the original model is not significant between Models 1 and 3 (χ2 = 2.54, p= 0.11), it is
significant between Models 5 and 7 (χ2 = 4.2,p< 0.05). The sur- prising negative result for the reciprocated deskmate relationship (Model 7) might underline the importance of actual deskmates since the deskmate effect is marginallypositive(Model 15) if reciprocated recent deskmates are considered (the difference in the deskmate effect is sig- nificant between Models 7 and 15 (χ2= 9.79,p< 0.01)). Using the difference-model we found smaller effect sizes for the deskmate effect, but they are statistically not significant.
Gender differences in the effect of deskmates and friends are ana- lyzed in Table A2 for reading and Table A3 for math. The main effect of gender is not significant for reading (Table A2), but girls perform worse Table 7
Deskmates’ effect on tenth-gradereadingtest-score, robustness check.
No restriction Teacher determines seating
Models (1) (2) (3) (4) (5) (6) (7) (8)
Original Narrow match Reciprocated Difference Original Narrow match Reciprocated Difference
PANEL A β1Reading score, 8thgrade 0.512** 0.435** 0.512** 0.526** 0.360* 0.529**
(0.042) (0.035) (0.043) (0.059) (0.096) (0.057)
β2Deskmates’ (W1) 8thgrade reading score 0.096+ 0.104 0.053 0.070 0.124+ 0.093 0.068 0.054
(0.045) (0.092) (0.027) (0.040) (0.052) (0.056) (0.038) (0.038)
Constant −0.208** −0.193** −0.214** −0.138** −0.343** −0.376** −0.369** −0.144**
(0.008) (0.010) (0.005) (0.006) (0.026) (0.036) (0.023) (0.018)
Observations 999 203 999 999 578 99 578 578
Adjusted R-squared 0.801 0.757 0.800 0.187 0.717 0.573 0.715 0.145
Classroom FE YES YES YES YES YES YES YES YES
Models (9) (10) (11) (12) (13) (14) (15) (16)
PANEL B β1Reading score, 8thgrade 0.509** 0.507** 0.510** 0.533** 0.492** 0.533**
(0.043) (0.047) (0.043) (0.063) (0.072) (0.064)
β2Deskmates’ (W2) 8thgrade reading score 0.143* 0.163* 0.075+ 0.085+ 0.141** 0.128 0.121* 0.062
(0.040) (0.066) (0.033) (0.039) (0.034) (0.094) (0.034) (0.053)
Constant −0.202** −0.154** −0.212** −0.136** −0.331** −0.280** −0.341** −0.144**
(0.008) (0.005) (0.007) (0.005) (0.031) (0.025) (0.022) (0.025)
Observations 999 226 999 999 590 118 590 590
Adjusted R-squared 0.801 0.738 0.800 0.187 0.716 0.557 0.716 0.144
Classroom FE YES YES YES YES YES YES YES YES
Robust standard errors (clustered according to schools) are in parentheses. ** p < 0.01, * p < 0.05, + p < 0.1.
W1 refers to the first wave (beginning of the 9thgrade); W2 refers to the second wave (end of the 9thgrade) of theWired into Each Othersurvey.
Table 8
Deskmates’ effect on tenth-grademathtest-score, robustness check.
No restriction Teacher determines seating
Models (1) (2) (3) (4) (5) (6) (7) (8)
Original Narrow match Reciprocated Difference Original Narrow match Reciprocated Difference
PANEL A β1Math score, 8thgrade 0.482** 0.420** 0.484** 0.497** 0.344 0.505**
(0.059) (0.109) (0.057) (0.079) (0.197) (0.075)
β2Deskmates' (W1) 8thgrade math score −0.013 −0.071 −0.054* 0.003 0.010 −0.004 −0.068+ −0.022
(0.023) (0.086) (0.019) (0.033) (0.032) (0.145) (0.031) (0.050)
Constant −0.288** −0.190** −0.293** −0.147** −0.459** −0.397** −0.491** −0.180**
(0.008) (0.003) (0.010) (0.005) (0.025) (0.095) (0.040) (0.023)
Observations 999 203 999 999 578 99 578 578
Adjusted R-squared 0.761 0.742 0.762 0.186 0.653 0.545 0.654 0.144
Classroom FE YES YES YES YES YES YES YES YES
Models (9) (10) (11) (12) (13) (14) (15) (16)
PANEL B β1Math score, 8thgrade 0.481** 0.511** 0.481** 0.498** 0.472* 0.497**
(0.059) (0.112) (0.059) (0.078) (0.174) (0.078)
β2Deskmates' (W2) 8thgrade math score 0.028 0.049 0.029 0.003 0.050 0.046 0.049+ 0.002
(0.027) (0.093) (0.025) (0.053) (0.027) (0.142) (0.024) (0.064)
Constant −0.282** −0.193** −0.282** −0.147** −0.437** −0.343** −0.438** −0.173**
(0.008) (0.003) (0.008) (0.008) (0.031) (0.084) (0.031) (0.031)
Observations 999 226 999 999 590 118 590 590
Adjusted R-squared 0.762 0.754 0.762 0.186 0.653 0.553 0.653 0.142
Classroom FE YES YES YES YES YES YES YES YES
Robust standard errors (clustered according to schools) are in parentheses. **p < 0.01, * p < 0.05, + p < 0.1.
W1 refers to the first wave (beginning of the 9thgrade); W2 refers to the second wave (end of the 9thgrade) of theWired into Each Othersurvey.
than boys in math (Table A3). In general, girls seem to be influenced by their deskmates no more than boys. Girls, however, seem to derive greater benefit from having high-ability friends in reading than boys do (as indicated by the Girl × Friends’ reading score interaction in Table A2; Models 5, 6, and 11). This is only true, however, in classrooms where teachers allocate the seating, and it cannot be generalized since no similar relationship is found in math (Table A3). Therefore, we re- gard the friendship effect among girls as context specific.
Further sensitivity analyses were conducted with regard to the op- erationalization of peer influence. Instead of theaveragetest score of deskmates as the reference point of influence, it is possible that students adapt more readily to extreme (i.e. outstanding, or the poorest) per- formance levels than to others. Robustness checks (not included in the paper) show that the best and the worst-performing deskmates do not have any additional significant impact on individual test scores.
3.2. Deskmate relationships and the ethnic test-score gap
Wired into Each Othercan be used to test whether the deskmates of Hungarian and Roma students performed differently. Deskmates are remarkablydifferentfor the two groups. Roma students have deskmates with significantly lower test scores. The raw test score gap between the deskmatesof Hungarians and Roma is 77% of the standard deviation for the eighth-grade reading scores (t= 12.59,N= 999,p< 0.001) and 67% of the standard deviation for the eighth-grade math scores (t= 10.82,N= 999,p< 0.001).
Descriptive results (Fig. 1) show that the share of Roma deskmates is negatively associated with a change in reading test scores and that having more Roma deskmates is especially harmful to Roma students.
Therefore, it appears necessary to take a closer look at how deskmates influence the test-score gap between Hungarian and Roma students.
Roma ethnicity has a significant negative coefficient for reading (Table 9) and also for math (Table 10). We found, however, no evidence that the Roma achievement gap would decrease if Roma had deskmates of the same ability as their Hungarian peers. Therefore, the ability of deskmates does not mediate the Roma achievement gap concerning the Wireo sample. We found no evidence for the ethnic heterogeneity of the deskmate effect since Roma students obtained no more benefit from sitting next to a high-ability deskmate than their Hungarian peers.
Hence, deskmates’ ability does not moderate the Roma achievement gap.
4. Discussion 4.1. Summary
Peer effects have been shown to be important determinants of academic achievement in school. A large part of what are considered to be peer effects may be attributed to the influence of relevant peers in the classroom. Who are these relevant peers? Sociologists have em- phasized thatfriendsare influential in terms of academic achievement
(Flashman, 2012b; Lomi et al., 2011). However, the formation and maintenance of friendship ties and peer influence can hardly be a target for policy interventions.
This study has highlighted that deskmates are also relevant for academic achievement. This has enormous practical relevance as deskmates can be assigned by the teacher for policy purposes.
Nevertheless, deskmate ties are not independent of friendship potential.
Even when a teacher assigns the seats, deskmates might become friends over time thus teacher can influence how friendships evolve within the classroom. As a major contribution, this study has measured the impact of deskmates net of the general influence of classmates and friends on test-score growth. For this measurement, data from the social network panelWired into Each Otherwas matched with reading comprehension and math test scores from two waves of the National Assessment of Basic Competences register dataset.
Test-score development of students between the eighth and the tenth grades was explained with reference to the eighth-grade test scores of secondary school deskmates and friends using classroom- fixed-effects regression analysis. The results demonstrate that – relative to the classroom average – deskmates have a significant impact on reading comprehension. Recent deskmates (rather than recent friends) are those who really matter for test-score development in reading. The analysis failed, however, to find similarly significant results in the case of math.
We analyzed peer effects among secondary school freshmen in ethnically mixed Hungarian schools in disadvantaged neighborhoods.
The focus of our study makes our results comparable to those of Antecol, Eren, and Ozbeklik (2016); however, compared to the former research we found a positive (instead of negative) effect for peers. Si- milarly, comparing our results to Lu and Anderson's (2015) deskmate research we identified a significant positive deskmate effect on reading test scores (instead of finding nil-effect). Our finding is consistent with Foster (2006), since our results corroborate that social tie formation is not a necessary condition of the peer effect. While friend deskmates have an influence on reading, non-friend deskmates affect math-related achievement. We have argued, however, that social tie formation can be a side effect of deskmate relationships which might have advanta- geous indirect effects.2Nevertheless, in contrast to the literature men- tioned above, our findings are not based on a randomized experiment, thus we may have overestimated the deskmate effect (Feld & Zölitz, 2017).
The extent to which differences in deskmate relationships are re- sponsible for the test-score gap between Hungarian and Roma students was also analyzed. Unfortunately, the results do not imply that seating Fig. 1.The change in own test scores depending on the share of Roma deskmates among Roma and Hungarian pupils.
2Deskmate relations can open up access to new social networks and thus may bridge interethnic relations and decrease prejudice, thereby playing a crucial role in minimizing friendship segregation and in dismantling the normative barriers to the social acceptance of academic achievement (Fryer & Torelli, 2010;Stark, 2015).