CERS-IE WORKING PAPERS | KRTK-KTI MŰHELYTANULMÁNYOK
INSTITUTE OF ECONOMICS, CENTRE FOR ECONOMIC AND REGIONAL STUDIES, BUDAPEST, 2020
Gender Differences in the Skill Content of Jobs
RITA PETŐ – BALÁZS REIZER
CERS-IE WP – 2021/2
January 2021
https://www.mtakti.hu/wp-content/uploads/2021/01/CERSIEWP202102.pdf
CERS-IE Working Papers are circulated to promote discussion and provoque comments, they have not been peer-reviewed.
Any references to discussion papers should clearly state that the paper is preliminary.
Materials published in this series may be subject to further publication.
ABSTRACT
There is significant heterogeneity in actual skill use within occupations even though occupations are differentiated by the tasks workers should perform during work.
Using data on 12 countries which are available both in the Programme for the International Assessment of Adult Competencies survey and International Social Survey Program, we show that women use their cognitive skills less than men even within the same occupation. The gap in skill intensity cannot be explained by differences in worker characteristics or in cognitive skills. Instead, we show that living in a partnership significantly increases the skill use of men compared with women. We argue that having a partner affects skill use through time allocation as the gender penalty of partnered women is halved once we control for working hours and hours spent on housework. Finally, we do not find evidence of workplace discrimination against women.
JEL codes: J16, J22, J24
Keywords: Gender Gaps, Time Allocation, Human Capital, Skills
Rita Pető
Centre for Economic and Regional Studies, Toth Kalman u. 4. Budapest, 1097 Hungary
e-mail: peto.rita@krtk.hu
Reizer Balázs
Centre for Economic and Regional Studies, Toth Kalman u. 4. Budapest, 1097 Hungary
e-mail: reizer.balazs@krtk.hu
Nemek közötti különbségek a kognitív képességek munkahelyi használatában
RITA PETŐ – BALÁZS REIZER
ÖSSZEFOGLALÓ
Még az azonos foglalkozású nők és férfiak között is számottevő különbség figyelhető meg a tényleges képességhasználatban foglalkozásokon belül. Ez azért meglepő, mert a foglalkozásokat egy részletes feladatlistával definiálják, ami megmondja, hogy az adott foglalkozásban a munkavállalónak milyen feladatokat kellene ellátnia. A tanulmányban 12 olyan ország adatait használtuk, melyek mindegyike szerepel mind a OECD felnőttek képesség- és kompetenciamérése programjában (PIAAC), mind Nemzetközi Szociális Felmérési Programban (ISSP). Megmutatjuk, hogy a nők még ugyanazon foglalkozáson belül is kevesebbet használják kognitív képességeiket, mint a férfiak. A képességhasználatban lévő különbség nem magyarázható a munkavállalói jellemzők vagy a kognitív képességek különbségeivel. Ehelyett azt találjuk, hogy a párkapcsolatban élés jelentősen növeli a férfiak képesség használatát a nőkhöz képest. A partner megléte a képességhasználatot az időbeosztáson keresztül befolyásolja. A párkapcsolatban élő nők és férfiak közötti különbség a felére csökken, ha kontrollálunk a munkára és a házimunkára fordított órák számára. A tanulmányban nem találunk bizonyítékokat a nők munkahelyi diszkriminációjára.
JEL: J16, J22, J24
Kulcsszavak: nemek közötti eltérések, human tőke, képességhasználat
Rita Pet˝ o · Bal´ azs Reizer
Abstract There is significant heterogeneity in actual skill use within occupa- tions even though occupations are differentiated by the tasks workers should perform during work. Using data on 12 countries which are available both in the Programme for the International Assessment of Adult Competencies sur- vey and International Social Survey Program, we show that women use their cognitive skills less than men even within the same occupation. The gap in skill intensity cannot be explained by differences in worker characteristics or in cognitive skills. Instead, we show that living in a partnership significantly increases the skill use of men compared with women. We argue that having a partner affects skill use through time allocation as the gender penalty of partnered women is halved once we control for working hours and hours spent on housework. Finally, we do not find evidence of workplace discrimination against women.
1 Introduction
The gender gap in labor market outcomes has been decreasing rapidly since World War II [49]. This positive trend is the result of the decreasing gender segregation across occupations and workplaces. More specifically, the relative position of women in education has increased and, as a consequence, women are now less likely to be segregated into occupations with low wages and low
R. Pet˝o
1097 4th T´oth K´alm´an Street Budapest, Hungary Tel.: +36-1-3092651
Fax.: +36-1-3092651
E-mail: peto.rita@krtk.mta.hu B. Reizer
1097 4th T´oth K´alm´an Street Budapest, Hungary Tel.: +36-1-3092651
Fax.: +36-1-3092651
E-mail: reizer.balazs@krtk.mta.hu
skill requirements [51, 15]. Even so, the pay gap has remained considerably large between women and men with very similar labor market characteristics:
[19] show that the current gender wage differences are much larger within occupations than between occupations.
A strand of recent literature [55, 8, 56] uses self-reported skill use measures to investigate the wage differences within occupations. Using the Programme for the International Assessment of Adult Competencies (PIAAC) survey, [18]
showed that women tend to carry out less skill-intensive tasks and consequently earn less than men even within the same “official” occupational category. [14]
found that half of the gender wage convergence between 1980 and 2000 can be attributed to the convergence in executed tasks. Similarly, the convergence in skill use within occupations has halved the part-time wage penalty of women [25]. The differences in skill use have important life cycle effects as well. [57]
showed that the gender gap increases in early career because women accu- mulate less experience in using cognitive skills than men. The large within- occupation difference in skill use is surprising as occupations are characterized by a detailed list of tasks and duties as to what individuals should do at their workplace [35].
This paper is the first to investigate directly the possible mechanisms that lead to lower cognitive skill use by women at the workplace. Our most im- portant result is that neither job characteristics nor differences in cognitive test scores can explain the within-occupation gender gap in cognitive skill use. Likewise, a wide set of worker characteristics cannot explain the gender gap. We show that women living in a partnership use their cognitive skills less than men who live with a partner. We argue that the unequal division of housework is an important confounder of the results. The gender penalty of partnered women is halved once we control for working hours and hours spent on housework. Finally, we do not find evidence for workplace discrimination in task allocation and show that differences in preferences cannot explain the gender gap in skill use at work either
As a first step, we document that the tasks performed by women are sig- nificantly less skill-intensive on average than those performed by men with the same abilities and in the same occupation. We use the first wave of the PIAAC survey.
1This data set is unique in the sense that it contains numeracy and literacy test scores measuring the ability to use cognitive skills as well as detailed information about the actual activities of workers at the workplace (e.g. how often they use a text editor, read directions or instructions, fill in forms, etc.). The survey summarizes these activities into standardized indices measuring cognitive and non-cognitive skill use at work. The raw gender gap is around 0.3 standard deviation in numeracy, literacy skill use and in using information and communication technology skills (ICT skills). The composi- tion effect, including schooling, 3-digit occupational categories and a wide set of job characteristics can explain less than half of the unconditional gender
1 The PIAAC includes 24 countries but we only use 12 countries for which we can match time use data. The results are similar if we include the other countries in the sample.
gap in skill use at work. Furthermore, the gender gap in skill use is apparent at every educational level and in every observed country. These differences are significant in economic terms as they correspond to approximately 4 years of schooling. The novelty of our research is that we control for the cognitive test scores of individuals to show that the gender differences in skill use cannot be explained by differences in the ability to use these skills.
2In the second part of the paper, we show that having a partner increases skill use among men compared to women with a partner. As a consequence, the gender gap in skill use is much smaller among single workers. We match the time use survey of the International Social Survey Program to the PIAAC data based on demographic characteristics to investigate how hours spent on work at the workplace and housework
3contribute to the skill use effect of be- ing in a relationship. We argue that time allocation is an important mechanism through which having a partner affects skill use at work, as the gender penalty of partnered women is halved and becomes insignificant in most of the spec- ifications once we control for working hours and hours spent on housework.
Furthermore, we do not find evidence that partnered women use skill less at the workplace because they prefer to use skill less, and we do not find a sig- nificant child penalty in skill use at work conditional on hours spent on work at the workplace and at home either.
In the final part of the paper, we discuss the possible mechanisms that may lead to the unequal division of housework. These mechanisms may be lower bargaining power of women, specialization within the household or social expectations toward the housework of women.
Beyond the literature cited above, our paper also relates to the measure- ment of workplace tasks. As individual-level skill use measures are rare, the largest strand of literature uses official task descriptions of occupations to measure the activities performed at the workplace. These papers documented decreasing returns to routine tasks and increasing returns to non-routine cog- nitive tasks [28, 1, 7]. However, without self-reported skill use measures, re- searchers cannot make inferences on within-occupation differences in skill use.
Researchers therefore implicitly assume that differences in skill use within an occupation are random. We add to the previous literature by using self- reported skill use measures to show that women systematically use their cog- nitive skills less than men wit the same occupation and cognitive test scores.
The paper also relates to the effect of non-cognitive skills on labor market outcomes. [59, 24, 23] show that the demand for non-cognitive skills has been increasing over time. Furthermore, [20] argue that the increasing demand for social skills has positively affected the college premium among women. We add to this literature by showing that women report lower social skill use than men in the same occupation. Still, conditional on total individual skill use, women use non-cognitive skills relatively more intensively.
2 [39] show that skill use at the workplace increases cognitive test scores. That is why cognitive test scores over-control for the gender gap in skill use at work.
3 We observe actual working hours in the PIAAC survey and we only match housework hours.
The paper also contributes to the literature on gender-based discrimination [60, 27, 45]. We do not find evidence that less skill-intensive tasks are allocated to women because employers underestimate their cognitive skills [2]. Recent literature shows that women who are more likely to become pregnant based on their observable characteristics earn less [62, 12, 38]. However, we find that age and education-specific birthrates have only a minor effect on skill use at work.
2 Data and descriptive statistics
We use the Programme for the International Assessment of Adult Competen- cies (PIAAC) survey for our analysis. The survey is unique in the sense that it collects information on skill use at the workplace and skill use in leisure time and it contains literacy and numeracy tests to measure skill endowments.
The survey provides a wide set of categorical questions indicating how often respondents do certain activities or use certain tools at their workplace.
For each question, workers have to choose one of five categories ranging from
“never” to “every day”. The OECD summarizes these questions in 9 skill use indices using the generalized partial credit model (GPCM). The GPCM is developed for situations where respondents have to choose from ordered categories. More specifically, the OECD fitted the following model:
P r (Y
ij= 1|a
i, b
i, θ
j) = exp {a
i(θ
j− b
i)}
1 + exp({a
i(θ
j− b
i)} (1) where Y
ijis 1 if the respondent j chose item i. θ
jis the skill use index for the respondent, while a
iand b
iare question-specific parameters. The OECD used the PARSCALE software to estimate equation 1 jointly for every question with weighted likelihood estimation. The strengths of the GPCM methodology are discussed by the [48] in detail. Most importantly, the skill use index θ
jcan be computed even if the respondent does not answer all of the questions regarding the skill use at work.
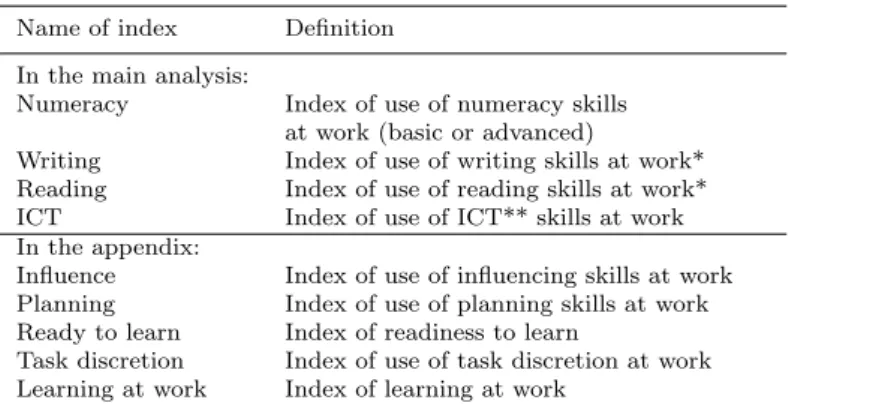
4In this analysis, we focus on the summary indices of basic cognitive skills (numeracy skill use at work, literacy skill use at work and ICT skill use at work) and examine whether there are any gender differences along these measures.
Table 1 summarizes the short definitions of the 9 indices. Appendix Table A-1 lists the specific questions which make up the skill use measures. For example, the numeracy skill use measure is constructed from 6 specific questions. Using the GPCM method, the numeracy skill use index can be computed for any respondent who answers at least one of the six questions. We will refer to the indices in the first panel of Table 1 as measures of the skill intensity of a given job.
The second group of questions we use in the paper is the measures of skill use in leisure time. These measures are constructed by the exact same
4 For technical details of the estimation and for the reliability of indices, see Section 20.5 in [47].
Table 1 Definition of the main index variables Name of index Definition
In the main analysis:
Numeracy Index of use of numeracy skills at work (basic or advanced)
Writing Index of use of writing skills at work*
Reading Index of use of reading skills at work*
ICT Index of use of ICT** skills at work In the appendix:
Influence Index of use of influencing skills at work Planning Index of use of planning skills at work Ready to learn Index of readiness to learn
Task discretion Index of use of task discretion at work Learning at work Index of learning at work
*The index of literacy at work combines the indices for reading skills at work and writing skills at work into one measurement using the methodology developed by [4].
**information and communication technologies
methodology as the skill use at the workplace. A separate set of questions asked the respondents how often they do specific activities in their leisure time. The answers have the same categories, and the same GPCM model summarize them into indices as in the case of skill use at the workplace. Therefore, the indices on skill use at the workplace and on skill use in leisure time are comparable and have the same scale.
The third group of measures we use is the literacy and numeracy test scores.
We use these test scores as the proxy of the cognitive skill endowment of the respondents.
5According to the [46] definition, the tests related to literacy are developed in a way so as to measure “understanding, evaluating, using and engaging with written texts to participate in society, to achieve one’s goals and to develop one’s knowledge and potential” ([46], p. 20). Similarly, the numeracy skill tests are aimed at measuring “the ability to access, use, interpret, and communicate mathematical information and ideas, to engage in and manage mathematical demands of a range of situations in adult life” ([46], p. 33). Hereafter, we use these tests as proxies for cognitive skills. The survey also provides information on the respondents’ labor market status, education, social background, occupation (3-digit ISCO codes), etc.
The study was conducted in 2011-2012 by interviewing about 5000 individ- uals (aged 16-65) in each of the participating countries. In our analysis, we are focusing on 12 countries where we can link the PIAAC data to the time use information.
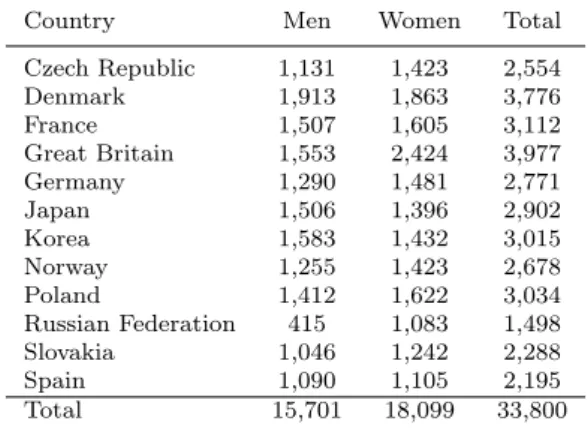
6Altogether, we observe a sample of 33,800 working individuals for whom at least one of the cognitive skill use indices is available (see Table 2), 53,5% of which are women. We use the sampling weights provided by the OECD throughout the analysis.
5 The survey provides ICT skill measures only for a small subsample and does not measure non-cognitive skills. Thus we cannot include these measures into the analysis.
6 In Section 3, we also investigate the gender gap by country.
Table 2 Sample size by country and gender
Country Men Women Total
Czech Republic 1,131 1,423 2,554
Denmark 1,913 1,863 3,776
France 1,507 1,605 3,112
Great Britain 1,553 2,424 3,977
Germany 1,290 1,481 2,771
Japan 1,506 1,396 2,902
Korea 1,583 1,432 3,015
Norway 1,255 1,423 2,678
Poland 1,412 1,622 3,034
Russian Federation 415 1,083 1,498
Slovakia 1,046 1,242 2,288
Spain 1,090 1,105 2,195
Total 15,701 18,099 33,800
Table 3 provides basic descriptive statistics for males and females. To facil- itate comparison, we also provide the estimated differences across gender and the t-statistics. We use the sampling weights provided by the data set and we use the full sample.
7Male workers are somewhat more experienced and they are more likely to have full-time jobs. As a consequence, men work 7,41 hours more on average than women. Women are less likely to work at private firms, while men and women are equally likely to have children. Women perform worse on the cognitive tests (numeracy and literacy tests) and they use their cognitive skills less at work as well.
To better understand the selection into employment, the same descriptive statistics (where it was relevant) are calculated for unemployed people (see Appendix Table A-2). In line with our intuition, unemployed people are less experienced and are less educated than the employed. Unemployed women per- form worse on cognitive tests related to numeracy skills, while they outperform unemployed men on literacy tests.
The information on housework and family care comes from the fourth wave of the International Social Survey Programme: Family and Changing Gender Roles (ISSP). The survey was conducted in 2012 and aims at measuring atti- tudes towards marriage, child bearing and activities pursued in leisure time and at the workplace (ISSP, [36]). The database contains self-reported information on the hours spent on housework and family care separately.
8As a first step, we calculate average housework and family care by country of origin, gender, marital status, 1-digit occupational category, educational level and a children dummy. We choose these dimensions to maximize the relevant categories and the share of respondents to whom we can match housework information at the
7 The results are virtually the same for the sub-sample where all measures of the skill intensity of the job are available.
8 The ISSP survey asks “On average, how many hours a week do you personally spend on household work, not including childcare and leisure time activities?” and “On average, how many hours a week do you spend looking after family members (e.g. children, elderly, ill or disabled family members)?”
Table 3 Descriptive statistics for the main variables
Variable Male Female Difference t-stat
Experience (year) 19.43 17.07 -2.36 -11.20
(0.16) (0.14)
Years of education 13.99 13.76 -0.23 -4.13
(0.04) (0.04)
Share of full time workers 0.88 0.67 -0.21 -29.75
(0.00) (0.01)
Weekly work hours 43.45 36.04 -7.41 -31.98
(0.17) (0.15)
Share of those who have children under age 18 0.14 0.13 -0.01 -0.93 (0.01) (0.00)
Native 0.87 0.87 0.00 0.24
(0.00) (0.00)
Employed in private sector 0.79 0.68 -0.11 -13.24
(0.01) (0.01)
Average numeracy test score* 0.15 -0.15 -0.30 -13.91
(0.01) (0.02)
Average literacy test score* 0.06 -0.06 -0.12 -6.09
(0.01) (0.02)
Numeracy skill use at work** 0.15 -0.15 -0.29 -15.34
(0.01) (0.01)
Literacy skill use at work** 0.15 -0.15 -0.30 -15.49
(0.01) (0.01)
ICT skill use at work** 0.13 -0.14 -0.28 -13.84
(0.01) (0,01)
Observations 15,701 18,099
* Standardized test score with a mean of 0 and a variance of 1
**Standardized skill use indices with a mean of 0 and a variance of 1
same time. Next, we use exact matching based on these demographic charac- teristics to match the segment-level average hours spent on housework from the ISSP with the individual observations in the PIAAC data.
9These cate- gorical variables define 1476 distinct segments, which we observe both in the ISSP and the PIAAC. These segments consist of 33,800 respondents, who are shown in Table 2. There are 454 segments and 2668 respondents in the PIAAC survey to whom we cannot match housework information.
Using segment-level averages as a proxy for individual housework has two important features. First, these measures of household activities are not cor- related with unobserved individual characteristics, which are correlated both with individual hours spent on housework and skill use at work. Therefore, the results can be interpreted as the estimate of the reduced form of an in- strumental variables model where the instrument of individual housework is the leave-out-mean of the group [58].
9 The segments represents 9425 individuals in the ISSP, which means that the segments contain 6.4 individuals on average. The between-group variation of housework hours covers more than 60 percent of the total variance in household hours (the total standard deviation of housework is 10.5 hours, while the between-segment variation is 6.6 hours). The information loss is less in the case of family care, where the total standard deviation is 12.6, while the between-group variation is 10 hours.
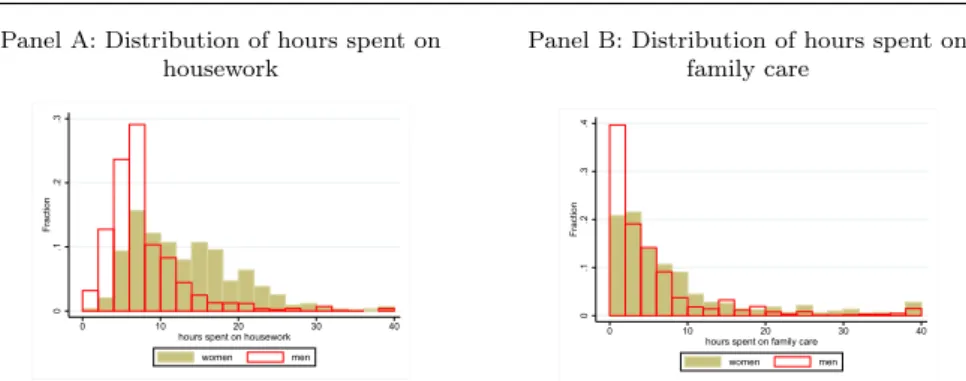
Panel A: Distribution of hours spent on housework
0.1.2.3Fraction
0 10 20 30 40
hours spent on housework
women men
Panel B: Distribution of hours spent on family care
0.1.2.3.4Fraction
0 10 20 30 40
hours spent on family care
women men
Fig. 1 Distribution of weekly housework and family care by gender (hours)
Note: The number of hours spent on housework and family care is winsorized at 40 hours.
Second, the group-level average measures individual hours spent on house- work and family care with a random measurement error which biases the parameters of these variables toward zero (attenuation bias). To better under- stand the problem, let x
idenote the housework done by worker i in segment s. Without loss of generality, we can assume that x
i= x
s+
iwhere x
sis the expected value of housework in the segment and
iis a zero mean ran- dom term. Instead of observing x
iwe only observe the average housework of individuals in segment s in the ISSP survey ( ¯ x
i). In this setup, there are two types of measurement error. First, we do not observe
i. Second, the group average ¯ x
iis only a noisy measure of x
s. The attenuation bias caused by the measurement error is decreasing in the variance of ¯ x
i[61]. By the law of large numbers, this variance is larger if the size of the segment is smaller in the ISSP. On the one hand, the estimation is possible even if we observe only one individual in each segment in the ISSP survey. On the other hand, despite the attenuation bias, our estimated parameters are significant (Section 3.1, Table 7). Besides, the attenuation bias also implies that we underestimate the effect of housework on skill use at work and overestimate the conditional gender gap in absolute terms [16]. The same argument applies for using group-level averages as a proxy for individual hours spent on family care. As a result, our estimates give an upper bound in absolute terms for the gender gap in skill use at work.
Figure 1 Panel A shows the distribution of weekly housework in the com- bined database. According to the figure, the hours spent on housework vary significantly across individuals and we also find important gender differences in this regard. On average, women devote 7.2 more hours to housework than men and they are significantly less likely to report fewer than 10 hours. Com- pared to housework hours, we can observe a much smaller gender difference in the hours spent on family care. Although men are more likely to report very low hours spent on family care, on average, women spend only 3.2 hours more on family care than men.
We can also test the reliability of the results by comparing the self-reported
and spouse-reported hours spent on housework. The ISSP survey includes only
one member of the household and the respondent has to gauge the amount of her own and her spouse’s housework. If people systematically overestimate their own housework, then we expect that self-reported housework hours is higher than spouse-reported housework hours.
10In contrast, Appendix Figure A-1 highlights that the distribution of housework remarkably overlaps for both men and women. That is why we conclude that the number of self-reported hours spent on housework is indeed an unbiased measure of the activities at home.
Table 4 summarizes the hours spent on housework by gender and partner- ship status. The most apparent difference is that women spend more time on housework than men, independently of their partnership status. Not surpris- ingly, single men without children spend the least amount of time on housework (6.77 hours a week), 2.14 hours less than single women without children. Fur- thermore, the table shows ample evidence of the unequal division of housework between the partners. Women without children living in a partnership spend 3.25 hours more on housework weekly than single women without children, while men living in a partnership spend only 0.56 hours more on housework than their single counterparts. We see a striking difference among women with children. If partnered women have children, they spend 5.06 hours more on housework than partnered women without children. Altogether, women living with a partner spend almost twice as many hours on housework than men.
As opposed to this, we do not find such a large gender difference in hours spent on family care.
11Living with a partner increases the hours spent on family care for men and women alike. Similarly, people having children spend more on family care than people without children.
Finally, if housework hours depended only on the division of housework within households, single men and single women with children would allocate a similar number of hours to housework. To the contrary, we find that single women with children spend 15.21 hours per week on housework, while single men with children spend only 7.30 hours on housework. This difference cannot be explained by the unequal division of housework, other mechanisms may also play a role.
Finally, we plot the average hours spent on family care as the function of hours spent on housework. By doing so, we test whether people responsible for an especially large amount of housework can devolve family care to other adults in the family/household. Appendix Figure A-2 groups the people into 20 equally sized bins by the amount of reported housework and plots the average hours spent on family care for men and women. The figure highlights that women spend more time on family care at every level of housework and people who report larger amounts of housework also spend more time on family care.
Based on these facts, we conclude that there is no trade-off between doing more housework and spending more time on family care.
10 This may be especially problematic among women, who may over-report their housework because of social expectations.
11 Note: The ISSP survey does not specify whether family care is related to children, old parents or other family members.
Table 4 Hours spent on housework by gender
Single With partner
No Children Children No Children Children Panel A: Men
Hours spent on housework 6.77 7.30 7.33 7.55
(4.66) (4.43) (4.76) (5.93)
Hours spent on family care 3.09 4.80 4.11 6.59
(4.50) (8.17) (6.20) (8.52)
Observations 4653 1797 1023 9349
Panel B: Women
Hours spent on housework 8.91 15.21 12.16 17.22
(5.62) (6.71) (6.89) (7.11)
Hours spent on family care 3.84 6.42 7.46 10.94
(4.06) (5.60) (9.31) (10.06)
Observations 4407 212 2922 10482
3 Results
This section shows that women use their cognitive skills at the workplace less often than men but the heterogeneity in individual and job character- istics cannot, in itself, explain this gender gap. To prove this claim, we run Mincerian-type regressions where the left hand side variable is one of the in- dices measuring the skill intensity of the job (see Table 1). We pool all coun- tries in our sample together. Our main right hand side variable is gender, while controlling for different sets of variables:
y
i= α + β ∗ f emale
i+ X
iγ + u
i, (2) where y
idenotes the examined skill intensity measure (standardized to have a mean of zero and a standard deviation of one). The main coefficient of interest is β showing the gender gap in skill use at the workplace. X
iis the set of control variables including the numeracy and literacy test scores of the respondents.
The test scores enable us to show that women do not use their cognitive skills less because of their lack of skills.
12Besides controlling for individual skills, we also mimic a Mincerian-type wage equation by controlling for years of education, experience, experience-square, occupation (3-digit ISCO codes), etc.
13As occupations are defined by a detailed list of tasks and duties that
12 If cognitive and non-cognitive skills are correlated and we do not control for non- cognitive skill endowment, then the parameters of the test scores are biased. The PIAAC data do not measure non-cognitive skill endowment and that is why we proxy it with trust in other individuals The correlation between our cognitive and non-cognitive skill measures are positive but low (the correlation between trust and literacy test scores is 0.1254, while it is 0.1443 for trust and numeracy test scores). Still, if men and women have the same average cognitive and non-cognitive skill endowments conditional on test scores and trust, then Equation 2 gives an unbiased estimate of the gender gap in skill use at work [31].
13 The remaining control variables are parents’ highest level of education, trust in other people, dummy for those managing others, self-employment dummy, dummy for those having a permanent contract, having a partner, dummies for 1-digit industry, 5 firm size categories and private sector control.
employees have to fulfill at their workplace, the occupation categories alone should explain the individual heterogeneity in skill use at work. By including occupational categories and cognitive test scores in the control variables, we do not only control for the tasks that employees should carry out at work but also for the individual’s ability to use cognitive skills. Finally, workers’ tasks may differ county by country even if they have the same occupational category.
That is why we use country-occupation fixed effects instead of occupational fixed effects to account for these differences.
As an additional robustness check, we use propensity score matching to ensure that only observationally similar men and women are used for the esti- mation. We follow the strategy of [29]. First, we estimate the propensity scores by using a logit model, we include in the model the age, years of education, lit- eracy and numeracy test scores. Second, with the estimated propensity scores in hand, we use the nearest-neighbor matching by country. Which means that we matched without replacement every woman with the man of the same country with the closest propensity score. This procedure ensures that gender difference in skill use at work is estimated on common support at the cost of losing 22 percent of the sample. As the choice of the confounders is arbitrary, we made sensitivity test by using different set of control variables. The esti- mates are very similar to the results in the main text (see Appendix Table A-3)
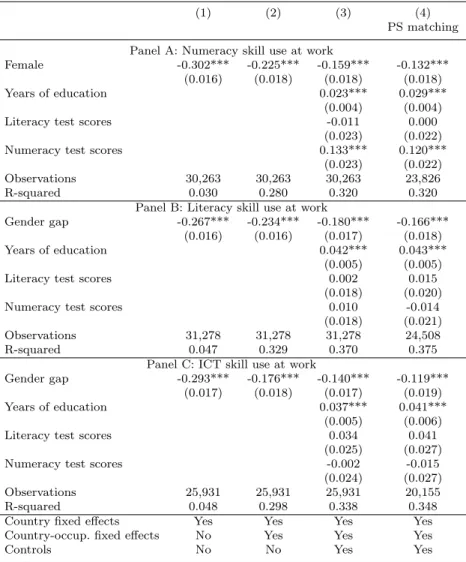
The point estimates for equation 2 are shown in Table 5. The three skill use indices are shown in separate panels while the columns differ in control variables. According to Column (1), women use their cognitive skills with an approximately 0.3 standard deviation less than men. The raw differences are somewhat larger in numeracy skill use (coef. 0.302, s.e. 0.016) and lower in literacy and ICT skill use.
We add country-occupation fixed effects in Column (2) to show that women use their cognitive skills less than men of the same occupations. Panel A in Column (2) shows that women use their numeracy skills with 0.225 standard deviation less than men working in the same country and occupation. The within-occupation difference is somewhat larger in literacy skill use (0.234 standard deviation) and lower in the ICT skill use (0.176 standard deviation).
The results imply that two-thirds of the raw gender gap is within occupation.
This is a surprising result as occupations are defined by the list of tasks which the worker should carry out at their workplace.
Column (3) incorporates the full set of individual and job characteristics including literacy and numeracy test scores. The other control variables are ed- ucation, experience, square of experience, dummies for 1-digit industry codes, 5 firm size categories and a wide set of information on family background.
According to the results, these variables cannot explain the gender gap in skill
use either since half of the raw gender gap remains unexplained. Investigating
the coefficient of education reveals that the gender gap in skill use has a large
magnitude. Workers with one more year of education use their cognitive skills
with 0.02-0.04 standard deviation (s.e. 0.005) more. These results indicate that
conditional on occupation, one year of additional schooling corresponds to a
much smaller increase in cognitive skill use than the gender gap.
14Finally, Column (4) uses propensity score matching to ensure that we compare similar men and women. Even though the sample size drops, the point estimates do not change significantly compared to Column (3).
15Robustness checks In Table 5, we implicitly assumed that skill use indices are uncorrelated with each other. We test the robustness of this assumption in Appendix Table A-4. More precisely, we estimate the gender gap in skill for the three skill use indices together using seemingly unrelated regression (SUR). The strength of the SUR model is that it enables correlation between the skill use indices but we can use only those respondents for the estimation who have all three skill use indices. In Panel A, we control for country fixed effects, while in Panel B, we use all of the control variables (as in Table 5, Column (3)). Reassuringly, both the point estimates and the standard errors are similar to the results in Table 5.
As an alternative method to deal with the correlation between skill use indices, we use the method of [44]. This method summarizes the differences in the three skill use indices into one measure with the appropriate standard errors. Again, the results are shown to be similar to previous results (Column (4)).
The GPCM method used for the computation of skill use indices has strict functional form assumptions. To investigate the robustness of these assump- tions, Appendix Table A-5-A-7 estimate the gender gap in skill use by specific activities. As the possible answers have an ordered scale, we use ordered logit regression for the analysis. For the sake of simplicity, we only show the results on the coefficient of the gender dummy. Each row represents a question in the survey and we also labeled them with the corresponding skill use index. The columns differ in control variables, and their structure mimics the structure of Table 5. As expected based on the skill use indices, women do most of the activities less often than men. Nevertheless, women use calculators more of- ten than men and there are some activities where there is no gender gap, e.g.
writing memos or emails, or using a word processor.
Heterogeneity of the gender gap by groups We also investigate whether the gender gap in skill use differs by groups. First, we estimate the skill use by country. Appendix Table A-8 shows that there is significant heterogeneity across countries. We observe the largest gender gap in skill use in Japan, where gender inequality is traditionally large. Surprisingly, the gender gap in skill use is also very large in Scandinavian countries (Denmark and Norway),
14 This specification over-controls for the effect of education as many occupations with high cognitive skill use have explicit educational requirements (e.g. teachers, doctors) and education raises cognitive test scores as well.
15 Even though the regression in Table 5 does not make use of the housework information, we only included the sub-sample of respondents in the PIAAC survey to whom we could match housework information. The results do not change if we include those individuals to whom we can not match housework information. The results are available upon request.
Table 5 Gender gap in skill use at work
(1) (2) (3) (4)
PS matching Panel A: Numeracy skill use at work
Female -0.302*** -0.225*** -0.159*** -0.132***
(0.016) (0.018) (0.018) (0.018)
Years of education 0.023*** 0.029***
(0.004) (0.004)
Literacy test scores -0.011 0.000
(0.023) (0.022)
Numeracy test scores 0.133*** 0.120***
(0.023) (0.022)
Observations 30,263 30,263 30,263 23,826
R-squared 0.030 0.280 0.320 0.320
Panel B: Literacy skill use at work
Gender gap -0.267*** -0.234*** -0.180*** -0.166***
(0.016) (0.016) (0.017) (0.018)
Years of education 0.042*** 0.043***
(0.005) (0.005)
Literacy test scores 0.002 0.015
(0.018) (0.020)
Numeracy test scores 0.010 -0.014
(0.018) (0.021)
Observations 31,278 31,278 31,278 24,508
R-squared 0.047 0.329 0.370 0.375
Panel C: ICT skill use at work
Gender gap -0.293*** -0.176*** -0.140*** -0.119***
(0.017) (0.018) (0.017) (0.019)
Years of education 0.037*** 0.041***
(0.005) (0.006)
Literacy test scores 0.034 0.041
(0.025) (0.027)
Numeracy test scores -0.002 -0.015
(0.024) (0.027)
Observations 25,931 25,931 25,931 20,155
R-squared 0.048 0.298 0.338 0.348
Country fixed effects Yes Yes Yes Yes
Country-occup. fixed effects No Yes Yes Yes
Controls No No Yes Yes
Notes: Standard errors are in parentheses ***p <0.01, **p <0.05, *p <0.1. Control variables differ by column. Column (1) controls for country fixed effects, Column (2) controls for country-occupation fixed effects. Column (3) also controls for years of education and standardized literacy and numeracy test scores, partner dummy, experience, experienceˆ2, parents’ highest level of education, self-employment dummy, dummy for having a permanent contract, dummies for 1-digit industry, 5 firm size categories, private sector, dummy for those managing others and trust in others. Column (4) shows the results estimated on the matched sample that uses propensity score matching (see the text for the details). Standard errors are calculated with the jackknife method (suggested by [47]) using 80 replication weights. All of the results are calculated by using sampling weights provided by the survey.
which are considered some of the most gender-equal societies. In contrast, we find the smallest gender gap in skill use at work in the post-communist countries (Poland, Russia, Slovakia). These countries have the lowest gender gap in numeracy and literacy skill use but an above-average gender gap in ICT skill use.
Appendix Figure A-3 plots the gender gap in skill use by educational cat- egories. This exercise is motivated by previous research showing large hetero- geneity in gender wage gap by educational level [22]. We find a significant gender gap in every educational category. Women with secondary education experience the largest penalty in numeracy and literacy skill use compared to men of the same educational level. This difference remains significant even if we control for occupation, cognitive test scores, working hours and other con- trol variables. Furthermore, women with professional degrees suffer the largest penalty in ICT skill use, but the gap decreases once we control for worker composition.
We do not find large heterogeneity across broad occupational categories either. Appendix Figure A-4 shows that the gender gap is of a similar magni- tude in all broad occupational categories.
16The only notable exceptions are service jobs where the gender gap is larger than average in all of the skill use measures.
Finally, we investigate the gender gap in skill use by firm size. Appendix Figure A-5 shows that the unconditional gender gap in skill use is apparent at every firm size but is somewhat smaller at the largest firms. This negative relationship is robust to introducing controls for individual characteristics (e.g.
occupation and cognitive skills, working hours) and it is the most apparent in ICT skills.
Gender differences in cognitive skills and the skill requirement of jobs It is possible that women use their cognitive skills less than men because women have relatively lower cognitive test scores in occupations with high cognitive skill requirements (thus a large gender gap in actual skill use). Furthermore, if women may have better cognitive test scores than men in occupations with very low skill requirements (thus with a small gender gap in actual skill use), then the cognitive test scores and the gender gap in skill use would be uncor- related in the whole sample (as found in the data) but negatively correlated across occupations. To rule out this scenario, Appendix Figure A-6 plots the average skill use at work by the gender gap in skill use. Every dot displays a specific 3-digit ISCO code. The horizontal axis shows the average gender gap in cognitive test scores in a given occupation (a positive number means that women in that occupation have better skills than men on average). The vertical axis represents the average skill use in the given occupation.
17The figure highlights that women have higher cognitive test scores than men in occupations with high literacy skill use, but the gender gap in cognitive test
16 The categories are based on 1-digit ISCO codes.
17 For the sake of simplicity, we pool the skill use of men and women together.
scores is uncorrelated with numeracy and ICT skill use. Based on these facts, we conclude that the gender gap in skill use cannot be explained by the lack of cognitive skills in highly skill-intensive occupations.
Non-cognitve skill use at work Women on average have better non-cognitive skills than men [37]; that is why women may specialize in tasks which need higher non-cognitive skill use and lower cognitive skill use than the tasks ful- filled by men. If this was the main reason for the gender gap in cognitive skill use, we would expect that women report higher non-cognitive skill use than men.
To test this hypothesis, we estimate the gender difference in non-cognitive skill use. The PIAAC survey has four indices measuring non-cognitive skill use, including the planning and influencing skill use at the workplace. We re- estimate Equation 2 using these variables in Table A-9. Column (1) in Panel B shows that women use influencing skills with 0.246 standard deviation less than men. Furthermore, the gap does not disappear once we control for a wide set of other control variables (Column (2)-(3)) or if we compare only observationally similar males and females (Column (4)). Finally, Panel A, Panel C and Panel D show that women also use their planning and learning skills less often and also have lower task discretion. The results remain qualitatively the same if we use seemingly unrelated regressions and the observations only where all of the non-cognitive skill use indices are available (Table A-10). As women use non-cognitive skills less often than men, we conclude that specialization in non-cognitive skill use cannot explain the lower gender gap in cognitive skill use.
Finally, if women use their cognitive skills less only because they specialize in non-cognitive skill use, then we expect a larger gender gap in cognitive skill use in occupations with the highest non-cognitive skill requirements. That is why we estimate the relationship between the non-cognitive skill requirements of occupations and the within-occupation gender gap in cognitive skill use. We use the importance of cooperation in the given occupation as a proxy for the non-cognitive skill requirements of that occupation.
18Appendix Figure A-7 orders the 3-digit occupations by the importance of cooperation and plots the gender gap in cognitive skill use in every occupation. The figure highlights that there is no significant relationship between the cooperation skill requirements of the occupation and the gender gap in cognitive skill use. This result also suggests that women do not report lower cognitive skill use than men because they over-estimate the importance of non-cognitive skill use.
Even though women report lower non-cognitive skill use than men, women may use non-cognitive skills more intensively conditional on total (gender- specific) skill use at work. We can test this possibility by comparing Table A-4 Column (4) and Table A-10 Column (5). These two columns measure the gender gap in cognitive and non-cognitve skill use with the same method
18 We use the standardized importance of cooperation measure of [50] and the crosswalk of [30] to link the O*NET occupational categories to the 3-digit ISCO-08 codes.
[44] and on the same scale (standardized to have mean of zero and standard deviation of one). According to the results, the conditional gender gap is 0.175 standard deviation in cognitive skill use and 0.077 standard deviation in non- cognitive skill use. These results mean that women indeed use non-cognitive skills relatively more intensively conditional on total skill use.
3.1 The effect of partnership and time allocation on the gender gap in skill use
In the previous section, we showed that the gender gap in skill use cannot be explained by education, occupation, or by differences in literacy and nu- meracy test scores. In this section, we investigate how partnership and gender differences in working hours, hours spent on housework and family care con- tribute to the gender gap in skill use. This exercise is motivated by previous studies showing that household activities [33, 21] and working hours [26] are key drivers of the gender pay gap.
Table 6 shows the effect of living with a partner on the gender gap in skill use at work conditional on having a partner. Here, the female dummy shows the gender gap in skill use among single households. The ”has a partner dummy” shows the skill use gap between men with and without a partner, while the interaction term shows the difference in the gender gap in skill use between partnered individuals and single individuals.
Column (1) of Panel A highlights that women without a partner use their numeracy skills with 0.170 (s.e. 0.029) standard deviation less than single men.
Thus, the raw gender gap in numeracy skill use is significantly smaller among people without a partner than in the whole sample (Table 5, Column (1)).
Futhermore, we do not find significant gender difference in ICT skill use among single individuals conditional on observable characteristics. The parameter of the partner dummy shows that men having a partner use their cognitive skills with 0.195 (s.e. 0.023) standard deviation more than men without a partner.
The negative parameter of the interaction term means that the raw gender gap among partnered individuals is with 0.189 standard deviation (s.e. 0.031) larger than among single individuals. Finally, women having a partner use their numeracy skills with 0.195-0.189=0.006 standard deviation more than single women. This difference is not significant either in economic or statistical sense.
Turning to literacy and ICT skill use, we see similar patterns but the effect of having a partner on women’s skill use is much larger. According to these results, men having a partner use their cognitive skills more at the workplace than single men, but we do not observe such a difference among women.
The effect of having a partner decreases if we control for gender differences
in occupation (Column (2)), or add a wide set of control variables including test
scores (Column (3)). Still, the results are qualitatively the same, the gender
gap in skill use is much lower among single individuals. What is more, we do
not find a significant difference among single men and women in ICT skill use
if we control for differences in observable characteristics. Similarly, it is only
Table 6 The effect of partnership on the gender gap
(1) (2) (3) (4)
PS matching Panel A: Numeracy skill use at work
Female -0.170*** -0.136*** -0.089*** -0.077**
(0.029) (0.025) (0.026) (0.030)
Has a partner 0.195*** 0.120*** 0.087*** 0.077***
(0.023) (0.021) (0.023) (0.027) Partner*Female -0.189*** -0.123*** -0.096*** -0.076**
(0.031) (0.028) (0.028) (0.032)
Observations 29,938 29,938 29,938 23,604
R-squared 0.035 0.283 0.322 0.322
Panel B: Literacy skill use at work
Female -0.040 -0.122*** -0.102*** -0.101***
(0.032) (0.025) (0.026) (0.031)
Has a partner 0.315*** 0.157*** 0.092*** 0.081**
(0.030) (0.026) (0.031) (0.034) Partner*Female -0.309*** -0.157*** -0.113*** -0.095**
(0.041) (0.035) (0.034) (0.039)
Observations 30,955 30,955 30,955 24,288
R-squared 0.055 0.332 0.374 0.381
Panel C: ICT skill use at work
Female -0.133*** -0.061** -0.039 -0.003
(0.032) (0.029) (0.028) (0.031)
Has a partner 0.223*** 0.148*** 0.160*** 0.152***
(0.033) (0.028) (0.033) (0.037) Partner*Female -0.221*** -0.168*** -0.157*** -0.180***
(0.039) (0.035) (0.034) (0.045)
Observations 25,701 25,701 25,701 20,004
R-squared 0.054 0.304 0.342 0.355
Country fixed effects Yes Yes Yes Yes
Country-occup. fixed effects No Yes Yes Yes
Other for job characteristics No No Yes Yes
Notes: Standard errors are in parentheses ***p <0.01, **p <0.05, *p <0.1. Control variables differ by column. Column (1) controls for country fixed effects, Column (2) controls for country-occupation fixed effects. Column (3) also controls for years of education and standardized literacy and numeracy test scores, partner dummy, experience, experienceˆ2, parents’ highest level of education, self-employment dummy, dummy for having a permanent contract, dummies for 1-digit industry, 5 firm size categories, private sector, dummy for those managing others and trust in others. Column (4) shows the results estimated on the matched sample that uses propensity score matching (see the text for the details). Standard errors are calculated with the jackknife method (suggested by [47]) using 80 replication weights. All of the results are calculated by using sampling weights provided by the survey.
men with partners and not women with partners that use their cognitive skills more than their single counterparts.
The division of housework between partners can be a crucial channel through
which partnerships affect labor market outcomes. That is why we re-estimate
Table 6 conditional on the actual hours worked at the workplace and segment-
level average hours spent on housework and family care.
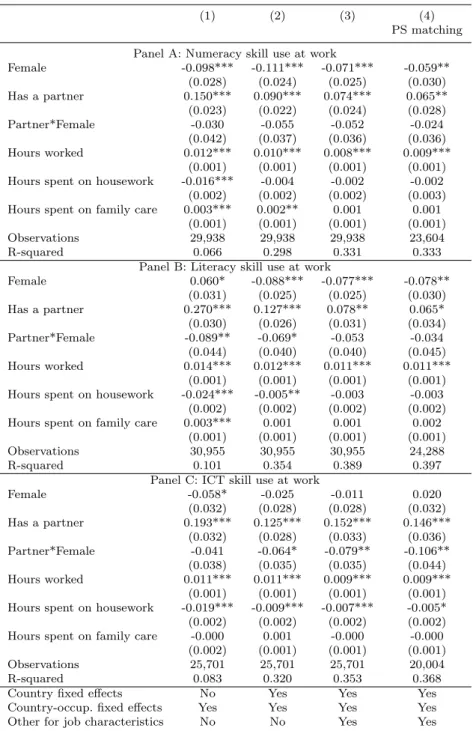
Table 7 The effect of time allocation on the gender gap
(1) (2) (3) (4)
PS matching Panel A: Numeracy skill use at work
Female -0.098*** -0.111*** -0.071*** -0.059**
(0.028) (0.024) (0.025) (0.030)
Has a partner 0.150*** 0.090*** 0.074*** 0.065**
(0.023) (0.022) (0.024) (0.028)
Partner*Female -0.030 -0.055 -0.052 -0.024
(0.042) (0.037) (0.036) (0.036)
Hours worked 0.012*** 0.010*** 0.008*** 0.009***
(0.001) (0.001) (0.001) (0.001) Hours spent on housework -0.016*** -0.004 -0.002 -0.002
(0.002) (0.002) (0.002) (0.003) Hours spent on family care 0.003*** 0.002** 0.001 0.001
(0.001) (0.001) (0.001) (0.001)
Observations 29,938 29,938 29,938 23,604
R-squared 0.066 0.298 0.331 0.333
Panel B: Literacy skill use at work
Female 0.060* -0.088*** -0.077*** -0.078**
(0.031) (0.025) (0.025) (0.030)
Has a partner 0.270*** 0.127*** 0.078** 0.065*
(0.030) (0.026) (0.031) (0.034)
Partner*Female -0.089** -0.069* -0.053 -0.034
(0.044) (0.040) (0.040) (0.045)
Hours worked 0.014*** 0.012*** 0.011*** 0.011***
(0.001) (0.001) (0.001) (0.001) Hours spent on housework -0.024*** -0.005** -0.003 -0.003
(0.002) (0.002) (0.002) (0.002) Hours spent on family care 0.003*** 0.001 0.001 0.002
(0.001) (0.001) (0.001) (0.001)
Observations 30,955 30,955 30,955 24,288
R-squared 0.101 0.354 0.389 0.397
Panel C: ICT skill use at work
Female -0.058* -0.025 -0.011 0.020
(0.032) (0.028) (0.028) (0.032)
Has a partner 0.193*** 0.125*** 0.152*** 0.146***
(0.032) (0.028) (0.033) (0.036)
Partner*Female -0.041 -0.064* -0.079** -0.106**
(0.038) (0.035) (0.035) (0.044)
Hours worked 0.011*** 0.011*** 0.009*** 0.009***
(0.001) (0.001) (0.001) (0.001) Hours spent on housework -0.019*** -0.009*** -0.007*** -0.005*
(0.002) (0.002) (0.002) (0.002) Hours spent on family care -0.000 0.001 -0.000 -0.000
(0.002) (0.001) (0.001) (0.001)
Observations 25,701 25,701 25,701 20,004
R-squared 0.083 0.320 0.353 0.368
Country fixed effects No Yes Yes Yes
Country-occup. fixed effects Yes Yes Yes Yes
Other for job characteristics No No Yes Yes
Notes: Standard errors are in parentheses ***p <0.01, **p <0.05, *p <0.1. Control variables differ by column. Column (1) controls for country fixed effects, Column (2) controls for country-occupation fixed effects. Column (3) also controls for years of education and standardized literacy and numeracy test scores, partner dummy, experience, experienceˆ2, parents’ highest level of education, self-employment dummy, dummy for having a permanent contract, dummies for 1-digit industry, 5 firm size categories, private sector, dummy for those managing others and trust in others. Column (4) shows the results estimated on the matched sample that uses propensity score matching (see the text for the details). Standard errors are calculated with the jackknife method (suggested by [47]) using 80 replication weights. All of the results are calculated by using sampling weights provided by the survey.
Column (1) in Table 7 shows that one additional hour worked at the workplace increases numeracy skill use with 0.012 standard deviation while spending one additional hour housework is associated with a 0.016 standard deviation decrease in numeracy skill use at work. The effect is even larger in case of literacy skill use (-0.024 standard deviation) and ICT skill use (-0.019 standard deviation). The coefficients are somewhat smaller once we control for country-occupation fixed effects (Column (2)), or include a wide set of job characteristics in Column (3). The results are also robust to restricting the sample only to observationally comparable men and women (Column (4)). In contrast, the hours spent on family care have a much lower effect on skill use at the workplace. What is more, the parameters of family care are significantly positive in some specifications.
Turning to the gender gap in skill use, the gender penalty of having a partner decreases compared to Table 6, once we control for time allocation individual. The interaction of female and partnership is not significant in the case of numeracy skill use and literacy skill use and halves in the case of ICT skill use at work (see Column 3). The reason for the drop in the gender penalty compared to Table 6 is that partnered women do much more house- work than partnered men (see Table 4) and there is a negative relationship between housework and skill use at work. The gender gap in skill use among single individuals decreased also somewhat after controlling for time allocation compared to Table 6. Based on these results, we conclude that the unequal division of housework plays a key role in the gender gap in skill use at work among partnered individuals.
Gender differences in preferences It is possible that it is not the partnership status but the individual preferences toward skill use that decrease the skill use at work and increase the housework hours of partnered women. In other words, partnered women may prefer to use skills less than single women. Sim- ilarly, partnered women may do more housework than single women because they dis-prefer housework less. If this was the main mechanism then (i) the skill use penalty of partnered women would disappear once we control for pref- erences (ii) housework would not affect skill use at work conditional on skill use preferences.
As we cannot observe preferences directly, we proxy them with cognitive skill use in leisure time. We assume that individuals prefer to use skills more if they use their cognitive skills more in their leisure time.
19The results are presented in Table A-11. Columns (1) and (2) show that partnered women use cognitive skills less than men even conditional on skill use in leisure time. Furthermore, Column (3) and (4) reveal that the gender gap among partnered women decreases if we include housework hours into the
19 The actual differences in skill use in leisure time over-control for the effect of housework and the gender gap in skill use at work. First, we only observe the segment level average of housework but we observe the actual individual skill use in leisure time [16]. Second, there may be reserve causality if skill use at leisure time and at the workplace are complement
regression. Based on these estimates, we concluded that it is not the differences in skill use preferences that drive our main results.
3.2 Statistical discrimination against women
In this section, we investigate whether statistical discrimination against women can explain their lower skill use. The idea is that the employer has discrim- inative assumptions about certain characteristics of women and that is why they assign less skill-intensive tasks to them. The first discriminative assump- tion we test is that employers assume that women have inferior cognitive skills compared to men. The second type of discrimination we investigate is based on the fertility rate of specific cohorts. This exercise is motivated by recent studies showing that women who have higher fertility rates based on their education, age, and marital status earn less [62, 38] and are less likely to be hired for part-time jobs [12].
Discriminative assumptions about cognitive skills [2] studied this issue and found that employers cannot observe individual skills at the beginning of their workers’ career, but firms can learn over time and get information about in- dividual skills. As a consequence, firms discriminate less and less over time based on easily observable characteristics. It follows from their argument that cognitive skills have an increasing effect on skill use at work as time goes on, while easily observable characteristics (e.g. gender) have a decreasing effect.
We can also formalize the argument and estimate the following regression:
y
i= β
0+β
1∗f emale
i+β
2∗f emale
i∗exp
i+β
3∗skill
i+β
4∗skill
i∗exp
i+γ∗X
i+u
i(3) As in Equation 2, the dependent variable is cognitive skill use at work.
Exp denotes the labor market experience of workers while skill
idenotes the cognitive test scores. If women are discriminated against because they are assumed to have lower skills, then β
4is positive and β
2increases once we add β
4to the regression [2].
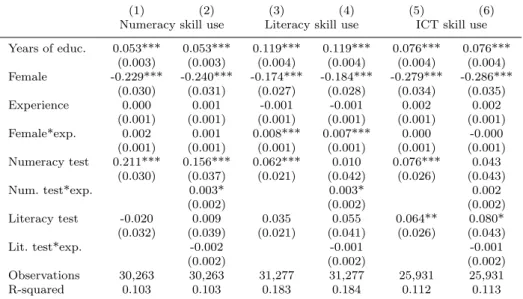
The estimation results are shown in Table 8. Contrary to the predictions of this mechanism, the effect of skills does not increase with experience. The interaction of the test score is never significant at the 5 percent level and the point estimates are very close to zero (ten years of experience would in- crease the effect of the numeracy test score on numeracy skill use at work by 0.03 standard deviation).
20Furthermore, the gender gap in skill use does not decrease faster once we control for the dynamic effects of cognitive skills. We conclude that women are not assigned tasks requiring lower skills because they are assumed to have inferior skills.
20 Another possibility is that firms do not learn about the skills of individuals. However, this conclusion would be in strong contrast with previous literature on employer learning [43, 53, 6, 52].
Table 8 Discriminative assumptions about cognitive skills
(1) (2) (3) (4) (5) (6)
Numeracy skill use Literacy skill use ICT skill use Years of educ. 0.053*** 0.053*** 0.119*** 0.119*** 0.076*** 0.076***
(0.003) (0.003) (0.004) (0.004) (0.004) (0.004) Female -0.229*** -0.240*** -0.174*** -0.184*** -0.279*** -0.286***
(0.030) (0.031) (0.027) (0.028) (0.034) (0.035)
Experience 0.000 0.001 -0.001 -0.001 0.002 0.002
(0.001) (0.001) (0.001) (0.001) (0.001) (0.001)
Female*exp. 0.002 0.001 0.008*** 0.007*** 0.000 -0.000
(0.001) (0.001) (0.001) (0.001) (0.001) (0.001) Numeracy test 0.211*** 0.156*** 0.062*** 0.010 0.076*** 0.043
(0.030) (0.037) (0.021) (0.042) (0.026) (0.043)
Num. test*exp. 0.003* 0.003* 0.002
(0.002) (0.002) (0.002)
Literacy test -0.020 0.009 0.035 0.055 0.064** 0.080*
(0.032) (0.039) (0.021) (0.041) (0.026) (0.043)
Lit. test*exp. -0.002 -0.001 -0.001
(0.002) (0.002) (0.002)
Observations 30,263 30,263 31,277 31,277 25,931 25,931
R-squared 0.103 0.103 0.183 0.184 0.112 0.113
The table shows the point estimates for Equation 3. The dependent variables are shown at the top of the column. We follow the strategy of [2] and we do not use additional controls except the country dummies. Standard errors are calculated with the jackknife method (suggested by [47]) using 80 replication weights. All of the results are calculated by using sampling weights provided by the survey.
Discrimination based on expected rate of childbirth Some employers may offer less skill-intensive tasks to workers who are expected to stay with the firm for a shorter period of time. As a consequence, employers may discriminate against women because they are more likely to exit the firm for maternity leave. To test this hypothesis, we organize workers in labor market segments by country, education and age, and merge the segment-specific birth rates from the Human Fertility Database [34].
21Using the merged database, we run the following regression:
y
i= β
0+β
1∗f emale
i+β
2∗f ertillty
c+β
3∗f emale
i∗f ertillty
c+γ∗X
i+u
i(4) Again, the left hand-side variables are the skill use indices at work. F ertility
cdenotes country-education-age specific birth rates, while X
iare the same con- trol variables as in Equation 2. The parameter of f ertility
cmeasures the effect of women’s fertility rate on men in the same demographic segment.
22This pa- rameter can even be positive if firms allocate the skill-intensive tasks from
21 Note: The age specific fertility rate differs country by country and educational level;
that is why it is not sufficient to examine the age specific gender gap in skill use.
22 As the fertility rate is defined for women only, we merge women’s fertility by country- education-age to the data. E.g. in the case of a 27-year-old Italian man with a university degree, this parameter shows the effect of the fertility rate of a similar Italian woman (27- year-old, with a university degree).
Table 9 The effect of birth rate on the gender gap in skill use
(1) (2) (3) (4) (5) (6)
Numeracy skill use Literacy skill use ICT skill use Female -0.311*** -0.140*** -0.353*** -0.193*** -0.335*** -0.163***
(0.028) (0.027) (0.025) (0.027) (0.024) (0.027) Fertility rate 0.521 1.133*** -1.663*** 1.409*** 0.407 1.055***
(0.366) (0.371) (0.367) (0.428) (0.393) (0.380) Fertility rate* -0.194 -0.823** 0.980* -0.679 1.785*** 0.852*
Female (0.522) (0.404) (0.498) (0.485) (0.493) (0.465)
Controls Yes Yes Yes
Observations 21,130 21,130 21,130 21,130 21,130 21,130
R-squared 0.025 0.223 0.028 0.207 0.022 0.273
Notes: The table shows the point estimates for Equation 4. The dependent variables are shown at the top of the column. The control variables are the same as in Table 5: partner dummy, child dummy, years of education, experience, experienceˆ2, numeracy and literacy test scores, occupation categories (ISCO 3-digit), country fixed effects, parents’ highest level of education and parents’ immigration status, dummy for full time work, self-employment dummy, dummy for having a permanent contract, dummies for 1-digit industry, 5 firm size categories, private sector. Standard errors are calculated with the jackknife method (suggested by [47]) using 80 replication weights. All of the results are calculated by using sampling weights provided by the survey.
women to men more in higher fertility rate segments.
23Our main variable of interest is β
3, which is negative if women of a larger fertility rate cohort are assigned less skill-intensive tasks. We consider this parameter as the measure of statistical discrimination, as it shows the effect of the average behavior of the labor market segment on individual outcomes.
The point estimates for Equation 4 show mixed results (Table 9). The estimated effect of women’s fertility rate on men (β
2) varies a lot between the skill use indices and they are highly sensitive to the inclusion of control variables, but are mostly positive. As the average fertility rate in our sample is 0.03, the estimated parameters seem to have a very low effect on the skill use of men.
Turning to the main variable of interest, Column (2) shows that the fer- tility rate decreases the numeracy skill use of women compared to men of the same age and educational level. Again, the point estimates are low, as the gender gap in skill use would decrease only by 0.823*0.03=0.024 if the birth rate decreased to zero. Moreover, Column (4) reveals that the birth rate does not decrease the literacy skill use of women significantly. The point estimate is negative but statistically not different from zero ( coef. -0.679 s.e 0.485).
Finally, we do not find a significant negative relationship between the fertility rate and ICT skill use of women (coeff 0.852 s.e. 0.465) even if we control for individual characteristics in Column (6). Based on these results, we conclude that discrimination based on cohort-specific fertility rates cannot explain the gender gap in skill use.
23 This may be the case if old and young workers of the same educational level are not perfect substitutes [17], but women and men of the same age and skills are close substitutes.