Investigation of the Compressive Behavior of a Freeze-Cast Cu Foam Using Acoustic Emission Measurement
Csilla Kádár,* Hyeji Park, Péter Jenei, Myung-Yeon Kim, Ábel Szabó, Heeman Choe, and Jen ő Gubicza
1. Introduction
Metallic foams, which contain well-con- trolled pores, are widely used for numerous structural and energy applications due to their high specific mechanical strengths and stiffnesses, controllable pore morphol- ogies, high specific surface areas, decent impact energy absorptions, and their light weight.[1–7]The special features of foams are more diverse and distinct for foams in which the contained cells are open, and the pores are 3D interconnected, as opposed to the foams in which the cells are closed. Such open-cell metallic foams support high surface areas that promote excellent gas and liquid permeability.
Thus, they are extensively used in advanced functional applications such as batteries, supercapacitors, and fuel cells, as well as structural applications.[3,8]
Among the numerous open-cell metallic foams, Cu or Cu-based alloy foams have excellent thermal and electrical conductivity and are of great interest for energy and electronic applications. Moreover, their high specific surface areas and regularly distributed open pores allow for more effi- cient electrochemical reactions, resulting in prolonged and improved device performance.[9–14]Several studies have reported on various aspects of the processing and properties of Cu foams that were synthesized using various methods, such as lotus-type foaming[15], dealloying[16], electrodeposition[17], space-holder technique[18], and freeze casting followed by sintering[19–21]. Among these methods, freeze casting is attracting considerable attention because of its low processing cost and high potential for scalability. Ramos and Dunand demonstrated the production of Cu foams with elongated pores using freeze casting.[19]Ran et al.
reported that thermal decomposition from CuO to Cu could serve as an alternative method to generate Cu foams with equi- axed pores by exploiting the nondirectional solidification of slur- ries.[20]Park et al. published a systematic study that established the morphological influences of important processing parame- ters and how the pore orientation (either parallel or normal to the load axis) impacted compressive properties of freeze-cast Cu foams.[21]
In this article, salient deformation mechanisms are studied using acoustic emission (AE) in a freeze-cast Cu foam during compression parallel and perpendicular to the freezing direction.
The AE method is useful for investigating damage processes in Dr. C. Kádár
Department of Materials Science and Engineering Budapest University of Technology and Economics Muegyetemrakpart 3, Budapest H-1111, Hungary˝ E-mail: kadar@eik.bme.hu
Dr. C. Kádár
MTA–BME Lendület Composite Metal Foams Research Group M˝uegyetemrakpart 3, Budapest H-1111, Hungary
Dr. C. Kádár, Dr. P. Jenei, Á. Szabó, Prof. J. Gubicza Department of Materials Physics
EötvösLoránd University
P.O.B. 32, Budapest H-1518, Hungary Dr. H. Park, Dr. M.-Y. Kim, Prof. H. Choe School of Materials Science and Engineering Kookmin University
77 Jeongneung-ro, Seongbuk-gu, Seoul 02707, Republicof Korea The ORCID identification number(s) for the author(s) of this article can be found under https://doi.org/10.1002/adem.202100378.
© 2021 The Authors. Advanced Engineering Materials published by Wiley- VCH GmbH. This is an open access article under the terms of the Creative Commons Attribution License, which permits use, distribution and reproduction in any medium, provided the original work is properly cited.
DOI: 10.1002/adem.202100378
Herein, the compressive behavior of Cu foams with lamellar structures processed by the freeze-casting method is interrogated in directions parallel and perpen- dicular to the direction of freezing. Deformation is monitored using simultaneous acoustic emission (AE) measurements and video recordings of changes at the sample surface. Significant differences are observed between the stressstrain curves acquired during compression in the two directions. For parallel loading, relatively high peak stress is detected at a strain of about 3%, followed by a plateau, and, at high enough loadings, the Cu foam hardens. The AE results suggest that the decrease in stress from the peak value to the plateau value arises from fractures in the thick lamellae lying nearly parallel to the freezing direction.
For perpendicular loading, the energy of the AE events is lower because, in this case, the thinner struts that connect the thick lamellae bend and break more easily. For this case of perpendicular loading, the peak stress is missing from the stress–strain curve. Further deformation yields a gradual increase in the energy of the AE signals, suggesting that the thicker lamellae also break during
densification.
www.aem-journal.com
mechanisms. In this study, AE is used to investigate the compressive behavior of freeze-cast Cu foams both parallel and perpendicular to the freezing direction, to identify the main failure mechanisms for the two different loading modes.
2. Results and Discussion
2.1. Microstructural Characterization
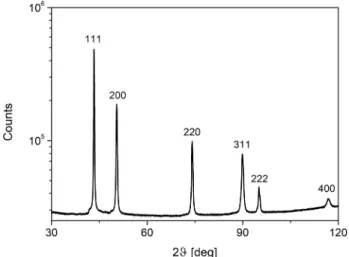
The X-ray diffraction pattern inFigure 1reveals that the foam struts are single-phase Cu materials without significant oxide
sity of the six freeze-cast Cu foam samples was 0.360.02, which corresponds to a porosity of 642%, as estimated from the masses and dimensions of the samples and considering the bulk Cu density to be 8.96 g cm3.[30]
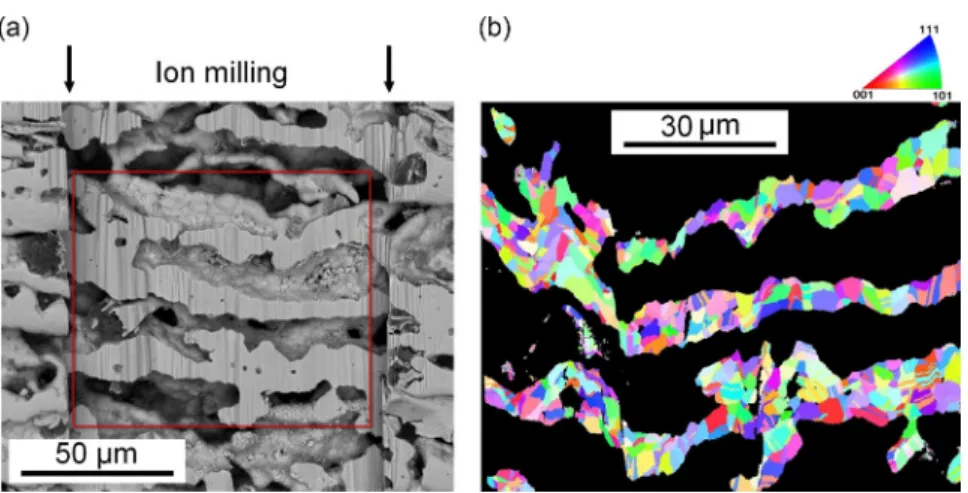
The grain size in the foam walls was determined by scanning electron microscopeelectron backscatter diffraction (SEMEBSD). The foam surface was etched by Ga ion milling to produce a surface of sufficiently good quality for EBSD analy- ses. The details of this surface treatment are provided in the Experimental Section. Figure 3a shows a SEM micrograph obtained on the ion-milled surface, whereas the corresponding EBSD orientation map is shown in Figure 3b. The walls of the Cu foam are polycrystalline with an area-weighted mean grain size of about 2.81.2μm evaluated from about 800 grains.
The samples are texture-free based on both the X-ray diffraction pattern and the EBSD analysis.
2.2. Deformation of Cu Foams
Figure 4a and 4b show typical deformation curves, correspond- ing AE responses, and count rate up to a strain of 45–50% for compression parallel and perpendicular to the freezing direction of the Cu foam material. Foams subjected to parallel loading, that is, when the directions of loading and freezing are parallel, exhibit an initial quasilinear stage and then a transient regime directly before the peak stress. A drop in stress follows the peak stress and, after a short plateau, strain hardening occurs atε
>15%. Small local drops in stress are apparent in this region (ε>15%). For foams under perpendicular loading, that is, when the direction of loading is perpendicular to the freezing direction, the stress increases monotonically with increasing strain without Figure 1. X-ray diffraction pattern obtained from a Cu foam processed by
freeze casting.
Figure 2. Optical microscopic images of Cu foams showing the surfaces lying a) perpendicular and b) parallel to the direction of freezing. In (b), the freezing direction is vertical.
any visible local drops in stress; however, regions with constant stress can be observed. The stress–strain curve slope increases significantly at strains greater than 40%, which signifies the ini- tiation of densification. This compressive behavior is similar to those of other freeze-cast Cu foams studied by Park et al. and Gubicza et al.[21,28]Nonetheless, the behaviors of foams studied here are different from foams investigated by Liu et al., in which the parallel and perpendicular compressive behaviors were highly similar (i.e., the stress increased monotonically without exhibiting peak stress in parallel loading), despite such foams having similar cell structures to those studied here.[31]
The AE responses of the examined Cu foams under loading in parallel and perpendicular directions exhibit distinct AE events, similar to pure Al and eutectic Al–Si foams with pore sizes of 400–500μm.[22,32] For both cases, low-amplitude signals were observed in the quasilinear stage, whereas high amplitudes (>1 mV) were observed after the first stage. The data in Figure 4 show that for both loading directions, the abrupt drops in stress and regions of local constant stress regions were preceded by a large AE signal (>1 mV). These results indicate that the high- amplitude signals arose from the fracturing of lamellae and struts.
High values for count rates (>200 s1) typically coincide with the high-amplitude AE signals. The count rate is also relatively high at a strain of about 2% deformation over the quasilinear region, where the amplitude of the AE signals is 0.07 mV. Under parallel loading, a high peak in the count rate coincides with the end of the quasilinear stage. By comparison, the initial stage ends at a strain of3% under perpendicular loading (see Figure 4), whereas a high peak in the count rate occurs at a strain of2%. Another difference between the results obtained under parallel and perpendicular loading conditions is that the amplitude of the AE signals in the strain range of3%<ε<25% is larger under parallel loading, which causes high AE count rate peaks. As the strain increases, the height of the peaks in the count rate increases as the foam is com- pressed perpendicularly to the freezing direction but decreases for parallel loading.
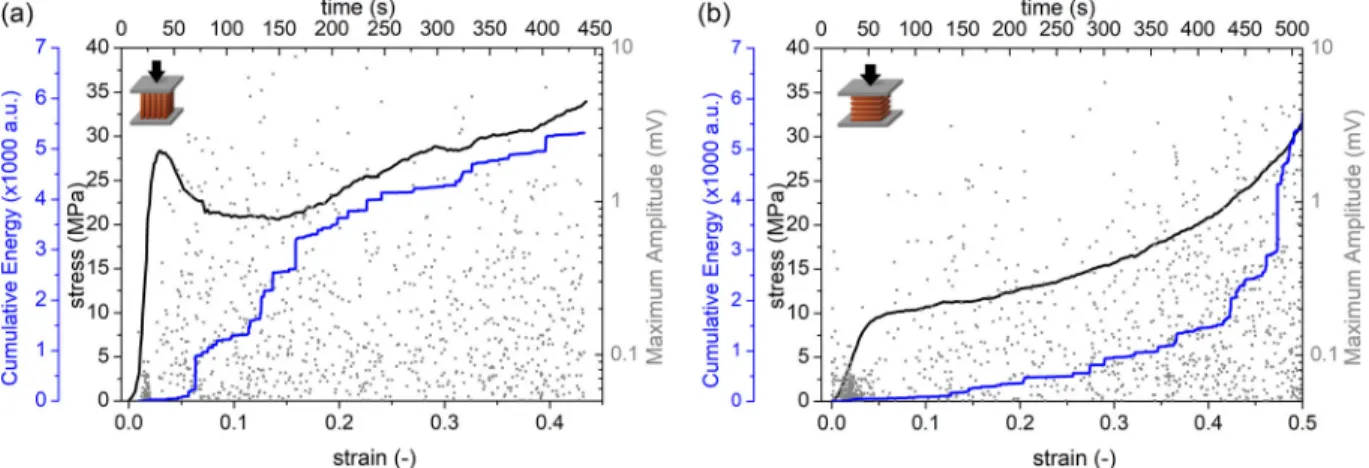
The energy and amplitude data of the individual AE events were analyzed to uncover further differences in the failure mech- anisms under loading in either of the two directions. For this purpose, the raw AE data were processed by setting a threshold level of 0.04 mV. Figure 5 shows the cumulative energy and amplitude of individual AE events and the corresponding Figure 3. a) SEM image depicting the area that was treated by ion milling. The arrows indicate the direction of the milling Ga ion beam. b) EBSD orientation map acquired from the ion-milled area. The direction of freezing was horizontal.
Figure 4. The engineering stress–strain curve (black line), the AE response (gray line), and the count rate curve (red line) for compression testing conducted in a) parallel and b) perpendicular to the freezing direction.
deformation curves. The cumulative energy function exhibits abrupt jumps except for the quasilinear stage under both parallel and perpendicular loadings. These jumps coincide with large AE amplitude signals in Figure 4, establishing the presence of high- energy AE events. The frequency and magnitude of jumps are smaller for perpendicular loading up to a strain of about 35%.
The count rate, maximum amplitude values, and cumulative energy as a function of strain behave similarly up to the strain of 2%, regardless of the loading direction. This suggests that the main plastic deformation mechanisms are the same in each direction, namely, dislocation slips and bending of the struts and lamellae.
In addition to monitoring the AE signals, the deformation of the foam samples was recorded by video. Files containing speed- up videos of foams subjected to parallel and perpendicular load- ing can be found in the supplementary materials as Cu_parallel_4x.flv and Cu_normal_4x.flv, respectively.Figure 6 shows snapshots from these videos at various imposed strains.
No strain localization is observed on the surface of the samples in the quasilinear regime; however, strain localization is apparent (arrows in Figure 6) at the end of this initial stage (i.e., at the
beginning of the transient regime) at the strains of near 2%
and 3% for parallel and perpendicular loadings, respectively.
For parallel loading, signs of fracture are observed on the surface at around peak stress, indicating that the drop in stress arises from the fracturing of lamellae. Simultaneously, high-amplitude AE signals are measured on all three foam samples, establishing that the origin of these AE signals is the fracture of lamellae.[32]
For perpendicular loading, visible fractures appear at strains of around 5% and are accompanied by high-amplitude AE signals.
These video recordings reveal the formation of shear bands in foams subjected to parallel and perpendicular loadings after the quasilinear and transient stages. After the appearance of thefirst shear band for foams loaded perpendicularly, the formation of a second and even a third shear band was observed. Such bands were almost horizontal and localized to a small volume. For par- allel loading, after the formation of the first shear band, the lamellae and struts in the regions adjacent to this shear band broke, yielding high-energy AE signals.
The average grain size in the lamellae and struts of the foams studied here was about 3μm. According to investigations by Figure 5. The engineering stress–strain curve (black line), cumulative energy (blue line), and maximum amplitudes of the AE events (scatter) for com- pression tests conducted a) parallel and b) perpendicular to the freezing direction.
Figure 6. Deformation of the foam samples during compression at various strains either parallel (top) or normal (bottom) to the direction of freezing.
Black arrows indicate thefirst signs of deformation on the surface of the specimens.
Vinogradov, pure polycrystalline (bulk) metals withfine grains produce no measurable AE signals during plastic deformation under quasistatic load.[33]This suggests that only sudden local- ized changes in the structure, for example, collective bending, buckling, and fracture of lamellae/struts, can be measured for the Cu foam materials investigated here. AE measurements on pure Al foams with pore sizes less than 500μm also corrobo- rate that the dislocation slip does not produce measurable AE signals.[22,31]This indicates that the origins of the abrupt jumps in the cumulative energy curve in perpendicular loading (Figure 5b) are from the collective fracture of lamellae. The prog- ress of such mechanical failure can be established because the fracture of thicker lamellae results in higher-energy AE signals.[32]
For example, the simplified lamellae structure shown in Figure 7can be considered as a schematic of the foam micro- structure, which can be used for understanding the major failure mechanisms. Perpendicular loading of such a lamellar structure, in accordance with Figure 6 and 7b, produces shear bands almost parallel to the freezing direction, suggesting that the foam struc- ture fails by the fracture of the thin struts that connect the thicker lamellae oriented parallel to the direction of freezing. At small strains, the collective bending and the rotation of these thin struts most likely occur during the quasilinear stage, similar to the case of a honeycomb structure, in which the elastic defor- mation can be described as cell wall bending and rotation.[29]
Such deformation mechanisms result in low-energy signals in the quasilinear stage. Indeed, for foams subjected to perpendic- ular loading, AE signals with relatively lower energy and higher amplitude were measured in the second stage (ε<0.3) (Figure 5), indicating the fracture of the thinner lamellae (which is preceded by collective bending of struts), which ultimately promotes the formation of nearly horizontal shear bands (see Figure 6). The energies of the AE signals increase at larger strains (ε>0.4), suggesting that fracture of the thicker lamellae occurs during densification. For parallel loading, the foam structure fails by the fracture of thicker and nearly vertical lamellae. The fracture of these thicker lamellae manifests in high-energy AE signals and causes abrupt jumps in the cumulative energy function, even in the plateau region.
3. Conclusion
This study investigated the compression behavior of an aniso- tropic Cu foam manufactured by the freeze-casting method.
The failure mechanisms were revealed using AE techniques and cinematography for foams subjected to compression both parallel and normal to the direction of freezing up to an engineer- ing strain of about 0.5. Due to the small grain size of the lamellae, the main (measurable) AE source was the collective fracture of the thick lamellae and thin struts after the quasilinear and tran- sient stages. The energies and amplitudes of these AE events were lower for loading in the perpendicular direction over the region bounded by strains of 3%<ε<25%. This indicates that the primary source of AE signals is the fracture of the thinner struts until densification begins. In contrast, AE measurements and the video recordings confirm that the main source of AE sig- nals was the fracture of the thicker lamellae for foams subjected to parallel loading. Changes in energy and count rate for perpen- dicularly loaded foams at strains of about 0.350.4 indicate that the failure of the thicker lamellae began during densification.
4. Experimental Section
Preparation of Cu Foams: Cu foams were produced using a freeze-casting process that involved the following steps. First, 12.5 vol % cupric oxide powder (CuO,40 nm, U.S. Research nanomaterials Inc., USA) and 2.5 wt% polyvinyl alcohol (PVA, Mw 89 00098 000, 99þ% hydrolyzed, Sigma-Aldrich Co., USA), which served as a binder, were mixed and dispersed in 30 mL deionized water to produce a slurry. The slurry was dispersed using a magnetic stirrer (for 10 min) and a water-bath ultrasonicator (for 1 h); here, the dispersion process was repeated twice to further prevent the agglomeration of the particles. Next, the slurry was poured into a cylindrical Teflon mold (87 mm, outer diameter, and 55 mm, inner diameter) on the top surface of a copper rod, where the temperature of the top of the copper rod was maintained at–10C using liquid nitrogen and a heater. After the slurry was completely frozen for 1 h, the solidified slurry was then freeze dried for 48 h in a freeze dryer (Operon, FDU-7003, Republic of Korea) at 88C with 5103torr.
Finally, the green body was heat treated in a tube furnace under Ar5% H2gas mixture in two steps. First, the material was maintained at 250C for 4 h in the furnace to remove the binder and reduce cupric oxide. Then, the material was sintered at 800C for 6 h. After reduction Figure 7.Schematic diagrams and corresponding images of Cu foams compressed a) parallel and b) perpendicular to the direction of freezing. The white lines outline the shear bands formed during compression. In the schematic, thinner lines represent the thin struts, whereas thicker lines show the thick lamellae parallel to the direction of freezing.
(8 mm in length and 44 mm in cross section) by an MTS810 (MTS Systems Corporation, Eden Prairie, MN, USA) with a constant cross-head velocity corresponding to an initial strain rate of 0.001 s1under ambient temperature. Displacement was measured by an extensometer. In each case, the longitudinal axis of the sample was parallel to the direction of the compressive loading. The foams exhibited anisotropy due to the unidirectional freeze-casting process. Thus, three samples were examined under parallel loading and three under normal loading, where the direc- tions were with respect to the direction of freeze casting. The sample den- sity was calculated using measurements of the sample mass and the sides of the square prisms to enable an estimate of volume. The relative density was taken as the density divided by the theoretical density of Cu (8.96 g cm3).[30]The average relative densities of the 33 samples tested in nor- mal and parallel directions were 0.340.01 and 0.3700.001, respec- tively. The AE response and deformation of the sample surface were also monitored during compression. The AE signals were recorded in streaming mode without a threshold with a 1 MHz sample rating using a Vallen AMSY-6 system (Vallen Systeme GmbH, Icking, Germany) with a PAC Micro30S broadband sensor (Physical Acoustics, Prinston Junction, USA) and a wave guide. The signals were amplified with an AEP5 preamplifier (Vallen Systeme GmbH, Icking, Germany) that provided a gain of 40 dB. The count rate was established by postprocessing the AE data and applying a threshold level of 0.04 mV.
Supporting Information
Supporting Information is available from the Wiley Online Library or from the author.
Acknowledgements
This research was supported by the Hungarian-Korean bilateral Research Program (TÉT) no. 2018-2.1.17-TÉT-KR-2018-00003. This work was com- pleted in the ELTE Institutional Excellence Program (TKP2020-IKA-05), which was financed by the Hungarian Ministry of Human Capacities.
C.K. and P.J. would like to acknowledge support from the JánosBolyai Research Scholarship of the Hungarian Academy of Sciences. The research reported in this article and conducted at BME was supported by the NRDI Fund (TKP2020 NC, grant no. BME-NC) based on the charter of bolster issued by the NRDI Office under the auspices of the Ministry for Innovation and Technology. H.C. also acknowledges support from the Basic Science Research Program (NRF-2018R1D1A1B07048390) through the National Research Foundation of Korea. The article was supported by the ÚNKP-20-5 New National Excellence Program of the Ministry for Innovation and Technology from the source of the National Research, Development, and Innovation Fund.
Conflict of Interest
The authors declare no conflict of interest.
[1] M. F. Ashby, A. Evans, N. A. Fleck, L. J. Gibson, J. W. Hutchinson, H. N. G. Wadley, Metal Foams: A Design Guide, Butterworth- Heinemann2000.
[2] J. Banhart,Prog. Mater. Sci.2001,46, 559.
[3] L.-P. Lefebvre, J. Banhart, D. C. Dunand,Adv. Eng. Mater.2008,10, 775.
[4] G. J. Davies, S. Zhen,J. Mater. Sci.1983,18, 1899.
[5] H. Jo, M. J. Kim, H. Choi, Y.-E. Sung, H. Choe, D. C. Dunand,Metall.
Mater. Trans. E,2016,3, 46.
[6] H. Park, J. H. Um, H. Choi, W.-S. Yoon, Y.-E. Sung, H. Choe,Appl.
Surf. Sci.2017,399, 132.
[7] H. Choi, O.-H. Kim, M. Kim, H. Choe, Y.-H. Cho, Y.-E. Sung,ACS Appl. Mater. Interfaces,2014,6, 7665.
[8] K. P. Dharmasena, H. N. G. Wadley,J. Mater. Res.2002,17, 625.
[9] H.-C. Shin, M. Liu,Adv. Funct. Mater.2005,15, 582.
[10] P. Chladek, E. Croiset, W. Epling, R. R. Hudgins,Can. J. Chem. Eng.
2008,85, 917.
[11] A. Siahpush, J. O’Brien, J. Crepeau,J. Heat Transfer,2008,130.
[12] S. Sen, D. Liu, G. T. R. Palmore,ACS Catal.2014,4, 3091.
[13] G. Avgouropoulos, J. Papavasiliou, M. K. Daletou, J. K. Kallitsis, T. Ioannides, S. Neophytides,Appl. Catal. B Environ.2009,90, 628.
[14] Y. Li, S. Chang, X. Liu, J. Huang, J. Yin, G. Wang, D. Cao,Electrochim.
Acta2012,85, 393.
[15] S. K. Hyun, H. Nakajima,Mater. Sci. Eng. A,2003,340, 258.
[16] G. Han, J. H. Um, H. Park, K. Hong, W.-S. Yoon, H. Choe,Scr. Mater.
2019,163, 9.
[17] H. Park, C. Ahn, H. Jo, M. Choi, D. S. Kim, D. K. Kim, S. Jeon, H. Choe,Mater. Lett.2014,129, 174.
[18] A. M. Parvanian, M. Saadatfar, M. Panjepour, A. Kingston, A. P. Sheppard,Mater. Des.2014,53, 681.
[19] A. I. C. Ramos, D. C. Dunand,Metals2012,2, 265.
[20] H. Ran, P. Feng, Z. Liu, X. Wang, J. Niu, H. Zhang,Metals2015,5, 1821.
[21] H. Park, M. Choi, H. Choe, D. C. Dunand,Mater. Sci. Eng. A2017, 679, 435.
[22] A. H. Brothers, D. W. Prine, D. C. Dunand,Intermetallics2006,14, 857.
[23] C. Kádár, K. Máthis, F. Chmelík, M. Knapek, I. N. Orbulov,in Proc.
11th Int. Conf. Porous Met. Met. Foam. (MetFoam 2019), The Minerals, Metals & Materials Series., Springer, Cham. (Ed:
N. Dukhan)2020, p. 107.
[24] H. Park, K. Hong, J. S. Kang, T. Um, M. Knapek, P. Minárik, Y.-E. Sung, K. Máthis, A. Yamamoto, H.-K. Kim, H. Choe,Mater.
Sci. Eng. C2019,97, 367.
[25] K. Hong, H. Park, Y. Kim, M. Knapek, P. Minárik, K. Máthis, A. Yamamoto, H. Choe,J. Mech. Behav. Biomed. Mater.2019,98, 213.
[26] C. Kádár, K. Máthis, M. Knapek, F. Chmelík,Materials2017,10, 196.
[27] J. C. Li, D. C. Dunand,Acta Mater.2011,59, 146.
[28] J. Gubicza, P. Jenei, K. Nam, C. Kádár, H. Jo, H. Choe,Mater. Sci. Eng.
A2018,725, 160.
[29] L. J. Gibson, M. F. Ashby,Cellular Solids, Cambridge University Press, Cambridge UK1997.
[30] E. A. Brandes, G. B. Brook,Smithells Metals Reference Book, 7th edn., Butterworth-Heinemann, Oxford, UK1992.
[31] X. Liu, J. Wu, B. Luo, L. Zhang, Y. Lai,Mater. Lett.2017,205, 249.
[32] M. Knapek, P. Dobron, F. Chmelík, M. Zimina, J. Pešiˇˇ cka, E. Combaz, A. Mortensen, in Light Met. 2014 (Ed:
J. Grandfield), Springer International Publishing, Cham 2016, p. 339.
[33] A. Vinogradov,Scr. Mater.1998,39, 797.