Crop rotation and agri-environment schemes determine bumblebee communities via 1
flower resources 2
Riho Marja1,*, Eneli Viik2, Marika Mänd3, James Phillips4, Alexandra-Maria Klein5, Péter 3
Batáry6,7 4
5
1Estonian Environment Agency, Rõõmu tee St. 2, Tartu 50605, Estonia.
6
2Agricultural Research Centre, Teaduse St. 4/6, Saku 75501, Estonia.
7
3Institute of Agricultural and Environmental Sciences, Estonian University of Life Sciences, 8
Kreutzwaldi St. 5, Tartu 51014, Estonia.
9
4School of Environment and Technology, University of Brighton, Cockcroft Building, Lewes 10
Road, Brighton BN2 4GJ, United Kingdom.
11
5Nature Conservation and Landscape Ecology, University of Freiburg, Tennenbacher 4, 12
Freiburg D-79106, Germany.
13
6Agroecology, University of Goettingen, Grisebachstr. 6, Göttingen D–37077, Germany.
14
7GINOP Sustainable Ecosystems Group, MTA Centre for Ecological Research, Klebelsberg 15
Kuno u. 3, 8237 Tihany, Hungary.
16 17
*Corresponding author: Tel.: +372 5225725. Fax: +3727 422180. E-mail: rmarja@ut.ee 18
19
Running title: Crop rotation determines bumblebee communities 20
21
Word count of summary: 313 Word count of main text: 4203 22
Acknowledgements word count: 126 Word count of references: 1139 23
Word count of legends: 594 Number of figures: 4 24
Number of references: 41 Number of tables: 1
25
Abstract 26
1. In many parts of the world, farmland pollinators decreased significantly during the last half 27
of the 20th Century mainly due to land use changes and agricultural intensification.
28
2. We studied the effect of different typical crop rotations and agri-environment schemes 29
(AES) on bumblebee diversity in Estonia. We compared species abundances between four 30
crop rotation types [cereal rollover (no change from one year to the next), cereal to mass 31
flowering crops (hereafter MFC), MFC rollover, and MFC to cereal fields] where all counts 32
were conducted in the second year, and in three farming types (conventional farming, organic 33
farming and environmentally friendly management).
34
3. We surveyed bumblebees and flower cover along 401 field margins in five consecutive 35
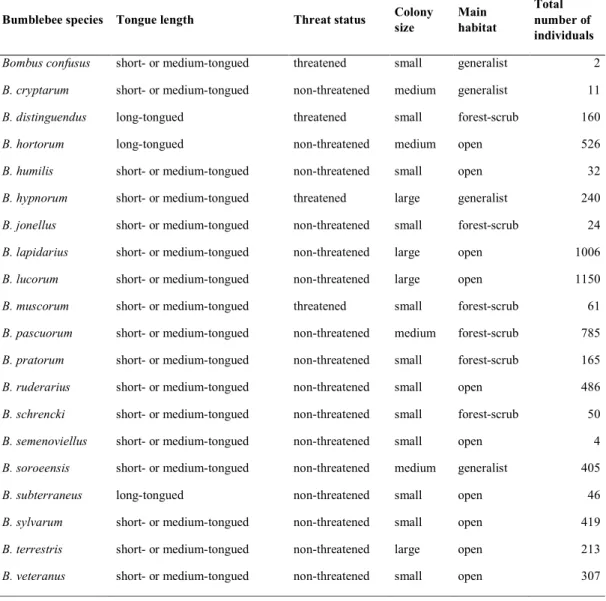
years, and recorded twenty species and more than 6000 individuals. Abundances of long- 36
tongued and threatened bumblebee species were higher at the field margins of cereal rollover 37
fields than for the other three crop rotation types. In addition, cereal rollover field margins 38
had higher abundances of medium colony species, generalists, and forest scrub species than 39
MFC rollover and MFC to cereal or cereal to MFC field margins. Bumblebee species richness 40
was higher at the field margins of both AES types than those of conventional farming.
41
However, in general the strongest driver of bumblebee presence was flower cover.
42
4. Higher bumblebee abundances in cereal rollover field margins were probably owing to a 43
concentration effect there and/or a dilution effect into MFC fields. Both AES schemes 44
supported increasing flower cover in field margins and thereby diversity of bumblebees, 45
indicating positive AES impacts upon wild pollinators.
46
5. Synthesis and applications. Crop rotation and AES determine bumblebee richness and 47
abundance via the availability of flower resources, but crop rotation constrains bumblebees 48
differently based on their traits. Therefore, future agri-environmental policy should account 49
for these management options. Crop rotation could be a simple, but efficient solution to 50
increase the biodiversity of agricultural landscapes.
51 52
Keywords: agri-environment schemes, biodiversity, bumblebee, concentration effect, crop 53
rotation, dilution effect, functional traits, land use, organic management, pollinator 54
1. Introduction 55
Bumblebees, among other pollinating insects, contribute to wild plant and crop pollination, 56
and therefore to plant biodiversity and food production (Kremen et al., 2007). Pollination by 57
bumblebees is known to increase the yields of almost 40 crops (Goulson, 2010). Thirty-five 58
percent of global crop production depends, to a degree, on pollinators (Klein et al., 2007), and 59
the global annual economic value of insect pollination is estimated to be between 215–529 60
billion dollars (IPBES, 2016). Therefore, conservation of farmland pollinators is one of the 61
key challenges of global crop production (Potts et al., 2016).
62
Industrial agriculture has caused remarkable declines in the diversity and abundance of 63
native flowers and semi-natural habitats, which in turn has caused decreases of wild 64
pollinators, particularly long-tongued bumblebees (Goulson, Lye & Darvill, 2008). Based on 65
a recent IUCN report, 46% of bumblebee species populations in Europe have declined (Nieto 66
et al., 2014). Drivers of the decline in pollinators include landscape homogenization, land-use 67
changes (e.g. the loss of semi-natural habitats and the increase in the area of cereal crops) and 68
the increasing use of synthetic pesticides and fertilizers (Winfree et al., 2009; Potts et al., 69
2010; Bommarco et al., 2012; Goulson et al., 2015). A reduction in the number of small-scale 70
farms has resulted in a decline in crop diversity and the loss of field margins (Sutcliffe et al., 71
2015). Agri-environment schemes (AES), such as set-aside semi-natural habitat, organic 72
farming, and wildflower strips for pollinators, have been developed and introduced in the 73
European Union since the late 1980s as a tool to address the negative environmental impacts, 74
including declines in biodiversity, of large-scale agricultural intensification (Batáry et al., 75
2015).
76
Across the EU, the effectiveness of AES in terms of species conservation has been 77
questioned owing to goals remaining unachieved as a consequence of a lack of targeting 78
many AES upon bumblebee abundances (recently e.g., Carvell et al., 2015; Wood et al., 80
2015). However, AES availability and utilisation might not be enough to halt and reverse 81
declines in bumblebees and particularly threatened species. Therefore, agricultural intensity as 82
well as landscape structure are also important factors with regard to conservation efforts 83
(Tscharntke et al., 2005, 2012).
84
Mass-flowering crops, such as clover species and oilseed rape, are significant food 85
resources for bumblebees and at the same time benefit from being pollinated. E.g. in Northern 86
Europe, sweet and red clover, which have deep corolla, benefit from being pollinated by long- 87
tongued bumblebee species (Westphal, Steffan-Dewenter & Tscharntke, 2003; Wood, 88
Holland & Goulson, 2015). In addition, resource continuity (Blüthgen & Klein, 2011) is 89
important, because mass-flowering crops are not always available to bumblebees during their 90
lifecycles. Therefore, the availability of wild flowers, especially those with deep corolla, is an 91
important driver of bumblebee diversity and population development (Williams & Osborne, 92
2009; Williams et al., 2015).
93
There is a knowledge gap regarding how temporal land-use change affects bumblebees.
94
To the best of our knowledge, this is the first multi-year study to evaluate the effect of crop 95
rotation on bumblebee communities. We investigated the impact of four different common 96
crop rotation types on bumblebee species richness and abundance, including comparisons 97
between species with different functional traits (tongue length, threat status, colony size, 98
habitat preference), during 2010–2014. In Estonia, crops are usually rotated every second 99
year, e.g. after being a cereal field for one or two years, there will be a rotation to mass 100
flowering crops or grasslands and vice versa. Hence, the overarching question is how does the 101
type of crop rotation determine the following year’s bumblebee community (species richness, 102
total abundance, and tongue-length/threat status/colony size/habitat preference group 103
abundances)? We hypothesized that bumblebee species richness and abundance are higher in 104
the field margins of mass-flowering crops than in the field margins of cereal crops, regardless 105
of the previous year’s crop in those fields (illustrative photos are shown in Fig. S1, 106
Supporting Information). In addition, we hypothesized a positive effect upon bumblebees of 107
organic and environmentally friendly management compared to conventional farming. We 108
collected data to test whether crop rotation and/or AES benefit bumblebees, and to identify 109
the possible drivers of bumblebee abundances (e.g., concentration or dilution effects 110
depending on the crop rotation type).
111 112
2. Materials and methods 113
2.1. Monitoring areas 114
We sampled true bumblebees Bombus ssp. (hereafter bumblebees) as part of an ongoing 115
evaluation of AES under the framework of the Estonian Rural Development Plan 2007–2013 116
(Agricultural Research Centre, 2015). Two regions of Estonia were studied: Põlva, Võru and 117
Valga counties (hereafter referred to as Southern Estonia; centre coordinates 57°52´N, 118
26°57´E) and Lääne-Viru, Järva and Jõgeva counties (hereafter Northern Estonia; centre 119
coordinates 59°4´N, 26°12´E; a map of the study areas is available in Fig. S2, Supporting 120
Information). These regions were selected based on differences in agricultural yields, AES 121
uptake, and landscape structure. Southern Estonia has a more diverse landscape and lower 122
yields (average cereal yield over 2004–2013 was 2792 kg/ha). Northern Estonia is 123
characterized by larger fields, a more open landscape, and high yields by Estonian standards 124
(average cereal yield for 2004–2013 was 3011 kg/ha). Additional information about the 125
regions, and selection of study farms, is available in Marja et al. (2014).
126
In each region 11 organic, 11 environmentally friendly managed (both had five-year 127
AES obligations with the possibility to prolong the obligation to six years, started in 2009), 128
aims of environmentally friendly management scheme is to promote farmland biodiversity, 130
with the major requirements of farmers being to allocate a minimum of 15% of arable land 131
(including rotational grasslands) to legumes, use diversified crop rotation, take soil samples to 132
determine optimal fertilizer requirements and create a fertilization plan, maintain/create 133
permanent grassland field margins (2–5 m wide), not use black fallow (fallow land with bare 134
soil, where the height of weeds does not exceed 5 cm), protect landscape elements, and limit 135
glyphosate applications. Organic farmers followed the Organic Farming Act by not using any 136
synthetic pesticides or GMOs, and restricting their use of most mineral fertilizers. Detailed 137
information about AES requirements and conventional farming rules is provided in Table S1, 138
Supporting Information.
139 140
2.2. Biodiversity survey and study design 141
Fieldwork for the evaluation of AES measures was carried out during the summers of 2010–
142
2014. Every year, each transect was surveyed three times (once in June, July, and August).
143
The first visit was made during the 23rd–30th of June, the second visit from the 15th–28th of 144
July, and the third between the 12th–23rd of August. Bumblebees were surveyed by walking 145
slowly along a 2 m wide and 500 m long transect, of which 400 m was permanent between 146
years and located in field margins (usually permanent grassland strips between the field and a 147
road/other field/ditch/forest etc., or if the margin was narrow, occasionally also on the edge of 148
a cropped field), with the remaining 100 m located in a field with an insect-pollinated crop 149
(e.g. clover) if present in the crop rotation, or if not, also in a field margin. Data from these 150
100 m section located in the field were not included in the analyses. Transects were divided 151
into shorter sections differentiated by crop types. The sections were marked on a map (scale 152
1:5000). During each fieldwork session, flower cover was estimated on a scale of 0–3 per 153
whole 2 m wide transect section where: 0 = no flowers suitable for bumblebees; 1 = >0 to 1/3 154
of the area with flowers suitable for bumblebees; 2 = 1/3 to 2/3 with suitable flowers, 3 = >2/3 155
covered with suitable flowers (Marja et al., 2014). All flowering-plant species known to be 156
used by bumblebees for foraging were classified as suitable (Table S2, Supporting 157
Information).
158
The bumblebee counts were conducted between 11:00 and 16:00 under good weather 159
conditions (temperature always above 15oC, and no rain or strong wind). We mainly 160
identified bumblebees on flowers to species in the field. If identification on flowers was 161
impossible, individuals were caught, identified, and released in the field, or on very rare 162
occasions were retained to identify later in the laboratory. Each year the number of each 163
bumblebee species was summed per transect over the three counts.
164
To test our hypotheses we included only bumblebees, flower cover, and crop rotation 165
data of such transect sections which were located in the two most common types of field 166
margins, those alongside cereals and mass-flowering crops. Cereal fields included rye, oat, 167
barley, triticale, and wheat (hereafter cereals). The mass-flowering crop fields contained 168
legumes (pea, bean, clover, alfalfa, sweet clover spp.) and oilseed rape (hereafter MFC). Crop 169
harvest time depends on the crop and weather conditions and varies from June to September.
170
Legumes are typically harvested in June (first cut) and August (second cut), but sometimes 171
cut only once in July. Winter oilseed-rape is harvested at the end of July or in August, spring 172
oilseed-rape in September, cereals typically in August or at the beginning of September 173
(depending also if it is sown in autumn or in spring). The overall sample to test our 174
hypotheses comprised 401 transect sections, whose lengths varied between 40–500 m (mean 175
226 ±SEM 6 m). Sample size for each year (number of transect sections) were as follows:
176
2010: 80; 2011:78; 2012: 73, 2013: 84 and in 2014: 86 transect sections (401 in total). A cross 177
table of sample size by crop rotation and management type is given in Table 1. All other crop 178
rotation types, such as potato, short-term grassland, permanent grassland, and pasture were 179
excluded from the analysis.
180
Part of the bumblebee dataset, the explanatory variables management type and flower 181
cover (years 2010–2012), is already published in Marja et al. (2014). However, in this study 182
we used a more comprehensive bumblebee dataset (2010–2014) that also included crop 183
rotation types. We added management type and flower cover into the analyses, as these are 184
important drivers of bumblebee abundances (Marja et al., 2014). Moreover, the present study 185
investigated different bumblebee variables: abundance of bumblebees sub-divided by 186
functional groups (tongue-length, colony size, and habitat preference), and threat status.
187 188
2.3. Statistical analysis 189
We analysed flower cover and bumblebee variables using linear mixed-effects models in R (R 190
Development Core Team, 2016). The ‘lme4’ (Bates et al., 2016) package for R was used to 191
conduct all analyses. Bumblebee response variables modelled were species richness, 192
abundance of all bumblebee species, abundance of long-tongued species (three species:
193
Bombus distinguendus, B. hortorum, and B. subterraneus), abundance of short- and medium- 194
tongued species (all other species, hereafter short-tongued species), abundance of threatened 195
species, and abundance of non-threatened species. We analysed long-tongued bumblebees 196
separately due to their specific ecological niche, i.e. only these species can pollinate flowers 197
with deep corollas, such as red clover and field bean. Species classified as vulnerable 198
(hereafter threatened) in Europe under the recent IUCN list (Nieto et al., 2014) were: Bombus 199
confusus, B. distinguendus, B. hypnorum, and B. muscorum. We also modelled pooled 200
bumblebee abundances based on species’ colony size (large, medium, and small) and main 201
habitat (open-land specialists, forest specialists, and generalists). We used these life-history 202
traits, because a recent study indicated that bumblebees have trait-dependent vulnerability 203
based on landscape heterogeneity (Persson et al., 2015). We provide a list of the bumblebee 204
species with classification according to tongue length, colony size, preferred habitat, and 205
threat status in Table S3, Supporting Information.
206
Owing to the bumblebees being over-dispersed, we used mixed-effects models with a 207
negative binomial distribution. The explanatory variables of main interest were crop rotation 208
type [four factors: cereal rollover fields (rollover = no change from one year to the next);
209
cereal to MFC fields; MFC rollover fields; MFC to cereal fields], (e.g. in cereal to MFC 210
fields, surveying was done in MFC field margin), management type (three levels:
211
conventional; environmentally friendly management; organic farming), and flower cover 212
(average value over the three counts per transect). Note that bumblebee response variables 213
were always taken during the second year of crop rotation. First, we tested flower cover as a 214
dependent variable in relation to crop rotation and management. Second, we tested all 215
bumblebee variables against crop rotation, management, and flower cover. Since we had 216
multiple years and the study regions had different landscape structures (Northern Estonia has 217
a simpler landscape structure than Southern Estonia), we treated year and region as crossed 218
random factors in the model (R command: (1|year)+(1|region). As the length of transect 219
sections ranged from 40 to 500 m, they were treated as an offset function [R command:
220
offset=log(transect length)]. We also calculated the variance inflation factor between 221
explanatory variables (R package "car", Fox & Weisberg, 2011), and identified no values 222
exceeding 1.4 for any of the models, which suggests that no collinearity occurred.
223 224
3. Results 225
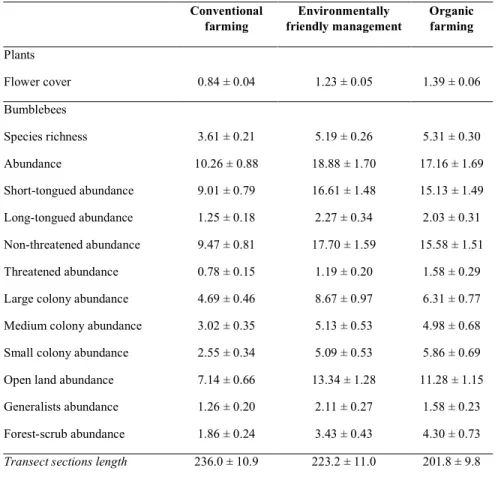
We observed a total of 6092 individuals of 20 bumblebee species during 2010–2014 (see 226
Table S3, Supporting Information). We provide mean values and standard errors of 227
investigated flower cover and bumblebee variables per transect sections length according to 228
crop rotation and management type in Tables S4 and S5, Supporting Information.
229
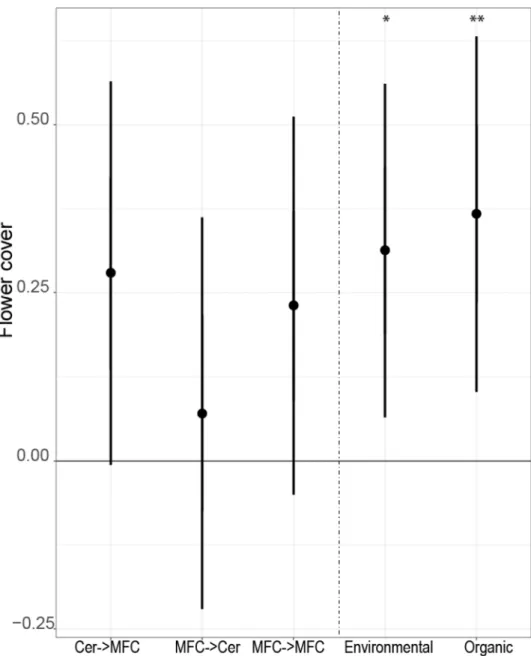
Flower cover was higher in organic and environmentally friendly managed field 230
margins, compared to the margins of conventional fields, but was not related with crop 231
rotation types (Fig. 1). As an explanatory variable, flower cover was positively associated 232
with all bumblebee groups (Fig. 2,3,4 and Fig. S3,S4).
233
Crop rotation type was not related to bumblebee species richness or abundance (Fig. S3, 234
Supporting Information). Bumblebee species richness in the field margins of both AES 235
management types were higher compared to the margins of conventional fields. Bumblebee 236
abundance was significantly higher in environmentally friendly managed field margins 237
compared to those of conventional fields; no significant difference in bumblebee abundance 238
occurred between the field margins of organic and conventionally managed fields.
239
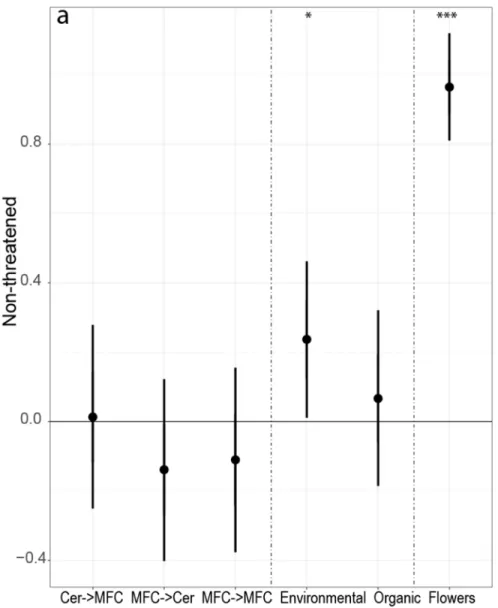
Abundances of non-threatened species did not differ between crop rotation types, but 240
abundance of threatened species was highest in cereal rollover field margins, compared to the 241
other three rotation types (Fig. 2). Bumblebee abundance of non-threatened species was 242
significantly higher in environmentally friendly managed field margins compared to those of 243
conventional field margins. Abundances of threatened species were higher in both AES 244
management types field margins, compared to the margins of conventional fields.
245
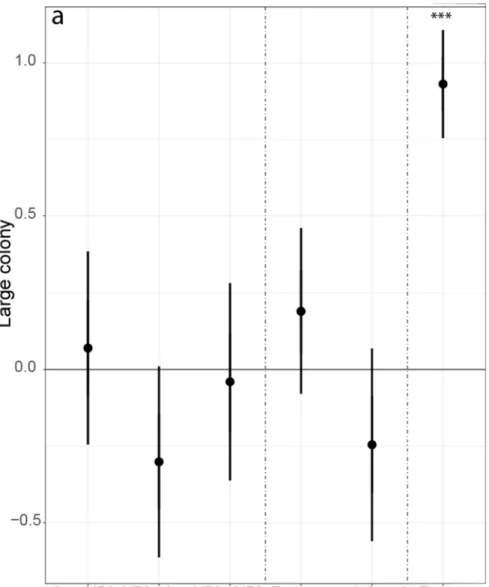
Crop rotation type was associated with abundances of bumblebees of medium colony 246
sizes (Fig. 3). Abundance of medium colony sized species was higher in cereal rollover field 247
margins, compared to MFC rollover filed margins. Both AES management types had higher 248
abundances of small-sized colony species.
249
Abundance of open land bumblebee species did not differ between crop rotation types.
250
Abundance of generalist species was higher in cereal rollover field margins, compared to 251
cereal to MFC and MFC rollover field margins (Fig. 4). Abundance of forest-scrub species 252
was higher in cereal rollover field margins compared to MFC to cereal and MFC rollover 253
field margins. Abundances of open land species and generalists did not differ between field 254
margins under AES and conventional farming. Organic field margins hosted a higher 255
abundance of forest-scrub species compared to the margins of conventional fields.
256
Abundances of short-tongued species were similar in all investigated crop rotation types 257
(Fig. S4, Supporting Information). Abundance of long-tongued species was higher in cereal 258
rollover field margins compared to the other three crop rotation types. Bumblebee abundance 259
of short-tongued species was significantly higher in environmentally friendly managed field 260
margins compared to those of conventional field margins. Abundances of long-tongued 261
bumblebee species did not differ between management types.
262 263
4. Discussion 264
Our study shows that crop rotation has an important role in determining bumblebee 265
community. We found that some bumblebee abundances (e.g. of long-tongued and threatened 266
species) are higher at cereal rollover field margins than at the field margins of the other three 267
crop rotation types. Furthermore, we found higher abundances of medium sized colony 268
species, forest-scrub species, and habitat generalists in cereal rollover field margins than in 269
MFC rollover and MFC to cereal or cereal to MFC field margins.
270 271
4.1. Concentration and dilution effects of bumblebees at field margins 272
Our study suggests that crop rotation type is an important management driver of bumblebee 273
communities in field margins. Abundances of several bumblebee groups (e.g. long-tongued, 274
threatened, and forest-scrub species) were higher at the field margins of cereal rollover 275
compared to MFC rollover. This may not indicate that the status quo of fields remaining as 276
cereals from one year to the next has a positive effect on bumblebee abundance, or that cereal 277
margins are more important to bumblebees than MFC margins.
278
Our results can be interpreted in two ways. First, this might have been caused by a 279
concentration effect in cereal field margins, similar to that found in Environmental 280
Stewardship AES in England (Carvell et al., 2007). More flower resources are available in the 281
margins of cereal fields than inside the fields, owing to herbicide use controlling arable weeds 282
within crops, thus reducing nectar sources (Brittain et al., 2010). Second, a dilution effect in 283
MFC fields (Holzschuh et al., 2011) is likely as bumblebees may disperse into MFC fields, as 284
they have more nectar resources than cereal fields. June and July, when 2/3 of our data were 285
collected, is the main blooming time of legumes and oilseed rape in Estonia. Therefore, 286
dilution of bumblebee individuals from certain trait based groups onto MFC fields was 287
probably the main reason for the differences in bumblebee abundances between cereal and 288
MFC rollover field margins. One limitation of our investigation was that it only accounted for 289
bumblebees at field margins, not within fields. An important potential confounding factor that 290
needs to be mentioned vis-à-vie the concentration–dilution hypothesis of bumblebees (and 291
other pollinators) in cereal/MFC/other field margins, is the type of crop(s) being grown in 292
adjacent fields. For example, is there a stronger concentration effect if cereal fields are on 293
both sides of the field margin, than if the margin is between a cereal and MFC field? We 294
suggest that future studies test the concentration–dilution hypothesis by: i) also running 295
flower/pollinator transects from the edge to the centre of fields; ii) taking into account 296
adjacent fields.
297
Our results suggest a negative temporal effect of cereal fields upon the food resources 298
of bumblebees. Abundances of threatened, long-tongued, and forest-scrub species were lower 299
in the field margins of MFC to cereal than cereal rollover fields. We offer the following 300
explanation: if cereals are grown for two consecutive years, this may already negatively 301
influence the flowering plant community of the field, reducing food resources for bumblebees 302
within fields, thus making margins more attractive to bumblebees. In addition, as cereal 303
rollover fields were mainly on conventional farms (Table 1), such field margins are less likely 304
to: i) have MFC dispersal into the margin from the previous year; ii) be managed (including 305
the sowing of seed mixes) for wildflowers. From a recent study (Magrach et al., 2017) it is 306
known that honeybees spillover from mass-flowering orange groves to flower-rich woodlands 307
after orange bloom leading to a change in wild bee community composition and lower seed 308
set of the most common plant species. Nevertheless, for the honeybee itself this might be a 309
benefit. In a similar way, it is possible that for at least some bumblebee species, MFC can 310
provide a benefit the following year, as suggested by our results (MFC>cereal compared to 311
cereal rollover).
312
The importance of field margins is related to nectar and/or pollen continuity in agricultural 313
landscapes (Schellhorn, Gagic & Bommarco, 2015). Owing to the seasonality and duration of 314
nectar sources, legumes and oilseed rape fields are not fully available to bees throughout 315
spring and summer in Northern Europe, thus bumblebees likely also use semi-natural habitats, 316
such as field margins (Bäckman & Tiainen, 2002; Batáry et al., 2015). Therefore, flowering 317
field margins are of high importance during periods when legumes or oilseed rape resources 318
are not available, thus creating a resource bottleneck (Persson et al., 2015; Schellhorn, Gagic 319
& Bommarco, 2015). In our study areas, a resource bottleneck might occur if MFC are not 320
grown in certain years, do not flower until a certain date, or are harvested from a certain date 321
onwards. Thus, it is highly likely that a combination of all three presented reasons affects the 322
availability of food resources for bumblebees.
323 324
4.2. AES has a role in determining the bumblebee communities of field margins 325
We found that both organic farming and environmentally friendly management promoted 326
bumblebee species richness in field margins. It might be possible that farming practice had a 327
confounding effect on the results, e.g. conventional farms had a higher percentage of cereal 328
rollover fields compared to organic and environmentally friendly management farms, but 329
owing to the lack of collinearity, a significant bias seems to be unlikely. Nonetheless, future 330
studies should aim to collect more balanced datasets. However, Marja et al. (2014), also 331
demonstrated that Estonian AES promoted bumblebees, both within the fields and at their 332
margins. Environmentally friendly management involves requirements to conserve or sow 333
field margins with a flower mix of at least three species (including graminaceous); organic 334
farming does not have such a requirement, but abundances of bumblebee threatened species, 335
small-sized colony species, and forest-scrub species were still higher than per conventional 336
farming. This was probably related to the strict management requirements (synthetic 337
pesticides and most mineral fertilizers are forbidden) of organic farming. Our results indicate 338
that threatened species are remarkably sensitive to agricultural management, and prefer more 339
AES, farms; non-threatened species seemed to be less sensitive to management.
340
We found that the abundances of species with small colonies were related to AES 341
management types, whereas abundances of species with medium and large colonies did not 342
differ between management types. These results can be related to the mobility potential.
343
Species with small colonies have more limited dispersal distances (Westphal, Steffan- 344
Dewenter & Tscharntke, 2006). This adaptation makes them more sensitive to local 345
environmental and agricultural conditions. It is also probable that there were more suitable 346
habitat conditions in organic and environmentally friendly management field margins for 347
bumblebee species with small colonies. Species with medium and large colonies are more 348
mobile and search for resources at larger scales, and are therefore less influenced by local 349
conditions.
350
351
4.3. Conservation of bumblebees 352
Both naturally-occurring plants and the sowing of seed mixes to provide nectar-rich plants 353
(e.g. clover) at field margins can benefit bumblebees and other pollinators in Estonia as well 354
as in Northern Europe in general (Scheper et al., 2013). It is important when sowing nectar- 355
rich plants mixes, to use only local flora to avoid introducing alien species. The conservation 356
of non-cropped landscape elements, such as field margins and other flower resources, is 357
essential to support the diversity of wild pollinators and their food plants. For instance, the 358
latest results from Estonia showed that field margins need to be at least 3 m wide to support 359
‘high nature value’ plant species intolerant of modern farming practices (Aavik & Liira, 360
2010). For bumblebees, these plant species are potentially of higher value and provide more 361
temporally stable food resources than agro-tolerant plant species. Thus, non-cropped field 362
margins at least 3–5 m wide could be a key and simple solution to improve bumblebee 363
diversity in cereal-dominated agricultural landscapes. Furthermore, permanent field margins 364
are important for bumblebees in terms of the continuity of resources other than food, such as 365
nesting and wintering habitat (Bäckman & Tiainen, 2002; Batáry et al., 2015).
366
A recent study showed that almost 80% of crop pollination is performed by a limited number 367
of bee species, and threatened bee species contribute little (Kleijn et al., 2015). However, 368
protecting the main, common pollinator species only is not a sustainable solution to the 369
conservation of pollinator biodiversity. Senapathi et al. (2015) highlighted that maintaining 370
whole pollinator species diversity, including widespread and rare species, is essential to 371
provide ecosystem resilience and functioning in the future. Therefore, the conservation of 372
different habitats and the whole pollinator species spectrum is crucial, because different 373
pollinator species visit different parts of crops, or crops at different times of the day or year, 374
376
5. Conclusions 377
Our results indicate that cereal field margins can act as refugia to forest-scrub, long-tongued, 378
and threatened bumblebee species, such as B. hypnorum, B. distinguendus, and B. muscorum, 379
which are vulnerable in Europe (Nieto et al., 2014). Semi-natural field margins, especially in 380
intensively managed cropland, may be a viable option to support these species in Europe, 381
because they represent permanent valuable landscape elements, offering places to nest and 382
overwinter, as well as providing food resources. It is possible that the field margin 383
requirement of Estonian AES is one of the reasons why Estonian bumblebee abundances were 384
stable over a recent five year period (Agriculture Research Centre, 2015). Our study indicated 385
a concentration–dilution effect of field margins upon bumblebee abundances, dependant on 386
the type of crop being grown in the field (cereal = concentration at the margin; MFC = 387
dilution into the field). To test the concentration–dilution hypothesis of field margins upon 388
pollinators, future studies should account for within-field pollinator/flower abundances, and 389
the influence of adjacent fields (or even landscape composition). Nonetheless, our results 390
show that management of flower rich field margins, especially in cereal rollover fields, where 391
few alternative nectar sources exist, is important and should form part of all AES targeting 392
pollinators.
393 394
Acknowledgements 395
The census work was coordinated by the Agricultural Research Centre as part of the ongoing 396
evaluation of AES within the framework of the Estonian Rural Development Plan 2007–2013, 397
financed by the European Union and Estonian government under the Technical Assistance 398
measure of the 2007–2013 Rural Development Plan of Estonia. M.M. research was partly 399
supported by Institutional Research Funding (IUT36-2) of the Estonian Ministry of 400
Education. P.B. was supported by the German Research Foundation (DFG BA4438/2-1) and 401
by the Economic Development and Innovation Operational Programme of Hungary (GINOP–
402
2.3.2–15–2016–00019). The authors are thankful to Katrin Jõgar, Martin Jürgenson, Reet 403
Karise, Irja Kivimägi, Eha Kruus, Reelika Päädam, Eve Veromann, Kai-Riin Veromann, 404
Linda-Liisa Veromann-Jürgenson, and Peeter Veromann for their help in conducting the 405
fieldwork.
406 407
Authors' Contributions 408
RM and PB conceived the study and designed the methodology; EV and MM coordinated 409
data collection; RM analysed the data; RM led the writing of the manuscript. All authors 410
(RM, EV, MM, JP, AMK, and PB) contributed critically to the manuscript and approved the 411
submission.
412 413
Data accessibility 414
Data availability. The biodiversity and environmental data used in the analyses are archived at 415
the research data repository Zenodo (https://zenodo.org/record/1161431).
416 417
References 418
Aavik, T., & Liira, J. (2010) Quantifying the effect of organic farming, field boundary type 419
and landscape structure on the vegetation of field boundaries. Agriculture, Ecosystems 420
and Environment, 135, 178–186.
421
Agricultural Research Centre. (2015) Estonian Rural Development Plan 2007-2013 annual 422
report of axis 2 ongoing evaluation activities in 2014. Saku, Estonia. (in Estonian).
423
Bäckman, J.-P. C., & Tiainen, J. (2002) Habitat quality of field margins in a Finnish farmland 424
area of bumblebees (Hymenoptera: Bombus and Psithyrus). Agriculture, Ecosystems &
425
Environment, 89, 53–68.
426
Batáry, P., Dicks, L.V., Kleijn, D., & Sutherland, W.J. (2015) The role of agri-environment 427
schemes in conservation and environmental management. Conservation Biology, 29, 428
1006–1016.
429
Bates, D., Maechler M., Bolker, B., Walker, S., Bojesen, R.H.C.,Singmann, H., … Green, P.
430
(2016) Package lme4: Linear Mixed-Effects Models using 'Eigen' and S4. URL:
431
https://cran.r-project.org/web/packages/lme4/lme4.pdf 432
Blüthgen, N., & Klein, A.-M. (2011) Functional complementarity and specialisation: the role 433
of biodiversity in plant–pollinator interactions. Basic and Applied Ecology, 12, 282–
434
291.
435
Bommarco, R., Lundin, O., Smith, H.G., & Rundlöf, M. (2012) Drastic historic shifts in 436
bumble-bee community composition in Sweden. Proceedings of the Royal Society of 437
London B, 279, 309–315.
438
Brittain, C.A., Vighi, M., Bommarco, R., Settele, J., & Potts, S.G. (2010) Impacts of a 439
pesticide on pollinator species richness at different spatial scales. Basic and Applied 440
Ecology, 11, 106–115.
441
Carvell, C., Meek, W.R., Pywell, R.F., Goulson, D., & Nowakowski, M. (2007) Comparing 442
the efficacy of agri-environment schemes to enhance bumble bee abundance and 443
diversity on arable field margins. Journal of Applied Ecology, 44, 29–40.
444
Carvell, C., Bourke, A.F.G., Osborne, J.L., & Heard, M.S. (2015) Effects of an agri- 445
environment scheme on bumblebee reproduction at local and landscape scales. Basic 446
and Applied Ecology, 16, 519-530.
447
Fox, J., & Weisberg, S. (2011) Companion to Applied Regression, Second Edition. Thousand 448
Oaks CA: Sage. URL: http://socserv.socsci.mcmaster.ca/jfox/Books/Companion.
449
Goulson, D. (2010) Bumblebees. Behaviour, ecology and conservation. Second edition.
450
Oxford University Press.
451
Goulson, D., Lye, G.C. & Darvill, B. (2008) Decline and conservation of bumble bees.
452
Annual Review of Entomology, 53, 191–208.
453
Goulson, D., Nicholls, E., Botias, C., & Rotheray, E. (2015) Bee declines driven by combined 454
stress from parasites, pesticides, and lack of flowers. Science, 347, 1435–1443.
455
Hole, D.G., Perkins, A.J., Wilson, J.D., Alexander, I.H., Grice, F., & Evans, A.D. (2005) 456
Does organic farming benefit biodiversity? Biological Conservation, 122, 113–130.
457
Holzschuh, A., Dormann, C.F., Tscharntke, T., & Steffan-Dewenter, I. (2011) Expansion of 458
mass-flowering crops leads to transient pollinator dilution and reduced wild plant 459
pollination. Proceedings of the Royal Society of London B, 278, 3444–3451.
460
IPBES. (2016) Summary for policymakers of the assessment report of the Intergovernmental 461
Science-Policy Platform on Biodiversity and Ecosystem Services on pollinators, 462
pollination and food production.
463
Klein, A.-M., Vaissiere, B., Cane, J.H., Steffan-Dewenter, I., Cunningham, S.A., Kremen, C., 464
& Tscharntke, T. (2007) Importance of crop pollinators in changing landscapes for 465
Kleijn, D., Rundlöf, M., Scheper, J., Smith, H.G., & Tscharntke, T. (2011) Does conservation 467
on farmland contribute to halting the biodiversity decline? Trends in Ecology and 468
Evolution, 26, 474–481.
469
Kleijn, D., Winfree, R., Bartomeus, I., Carvalheiro, L.G., Henry, M., Isaacs, R.,… Potts, S.G.
470
(2015) Delivery of crop pollination services is an insufficient argument for wild 471
pollinator conservation. Nature Communications, 6, 7414.
472
Kremen, C., Williams, N.M., Aizen, M.A., Gemmill-Herren, B., LeBuhn, G., Minckley, R., 473
… Ricketts, T.H. (2007) Pollination and other ecosystem services produced by mobile 474
organisms: a conceptual framework for the effects of land-use change. Ecology Letters, 475
10, 299–314.
476
Magrach, A., González-Varo, J.P., Boiffier, M., Vilà, M., & Bartomeus, I. (2017) Honeybee 477
spillover reshuffles pollinator diets and affects plant reproductive success. Nature 478
Ecology & Evolution. doi:10.1038/s41559-017-0249-9.
479
Marja, R., Herzon, I., Viik, E., Elts, J., Mänd, M., Tscharntke, T., & Batáry, P. (2014) 480
Environmentally friendly management as an intermediate strategy between organic and 481
conventional agriculture to support biodiversity. Biological Conservation, 178, 146–
482
154.
483
Nieto, A., Roberts, S.P.M., Kemp, J., Rasmont, P., Kuhlmann, M., García Criado, M., … 484
Miches, D. (2014) European Red List of bees. Luxembourg: Publication Office of the 485
European Union.
486
Persson, A.S., Rundlöf, M., Clough, Y., & Smith, H.G. (2015) Bumble bees show trait- 487
dependent vulnerability to landscape simplification. Biodiversity and Conservation, 24, 488
3469–3489.
489
Potts, S.G., Biesmeijer, J.C., Kremen, C., Neumann, P., Schweiger, O., & Kunin, W.E. (2010) 490
Global pollinator declines: trends, impacts and drivers. Trends in Ecology and 491
Evolution, 25, 345–353.
492
Potts, S.G., Imperatriz-Fonseca, V., Ngo, H.T., Aizen, M.A., Biesmeijer, J.C., Breeze, T.D., 493
& Vanbergen, A.J. (2016). Safeguarding pollinators and their values to human well- 494
being. Nature, 540, 220–229.
495
R Development Core Team. (2016) R: A language and environment for statistical computing.
496
R Foundation for Statistical Computing, Vienna, Austria. ISBN 3-900051-07-0, URL:
497
http://www.R-project.org 498
Schellhorn, N.A., Gagic, V., & Bommarco, R. (2015) Time will tell: resource continuity 499
bolsters ecosystem services. Trends in Ecology and Evolution, 30, 524–530.
500
Scheper, J., Holzschuh, A., Kuussaari, M., Potts, S.G., Rundlöf, M., Smith, H.G., & Kleijn, D.
501
(2013) Environmental factors driving the effectiveness of European agri-environmental 502
measures in mitigating pollinator loss – a meta-analysis. Ecology Letters, 16, 912–920 503
Senapathi, D., Biesmeijer, J.C., Breeze, T.D., Kleijn, D., Potts, S.G., & Carvalheiro, L.G.
504
(2015) Pollinator conservation – the difference between managing for pollination 505
services and preserving pollinator diversity. Current Opinion in Insect Science, 12, 93–
506
101.
507
Sutcliffe, L., Batáry, P., Kormann, U., Báldi, A., Dicks, L., Herzon, I., … Tscharntke, T.
508
(2015) Harnessing the biodiversity value of Central and Eastern European farmland.
509
Diversity and Distributions, 21, 722–730.
510
Tscharntke, T., Klein, A.-M., Kruess, A., Steffan-Dewenter, I., & Thies, C. (2005) Landscape 511
perspectives on agricultural intensification and biodiversity-ecosystem service 512
management. Ecology Letters, 8, 857–874.
513
Tscharntke, T., Tylianaskis, J.M., Rand, T.A., Didham, R.K., Fahrig, L., Batáry, P., … 514
Westphal, C. (2012) Landscape moderation of biodiversity patterns and processes–eight 515
hypotheses. Biological Reviews, 87, 661–685.
516
Westphal, C., Steffan-Dewenter, I., & Tscharntke, T. (2003) Mass flowering crops enhance 517
pollinator densities at a landscape scale. Ecology Letters, 11, 961–965.
518
Westphal, C., Steffan-Dewenter, I., & Tscharntke, T. (2006) Bumblebees experience 519
landscapes at different spatial scales: possible implications for coexistence. Oecologia, 520
149, 289–300.
521
Williams, N.M., Ward, K.L., Pope, N., Isaacs, R., Wilson, J. & May, E.A., … Peters, J.
522
(2015) Native wildflower plantings support wild bee abundance and diversity in 523
agricultural landscapes across the United States. Ecological Applications, 25, 2119–
524
2131.
525
Williams, P.H., & Osborne J.L. (2009) Bumblebee vulnerability and conservation world- 526
wide. Apidologie, 40, 367–387.
527
Winfree, R., Aguilar, R., Vazquez, D.P., LeBuhn, G., & Aizen, M.A. (2009) A meta-analysis 528
of bees’ responses to anthropogenic disturbance. Ecology, 90, 2068–2076.
529
Wood, T.J., Holland, J.M., & Goulson, D. (2015) A comparison of techniques for assessing 530
farmland bumblebee populations. Oecologia, 177, 1093–1102.
531
Wood, T.J., Holland, J.M., Hughes, W.O.H., & Goulson, D. (2015) Targeted agri- 532
environment schemes significantly improve the population size of common farmland 533
bumblebee species. Molecular Ecology, 24, 1668–1680.
534
Table captions 535
536
Table 1 Cross-table of sample sizes by crop rotation and management types. Cereal (all rye, 537
oat, barley, triticale, and wheat fields), MFC = mass-flowering crops (pea, bean, clover, 538
alfalfa, sweet clover species, and oilseed rape).
539
Management type/
Crop rotation
Conventional farming
Environmentally friendly management
Organic farming
Crop rotation total
Cereal→cereal 86 22 9 117
Cereal→MFC 17 46 24 87
MFC→cereal 28 36 19 83
MFC→MFC 17 31 66 114
Management type total 148 135 118 401
540 541 542
Figure captions 543
Fig. 1. Comparison of flower cover in field margins between different crop rotation and 544
management types. The figure shows results from linear mixed-effects models (p-value, lower 545
and upper boundary of 95% CI). Indicated are effect sizes (y-axis) compared to the crop 546
rotation type control group (cereal rollover field margins) and management type control group 547
(conventional farming). The effect size is significantly different if the CIs do not overlap with 548
zero. Asterisk symbols represent statistically significant p-values below 0.05, 0.01, and 0.001 549
(*, **, and ***, respectively). Cer = cereals (all rye, oat, barley, triticale, and wheat fields), 550
MFC = mass flowering crops (pea, bean, clover, alfalfa, sweet clover species, and oilseed 551
rape), Environmental = environmentally friendly management, Organic = organic farming.
552 553 554
Fig. 2. Comparison of bumblebee abundances in field margins between different crop rotation 555
types, management types, and effect of flower cover for (a) non-threatened and (b) threatened 556
bumblebee species. The figure shows results from linear mixed-effects models (p-value, 557
lower and upper boundary of 95% CI). Indicated are effect sizes (y-axis) compared to the crop 558
rotation type control group (cereal rollover field margins) and management type control group 559
(conventional farming). The effect size is significantly different if the CIs do not overlap with 560
zero. Asterisk symbols represent statistically significant p-values below 0.05, 0.01, and 0.001 561
(*, **, and ***, respectively). Cer = cereals (all rye, oat, barley, triticale, and wheat fields), 562
MFC = mass flowering crops (pea, bean, clover, alfalfa, sweet clover species, and oilseed 563
rape), Environmental = environmentally friendly management, Organic = organic farming, 564
Flowers = flower cover.
565 566 567
Fig. 3. Comparison of bumblebee abundances in field margins between different crop rotation 568
types, management types, and effect of flower cover for species based on their colony size, 569
i.e. (a) large, (b) medium and (c) small colonies. The figure shows results from linear mixed- 570
effects models (p-value, lower and upper boundary of 95% CI). Indicated are effect sizes (y- 571
axis) compared to the crop rotation type control group (cereal rollover field margins) and 572
management type control group (conventional farming). The effect size is significantly 573
different if the CIs do not overlap with zero. Asterisk symbols represent statistically 574
significant p-values below 0.05, 0.01, and 0.001 (*, ** and, ***, respectively). Cer = cereals 575
(all rye, oat, barley, triticale, and wheat fields), MFC = mass flowering crops (pea, bean, 576
clover, alfalfa, sweet clover species, and oilseed rape), Environmental = environmentally 577
friendly management, Organic = organic farming, Flowers = flower cover.
578 579
Fig. 4. Comparison of bumblebee abundances in field margins between different crop rotation 580
types, management types, and effect of flower cover for species based on their habitat 581
preference, i.e. (a) open land, (b) generalists, and (c) forest-scrub. The figure shows results 582
from linear mixed-effects models (p-value, lower and upper boundary of 95% CI). Indicated 583
are effect sizes (y-axis) compared to the crop rotation type control group (cereal rollover field 584
margins) and management type control group (conventional farming). The effect size is 585
significantly different if the CIs do not overlap with zero. Asterisk symbols represent 586
statistically significant p-values below 0.05, 0.01, and 0.001 (*, ** and, *** respectively). Cer 587
= cereals (all rye, oat, barley, triticale, and wheat fields), MFC = mass flowering crops (pea, 588
bean, clover, alfalfa, sweet clover species, and oilseed rape), Environmental = 589
environmentally friendly management, Organic = organic farming, Flowers = flower cover.
590
Supporting Information 591
592
Table S1. Requirements of conventional farming and the two agri-environment schemes.
593 594
Table S2. Flowering plant species known to be used by bumblebees for foraging.
595 596
Table S3. Bumblebee species’ traits based on tongue length, threat status, colony size and 597
main habitat type.
598 599
Table S4. Investigated plant and bumblebee variables depending on crop rotation type (mean 600
values and standard error of mean).
601 602
Table S5. Investigated plant and bumblebee variables depending on management type (mean 603
values and standard error of mean).
604 605
Figure S1. Illustrative photos of field margins.
606 607
Figure S2. Study areas in the two regions of Northern and Southern Estonia.
608 609
Figure S3. Comparisons of bumblebee species richness and abundance in field margins 610
between different crop rotation types, management types, and effect of flower cover.
611 612
Figure S4. Comparisons of bumblebee abundance of short- and long-tongued bumblebee 613
species in field margins between different crop rotation types, management types, and effect 614
of flower cover.
615
Fig. 1. Comparison of flower cover in field margins between different crop rotation and management types.
The figure shows results from linear mixed-effects models (p-value, lower and upper boundary of 95% CI).
Indicated are effect sizes (y-axis) compared to the crop rotation type control group (cereal rollover field margins) and management type control group (conventional farming). The effect size is significantly different if the CIs do not overlap with zero. Asterisk symbols represent statistically significant p-values below 0.05, 0.01, and 0.001 (*, **, and ***, respectively). Cer = cereals (all rye, oat, barley, triticale, and
wheat fields), MFC = mass flowering crops (pea, bean, clover, alfalfa, sweet clover species, and oilseed rape), Environmental = environmentally friendly management, Organic = organic farming.
225x279mm (90 x 90 DPI)
Fig. 2. Comparison of bumblebee abundances in field margins between different crop rotation types, management types, and effect of flower cover for (a) non-threatened and (b) threatened bumblebee species. The figure shows results from linear mixed-effects models (p-value, lower and upper boundary of 95% CI). Indicated are effect sizes (y-axis) compared to the crop rotation type control group (cereal rollover
field margins) and management type control group (conventional farming). The effect size is significantly different if the CIs do not overlap with zero. Asterisk symbols represent statistically significant p-values below 0.05, 0.01, and 0.001 (*, **, and ***, respectively). Cer = cereals (all rye, oat, barley, triticale, and
wheat fields), MFC = mass flowering crops (pea, bean, clover, alfalfa, sweet clover species, and oilseed rape), Environmental = environmentally friendly management, Organic = organic farming, Flowers = flower
cover.
253x279mm (90 x 90 DPI)
Figure 2 B
253x279mm (90 x 90 DPI)
Fig. 3. Comparison of bumblebee abundances in field margins between different crop rotation types, management types, and effect of flower cover for species based on their colony size, i.e. (a) large, (b) medium and (c) small colonies. The figure shows results from linear mixed-effects models (p-value, lower
and upper boundary of 95% CI). Indicated are effect sizes (y-axis) compared to the crop rotation type control group (cereal rollover field margins) and management type control group (conventional farming).
The effect size is significantly different if the CIs do not overlap with zero. Asterisk symbols represent statistically significant p-values below 0.05, 0.01, and 0.001 (*, ** and, ***, respectively). Cer = cereals
(all rye, oat, barley, triticale, and wheat fields), MFC = mass flowering crops (pea, bean, clover, alfalfa, sweet clover species, and oilseed rape), Environmental = environmentally friendly management, Organic =
organic farming, Flowers = flower cover.
253x279mm (90 x 90 DPI)
Figure 3 b
253x279mm (90 x 90 DPI)
Figure 3 c
253x279mm (90 x 90 DPI)
Fig. 4. Comparison of bumblebee abundances in field margins between different crop rotation types, management types, and effect of flower cover for species based on their habitat preference, i.e. (a) open
land, (b) generalists, and (c) forest-scrub. The figure shows results from linear mixed-effects models (p- value, lower and upper boundary of 95% CI). Indicated are effect sizes (y-axis) compared to the crop rotation type control group (cereal rollover field margins) and management type control group (conventional
farming). The effect size is significantly different if the CIs do not overlap with zero. Asterisk symbols represent statistically significant p-values below 0.05, 0.01, and 0.001 (*, ** and, *** respectively). Cer =
cereals (all rye, oat, barley, triticale, and wheat fields), MFC = mass flowering crops (pea, bean, clover, alfalfa, sweet clover species, and oilseed rape), Environmental = environmentally friendly management,
Organic = organic farming, Flowers = flower cover.
253x279mm (90 x 90 DPI)
Figure 4 b
253x279mm (90 x 90 DPI)
Figure 4 c
253x279mm (90 x 90 DPI)
Crop rotation and agri-environment schemes determine bumblebee communities via flower resources
Riho Marja, Eneli Viik, Marika Mänd, James Phillips, Alexandra-Maria Klein, Péter Batáry
SUPPORTING INFORMATION
Table S1. Requirements of conventional farming (single area payment scheme) and two agri-environment schemes (environmentally friendly management, and organic farming), of the Estonian Rural Development Plan 2007–2013 (Estonian Rural Development Plan 2007–2013, 2010).
Management type Pre-requisites of applying for support Baseline requirements for obtaining agri- environment support
Additional requirements for obtaining agri-environment support, specific to each scheme
Conventional farming
Cross-Compliance requirements.
Minimum 1 ha of agricultural land entered into the register of agricultural support and agricultural parcels.
Environmentally friendly management
Cross-Compliance requirements.
Minimum requirements for the application of fertilizers and plant protection products.
Self-employed person engaged in agriculture or a legal person.
Minimum 1 ha of arable land entered into the register of agricultural support and agricultural parcels (permanent grassland is not eligible).
5-year obligation.
Keeping a field book.
Compiling a cropping or crop rotation plan.
Plant protection equipment have to pass a technical inspection after every three years.
Agricultural crops are sown or planted by the 15th of June (spread of weeds avoided) or the agricultural land is kept as black fallow.
In certain parishes, at least 30% of the
agricultural land must remain under winter cover.
Restrictions on using nitrogen.
In certain cases, there have to be a grassland strip of at least 0.5 meters or another kind of
landscape border element between the road and
Basic scheme requirements:
Compiling a standard fertilization plan.
Requirement of a cropping or crop rotation plan (e.g. 1st November to 31st March at least 30% under winter vegetation).
At least 15% of agricultural crops sown with certified seed.
Collection of soil samples once during the obligation period, and in the case of manure storage facilities, manure samples.
To leave or establish a 2-5 m wide grassland strip with perennial vegetation or other kind of landscape element between the field and public road if the arable land area is larger than 20 ha (also some more detailed requirements).
Cultural heritage sites and other valuable landscape elements
field.
Valuable landscape elements cannot be damaged or destroyed.
Compulsory training (6+6 hours).
cannot be damaged or destroyed.
Basic + additional scheme requirements:
Basic scheme requirements.
At least 15% of the eligible land is under leguminous crops.
The application of glyphosates is prohibited from the time of the emergence of cultivated plants until harvesting. It is also prohibited on grasslands used as green manures.
Plant growth regulators can only be used in case of growing winter cereals.
Black fallow is prohibited.
The amount of nitrogen fertilization is restricted.
Organic farming Cross compliance requirements.
Minimum requirements for the usage of fertilizers and plant protection products.
Self-employed person engaged in agriculture or a legal person.
Minimum 1 ha of agricultural land entered into the register of agricultural support and agricultural parcels.
The enterprise must be approved according to the Organic Farming Act.
To follow the Organic Farming Act.
5-year obligation.
Keeping a field book.
Agricultural crops are sown or planted by 15th of June (spread of weeds avoided) or the
agricultural land is kept as black fallow.
Grasslands and orchards must be mowed once or grazed before 31st July and mowed grass removed or chopped.
Destruction or spoiling of natural protected objects is prohibited.
Damaging of semi-natural habitats is prohibited.
Compulsory training (12+12 hours).
Requirements for organic plant production and for organic animal husbandry.
Estonian Rural Development Plan 2007–2013 (2010. URL: http://www.agri.ee/mak).
Table S2. Flowering plant species known to be used by bumblebees for foraging in Estonian agricultural landscapes based on our 2014 unpublished survey.
Plant species Plant species Plant species
Aegopodium podagraria Galopsis tetrahit Symphytum officinale Anchusa arvensis Geranium pratense Trifolium hybridum
Anchusa officinalis Hieracium spp Trifolium medium
Arctium lappa Hypericum maculatum Trifolium pratense
Arctium minus Hypericum perforatum Trifolium repens Arctium tomentosum Knautia arvensis Veronica longifolia
Bunias orientalis Lamium album Vicia cracca
Campanula cervicaria Lamium hybridum Vicia sepium Campanula glomerata Lamium purpureum Vicia villosa Campanula latifolia Lathyrus pratensis
Campanula medium Linaria vulgaris Campanula persicifolia Lonicera xylosteum Campanula rapunculoides Lotus corniculatus Capsella bursa bastoris Lupinus polyphyllus Carduus crispus Lythrum salicaria Centaurea cyanus Medicago lupulina
Centaurea jacea Medicago sativa
Centaurea phrygia Medicago varia Centaurea scabiosa Melampyrum nemorosum
Cirsium arvense Melilotus albus
Cirsium heterophyllum Mentha arvensis Cirsium palustre Odontites serotina Consolida regalis Odontites verna
Echium vulgare Origanum vulgare
Epilobium angustifolium Phacelia tanacetifolia
Fragaria vesca Rubus idaeus
Galega orientalis Silene alba Galeopsis bifida Silene vulgaris Galeopsis speciosa Sonchus oleraceus Galeopsis tetrahit Stachys palustris
Galium album Symphytum asperum