Assessing Grain Yield and Quality Traits Stability of Spring Wheat Cultivars at Different Crop Management Levels
M. Studnicki1*, M. Wijata2, G. SobczyńSki2, S. SaMborSki2 and j. rozbicki2
1Department of Experimental Design and Bioinformatics, Warsaw University of Life Sciences Nowoursynowska 159, 02-776 Warsaw, Poland
2Department of Agronomy, Warsaw University of Life Sciences, Nowoursynowska 159, 02-776 Warsaw, Poland (Received 7 February 2017; Accepted 14 August 2017;
Communicated by T. Harangozó and X.F. Zhang)
Eleven spring wheat cultivars were compared in terms of the stability of their grain yield and grain quality. The cultivars’ stability was evaluated separately at two different crop management levels – moderate-input management and high-input management. Three sta- bility models were used for the two crop management levels based on a linear mixed model framework with restricted maximum likelihood. The Shukla model was the most appropriate for the evaluation of stability of tested spring wheat cultivars. The thousand-grain weight, starch content, Zeleny sedimentation value and test weight were characterized, and the sta- bility ranking cultivars at moderate-input management level was mostly consistent with the rank of cultivars 24 for high-input management level. For grain yield, grain protein content and wet gluten content, the stability rankings were not consistent. Cultivars ‘Monsun’ and
‘Parabola’ are the most stable cultivars for grain yield in moderate-input management and high-input management, respectively. Cultivar ‘Hewilla’ was the stable cultivar for all qual- ity traits at moderate-input management. Cultivar ‘Arabella’ was the most stable cultivar at high-input management level.
Keywords: genotype-environment interaction, quality traits, spring wheat, stability parameters
Introduction
Wheat grain yield and quality traits depend to varying degrees on genotype (G), environ- ment (E), and G × E interaction effects. Grain yield is strongly influenced by environmen- tal effects. Environmental effects (location, year and appropriate interactions) can explain up to 90% of the grain yield variation (De Vita et al. 2010; Anderson et al. 2011). Grain hardness and Zeleny sedimentation value are highly determined by genetic factors, while protein content, test weight and Hagberg falling number are mostly controlled by the en- vironment (Mikulikova et al. 2009; Kong et al. 2013).
Grain yield, as well as many grain quality traits, e.g. protein content and test weight, is influenced by the environment and by G × E interactions, resulting in the instability of
*Corresponding author; E-mail: marcin_studnicki@sggw.pl
grain yield and grain quality. Cultivar stability is an important attribute for breeders and end-users of wheat grain (Altay 2012; Denčić et al. 2012) because of potentially high variability in grain yield and quality across different environmental conditions. Raw ma- terials (grains and flour) with good stability in quality, also known as economic stability (Robert and Denis 1996), are needed for industrial purposes. The modern baking industry requires a high level of uniformity in wheat grain to avoid process modification and prod- uct loss during processing (Finlay et al. 2007; Mut et al. 2010). The primary objective of the breeders is looking for cultivars not only stable but having good values of yield and quality traits. The cultivars with stable and good value of considered traits often are called wide adapted cultivars. Therefore, it is important to find cultivars with high stability that are widely adapted to various environmental conditions. The evaluation of the cultivars stability was based on trials at a number of locations and several years (called multi-envi- ronment trials – MET). The METs play an important role in plant breeding programs and in cultivars recommendation to growers.
The stability of grain yield and grain quality may also be modified by crop manage- ment (M) practices (e.g. sowing time, fertilizer rate and weed control strategy). The influ- ence of crop management on grain quality traits is still poorly understood. The same cultivar at different management levels may be characterised by different stability.
In addition to G × E interaction, G × M and G × E × M interactions can also affect the performance of cultivars across environments. There is a lack of comprehensive studies on the effect of the above interactions on the stability of grain yield and grain quality traits in spring wheat (Triticum aestivum L.). Therefore, the objective of this study was to eval- uate the stability of grain yield and grain quality in 11 spring wheat cultivars grown using two different levels of crop management across fourteen environments (7 locations and 2 years combination).
Materials and Methods Field experiments and traits
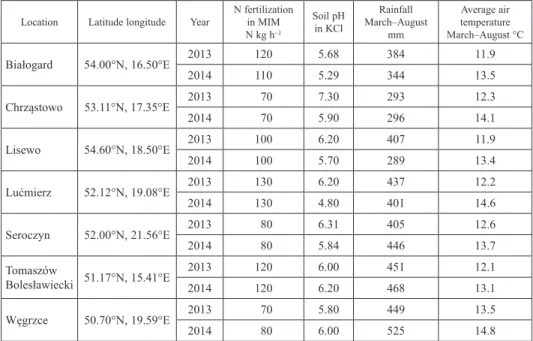
Grain yield and quality data of eleven spring wheat cultivars were gathered in seven loca- tions (Table 1) within the Polish Post-Registration Variety Testing System (PVTS) during two years – 2013 and 2014. These locations were chosen to represent different agro- ecological conditions for spring wheat cultivation across Poland. The eleven spring wheat cultivars represent the genetic variation of agronomic attributes in advanced spring wheat germplasm from different European countries (Table S1*). All eleven spring wheat culti- vars were grown at two levels of inputs, i.e. moderate-input management (MIM) and conventional, high-input management (HIM). MIM did not include any plant protection treatments. Standard fertilization of nitrogen was applied to each site according to its soil fertility needs (Table 1). HIM consisted of treatments designed to maximize grain yield, i.e. high rates of nitrogen fertilization (40 kg N ha–1 more than standard fertilization in MIM) combined with frequent fungicide use, foliar fertilization and the application of a
*Further details about the Electronic Supplementary Material (ESM) can be found at the end of the article.
growth regulator. In each location and year, individual trials were established as a two- factorial (cultivar and crop management) strip-block design with two replicates. Individ- ual plots measured 1.5 by 10 m. Grain protein content (GPC), Zeleny sedimentation value (SV), wet gluten content (WGC), starch content (SC) and test weight (TW) were meas- ured by near-infrared spectroscopy (NIR) using a FOSS InfratecTM 1241 (Chen et al.
2017; Hruskova and Famera 2003; Mutlu et al. 2011). The calibration of NIR models was verified using traditional methods by examining 60 sample of each tested traits (accord- ing to the reference ISO and AACC 2015 methods).
The NIR approaches are fast and non-destructive methods (Osborne 2006) and have been used as scanning to obtain highly accurate measurements of the chemical composi- tion of rice grains (Natsuga and Kawamura 2006). Now it is used routinely at elevators and mills for the determination of protein and moisture content in cereals (Pettersson and Åberg 2003).
Statistical analysis
The analysis of grain yield and grain quality traits obtained in this strip-block design was performed using a linear mixed model (Möhring and Piepho 2009). The best linear unbi- ased predictors (BLUP) of adjusted means for cultivar-management combinations were estimated. Three stability parameters were fitted for the two crop management levels separately based on the adjusted means. All stability parameters were fitted to a linear mixed model framework with restricted maximum likelihood method (REML). Shukla’s
Table 1. Agronomic and weather conditions and soil characteristics at the experimental sites Location Latitude longitude Year N fertilization
in MIM N kg h–1
Soil pH in KCl
Rainfall March–August
mm
Average air temperature March–August °C
Białogard 54.00°N, 16.50°E 2013 120 5.68 384 11.9
2014 110 5.29 344 13.5
Chrząstowo 53.11°N, 17.35°E 2013 70 7.30 293 12.3
2014 70 5.90 296 14.1
Lisewo 54.60°N, 18.50°E 2013 100 6.20 407 11.9
2014 100 5.70 289 13.4
Lućmierz 52.12°N, 19.08°E 2013 130 6.20 437 12.2
2014 130 4.80 401 14.6
Seroczyn 52.00°N, 21.56°E 2013 80 6.31 405 12.6
2014 80 5.84 446 13.7
Tomaszów
Bolesławiecki 51.17°N, 15.41°E 2013 120 6.00 451 12.1
2014 120 6.20 468 13.1
Węgrzce 50.70°N, 19.59°E 2013 70 5.80 449 13.5
2014 80 6.00 525 14.8
stability variance for individual cultivars was estimated with the following model (Müh- leisen et al. 2014; Piepho et al. 2016):
yij = μ + gi + vj + fij,
where yij is the mean of the ith genotype in the jth environment (location and years com- binations), μ – the general mean, gi – the fixed main effect of the ith genotype, vj – the random main effect of the jth environment confounded with the replicate effects, and fij – the random interaction effect of the ith genotype and the jth environment confounded with the residual effects. In this case, the G × E interaction variance was specific for each cultivar while the stability variance of ith cultivar. This corresponds to the Banded Main Diagonal structure of the variance-covariance matrix (Hu and Spilke 2011). This struc- ture is another extension of the compound symmetry model (Raman et al. 2011; Hu et al.
2014).
The Finlay–Wilkinson regression model for linear mixed model framework can be written in the following way (Mühleisen et al. 2014):
yij = μ + gi + λiwj + fij,
where λi is the slope of the ith genotype and wj – a latent variable of the jth environment.
The λi in the Finlay–Wilkinson model correspond to the equal-diagonal factor analytic covariance structure with first components (Hu and Spilke 2011).
The next stability parameter was based on the Eberhart–Russell model. This model differs from Finlay–Wilkinson as the deviation of interaction effect fij has a separate vari- ance for each genotype. The Eberhart–Russell model corresponds to the first-order factor analytic variance-covariance structure in LMM. For the evaluation of the stability of grain yield and grain quality in the Finlay–Wilkinson and Eberhart–Russell models, we used λi.
The considerate stability models were commonly and efficiently used by breeders and researchers for many fields crop species. The Shukla’s stability model, Finlay–Wilkinson model and Eberhart–Russell model were easily accessible through the linear mixed mod- el with REML methods (Piepho 1999). For the comparison and selection of an appropri- ate stability model, the Akaike Information Criterion (AIC) was used (Raman et al. 2011;
Hu et al. 2014). The model with the smaller AIC has the better fit to data and was the most appropriate for the evaluation of cultivars stability. The AIC imposes a penalty for the number of parameters in the models, leading to preference for simpler models with fewer parameters – (Sixto et al. 2014). Estimations of adjusted means and stability parameters for the study traits were performed using the PROC MIXED in SAS 9.4.
Results
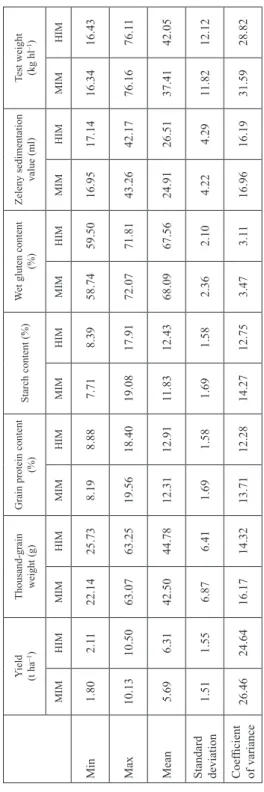
As expected, the grain yield and study grain quality traits were affected by the crop man- agements intensity (Table 2). For the HIM we observed highest grain yield and most of quality traits except WGC. The study traits characterized high variability, the coefficients of variance in most cases was above 15%. Only the WGC in both crop managements has
Table 2. Basic statistical parameters for grain yield and study grain quality traits for two crop management in spring wheat Yield (t ha–1)Thousand-grain weight (g)Grain protein content (%)Starch content (%)Wet gluten content (%)Zeleny sedimentation value (ml)Test weight (kg hl–1) MIMHIMMIMHIMMIMHIMMIMHIMMIMHIMMIMHIMMIMHIM Min1.802.1122.1425.738.198.887.718.3958.7459.5016.9517.1416.3416.43 Max10.1310.5063.0763.2519.5618.4019.0817.9172.0771.8143.2642.1776.1676.11 Mean5.696.3142.5044.7812.3112.9111.8312.4368.0967.5624.9126.5137.4142.05
Standard deviation
1.511.556.876.411.691.581.691.582.362.104.224.2911.8212.12 Coefficient of variance26.4624.6416.1714.3213.7112.2814.2712.753.473.1116.9616.1931.5928.82 MIM – moderate-input crop management; HIM – high-input crop management.
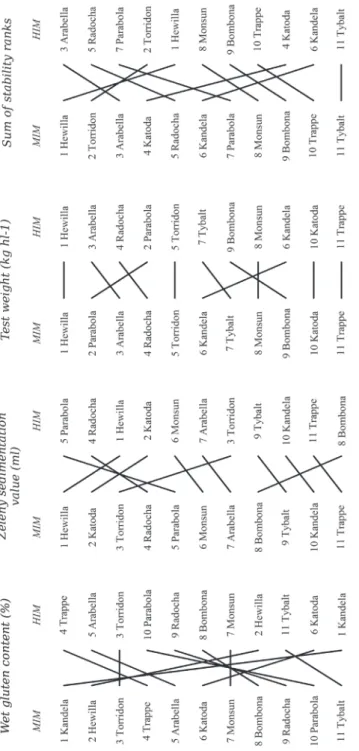
Figure 1. Comparison of cultivar stability rankings based on the Shukla stability variance between moderate-input and high-input crop management for grain yield and quality traits in spring wheat
low variability (CV% – above 3%). In all tested trials, at both crop management levels, the Shukla model had the smallest AIC value among the three tested models (Table S2).
This allowed us to choose the Shukla model as the most appropriate for the evaluation of stability of grain yield and grain quality in the fourteen environments (7 locations and 2 years combination) with spring wheat cultivars. The other two considered models had higher values for AIC then the Shukla model and therefore they models are less appropri- ate for stability evaluation. Ultimately, the Shukla model was used to assess the stability of cultivars for grain yield and quality traits.
The consistency of the cultivar stability rankings under the two crop management lev- els was assessed using the Spearman correlation coefficient. This approach allows us to examine whether the two stability rankings of cultivars under MIM and HIM were simi- lar. Strong positive correlations indicate a high compliance of cultivars stability rankings.
Significant (α = 0.05) and positive values of the Spearman correlation coefficients were observed for TGW, SC, SV and TW. SC was the most consistently ranked (r = 0.98) be- tween MIM and HIM crop management systems of the four examined quality traits. In contrast, the other studied traits (GY, GPC and WGC) were characterized by insignificant the Spearman correlation coefficients. The insignificant correlation coefficients indicated non-consistency stability ranking between two crop management systems. We do not observe the significant and negative Spearman correlation coefficients, what might prove that traits do not have a diverse ranking of cultivars’ stability between MIM and HIM.
For GY, cv. ‘Monsun’ had the lowest stability variance, and hence maximum stability (Fig. 1), under MIM, while under HIM, this cultivar had only average GY stability, plac- ing 5th. Unfortunately, this cultivar, when grown under MIM, was characterized by an average grain yield of only 5.8 t ha–1 (Table S3). Cultivar ‘Parabola’ was the first best cultivar in the stability rank when grown under HIM. However, the same cultivar grown under MIM was characterized by the above average stability, ranking 4th. However, cv.
‘Parabola’ was characterized by an average grain yield in both study crop managements (5.8 t ha–1 for MIM, 6.3 t ha–1 for HIM). The large decrease in cultivars ranking was ob- served in WGC for cv. ‘Kandela’. Those cultivars in MIM crop management system were in first place, but in HIM in the last place.
We evaluated spring wheat cultivars in all grain quality traits simultaneously using a summed-rank approach (Fig. 1). The cultivar with the smallest sum of ranks had the maximum stability in all the tested quality traits together. Cultivar ‘Hewilla’ was the most stable for all grain quality traits of all cultivars grown under MIM. This cultivar had the lowest sum of stability ranks for all quality traits. Cultivar ‘Hewilla’ achieved first or second position in the stability ranking based on Shukla’s stability variance (Fig. 1) in MIM crop management. Unfortunately, grains of this cultivar were not of the best quality, for most of the studied quality traits it was characterized by averaged values (Table S3).
Only for TW cv.’Hewilla’ reached high values (80.0 kg hl–1). Under HIM, the lowest sum of ranks was achieved by cv. ‘Arabella’. This cultivar was characterized by the most sta- ble grain quality traits while grown under HIM, with the exception of SV, for which this cultivar ranked only 6th in stability.
Discussion
Spring wheat compared to winter wheat has a lower yield but much better quality (Maghi- rang et al. 2006; Studnicki et al. 2016) and it may be desired by the milling and baking industry. Moreover, the spring wheat is even more important in Central Eastern European and in some Western European countries (e.g. Germany). Due to climate changes, espe- cially on a more frequent disadvantageous autumn weather conditions for winter wheat sowing and when winter wheat crop was destroyed by frost in the no-snow winter. The stability patterns of spring wheat cultivars for yield and quality traits were different in comparison to winter wheat.
The stability of the cultivars for TGW, SC, SV and TW traits are similar in both crop management levels. These quality traits in that previous study are strongly determined by the genotypic effects (Studnicki et al. 2016). The stability of cultivar stability for GY, GPC and WGC traits depends on crop management. Therefore, cultivars’ performance under MIM and HIM in terms of these traits is inconsistently ranked. In other words, dif- ferent cultivars are stable under MIM and under HIM. Inconsistency of the stability rank- ings for GY, GPC and WGC indicates sensitivity of cultivars to crop management, and indirectly indicates that traits depend on both environmental and crop management ef- fects (Šíp et al. 2013; Tapley et al. 2013). These inconsistencies also indicate the presence of interaction between cultivar and crop management. Inconsistent stability rankings im- pede progress in breeding programmes and contribute to difficulties in recommending cultivars to farmers. In terms of these qualities are hard to find a wide adapted cultivars at two crop management levels simultaneously. For these traits evaluation of narrow adapt- ability is worth considering.
It is difficult to identify any spring wheat cultivar that has good stability for all grain quality traits. Similar results were observed also for durum wheat (Stagnari et al. 2013).
No clear results of cultivars stability of quality traits was also observed in winter wheat (Mut et al. 2010; Bilgin et al. 2015). For other data sets different models should be taken into consideration.
The cv. ‘Arabella’ and cv. ‘Hewilla’ are stable for most of the study quality traits, we can consider them as an economically stable, thus allowing for the reduction of losses and of process modifications in the milling and baking industry. Unfortunately, cv. ‘Arabella’
and cv. ‘Hewilla’ are not adapted to a wide range of environments, nor did cv. ‘Arabella’
and cv. ‘Hewilla’ produce grain of the best quality. However, these two cultivars are suit- able to be considered as parents in breeding programmes for quality traits improvement.
Among three stability parameters the Shukla’s model was the best fitted to the study data set. Shukla’s stability variance was also the best model for rice MET data (Raman et al. 2011). However, few researches demonstrated the usefulness of the Finlay–Wilkinson model for the evaluation of cultivars’ stability (Hu et al. 2014; Sixto et al. 2014). For other data sets are worth assessing fit of the stability models. Use of the criterion AIC is helpful in achieving this objective. AIC selects the parameter that will allow for reliable conclusions about the stability of cultivars.
In conclusions, among stability model the Shukla model should be considered as the most appropriate to the evaluation of stability of grain yield and quality for spring wheat
cultivars. The thousand-grain weight (TGW), starch content (SC), Zeleny sedimentation value (SV) and test weight (TW) traits were characterized consistency stability rankings of cultivars between moderate-input and high-input (MIM and HIM) crop management levels. For yield (GY), grain protein content (GPC) and wet gluten content (WGC) traits were observed inconsistency of the stability rankings between moderate-input and high- input crop management levels. The cv. ‘Hewilla’ was achieved first or second position in the stability ranking under moderate-input crop management for most of the traits. The grains of this cultivar were not themselves of the best quality. In high-input crop manage- ment (HIM) the cv. ‘Arabela’ was characterized by the most stable grain quality traits, with the exception of Zeleny sedimentation value.
Acknowledgements
We fully acknowledge Jolanta Mroczek and students of the Warsaw University of Life Sciences for their technical assistance. This research was supported by a scientific project grant POIG.01.03.01-14-041/12.
References
AACC International 2015. Approved methods of the American Association of Cereal Chemists (11th ed.).
The Am. Assoc. of Cereal Chem. St. Paul, USA.
Altay, F. 2012. Yield stability of some Turkish winter wheat (Triticum aestivum L.) genotypes in the Western Transtional Zone of Turkey. Turkish J. of Field Crops 17:129–134.
Amallah, L., Taghouti, M., Rhrib, K., Gaboun, F., Hassikou, R. 2015. Genetic variability in agro-morphological and quality traits of Mediterranean durum wheat landraces. Cereal Res. Commun. 43:123–132.
Anderson, W.K., Burgel, A.J., Sharma, D.L., Shackley, B.J., Zaicou-Kunesch, C.M., Miyan, M.S., Amjad, M.
2011. Assessing specific agronomic responses of wheat cultivars in a winter rainfall environment. Crop Pasture Sci. 62:115–124.
Bilgin, O., Guzman, C., Baser, I., Crossa, J., Korkut, Z. 2015. Evaluation of grain yield and quality traits of bread wheat genotypes cultivated in Northwest Turkey. Crop Sci. 56:73–84.
Chen, J., Zhu, S., Zhao, G. 2017. Rapid determination of total protein and wet gluten in commercial wheat flour using siSVR-NIR. Food Chem. 221:1939–1946.
De Vita, P., Mastrangelo, A.M., Matteu, L., Mazzucotelli, E., Virzi, N., Palumbo, M., Lo Storto, M., Rizza, F., Cattivelli, L. 2010. Genetic improvement effects on yield stability in durum wheat genotypes grown in Italy.
Field Crops Res. 119:68–77.
Denčić, S., Mladenov, N., Kobiljski, B. 2012. Effects of genotype and environment on breadmaking quality in wheat. Int. J. of Plant Prod. 5:71–82.
Finlay, G.J., Bullock, P.R., Sapirstein, H.D., Naeem, H.A., Hussain, A., Angadi, S.V., DePauw, R.M. 2007.
Genotypic and environmental variation in grain, flour, dough and bread-making characteristics of western Canadian spring wheat. Can. J. of Plant Sci. 87:679–690.
Hruskova, M., Famera, O. 2003. Prediction of wheat and flour Zeleny sedimentation value using NIR tech- nique. Czech J. of Food Sci. 21:91–96.
Hu, X., Yan, S., Li, S. 2014. The influence of error variance variation on analysis of genotype stability in multi-environment trials. Field Crops Res. 156:84–90.
Kong, L., Si, J., Zhang, B., Feng, B., Li, S., Wang, F. 2013. Environmental modification of wheat grain protein accumulation and associated processing quality: a case study of China. Aust. J. of Crop Sci. 7:173–181.
Maghirang, E.B., Lookhart, G.L., Bean, S.R., Pierce, R.O., Xie, F., Caley, M.S., Wilson, J.D., Seabourn, B.W., Ram, M.S., Park, S.H., Chung, O.K., Dowell, F.E. 2006. Comparison of quality characteristics and bread- making functionality of hard red winter and hard red spring wheat. Cereal Chem. 83:520–528.
Mikulikova, D., Masar, Š., Horvathova, V., Kraic, J. 2009. Stability of quality traits in winter wheat cultivars.
Czech J. of Food Sci. 27:403–417.
Möhring, J., Piepho, H.P. 2009. Comparison of weighting in two-stage analyses of series of experiments. Crop Sci. 49:1977–1988.
Mühleisen, J., Piepho, H.P., Maurer, H.P., Zhao, Y., Reif, J.C. 2014. Exploitation of yield stability in barley.
Theor. Appl. Genet. 127:1949–1962.
Mut, Z., Aydin, N., Bayramoglu, H.O., Ozcan, H. 2010. Stability of some quality traits in bread wheat (Triticum aestivum) genotypes. J. of Environ. Biol. 31:489–495.
Mutlu, A.C., Boyaci, I.H., Genis, H.E., Ozturk, R., Basaran-Akgul, N., Sanal, T., Evlice, A.K. 2011. Prediction of wheat quality parameters using near-infrared spectroscopy and artificial neural networks. Eur. Food Res.
and Technol. 233:267–274.
Natsuga, M., Kawamura, S. 2006. Visible and near-infrared reflectance spectroscopy for determining physico- chemical properties of rice. Transactions of the ASABE 49:1069–1076.
Osborne, B.G. 2006. Near-infrared spectroscopy in food analysis. In: Meyers, R.A. (ed.), Encyclopedia of Analytical Chemistry. John Wiley & Sons, Ltd. Chichester, UK.
Pettersson, H., Åberg, L. 2003. Near-infrared spectroscopy for determination of mycotoxins in cereals. Food Control 14:229–232.
Piepho, H.P. 1999. Stability analysis using the SAS system. Agron. J. 91:154–160.
Piepho, H.P., Nazir, M.F., Qamar, M., Rattu, A., Riaz-ud-Din, Hussain, M., Ahmad, G., Fazal-e-Subhan, Ahmad, J., Abdullah, Laghari, K.B., Vistro, I.A., Kakar, M.S., Sial, M.A., Imtiaz, M. 2016. Stability analy- sis for a countrywide series of wheat trials in Pakistan. Crop Sci. 56:2465–2475.
Raman, A., Ladha, J.K., Kumar, V., Sharma, S., Piepho, H.P. 2011. Stability analysis of farmer participatory trials for conservation agriculture using mixed models. Field Crops Res. 121:450–459.
Robert, N., Denis, J.B. 1996. Stability of baking quality in bread wheat using several statistical parameters.
Theor. Appl. Genet. 93:172–178.
Šíp, V., Vavera, R., Chrpová, J., Kusá, H., Růžek, P. 2013. Winter wheat yield and quality related to tillage practice, input level and environmental conditions. Soil and Tillage Res. 132:77–85.
Sixto, H., Gil, P., Pilar, C., Sánchez, M., Cañellas, I., Voltas, J. 2014. Performance of hybrid poplar clones in short rotation coppice in Mediterranean environments: analysis of genotypic stability. GCB Bioenergy 6:661–671.
Stagnari, F., Onofri, A., Codianni, P., Pisante, M. 2013. Durum wheat varieties in N-deficient environments and organic farming: a comparison of yield, quality and stability performances. Plant Breed. 132:266–275.
Studnicki, M., Wijata, M., Sobczyński, G., Samborski, S., Gozdowski, D., Rozbicki, J. 2016. Effect of geno- type, environment and crop management on yield and quality traits in spring wheat. J. Cereal Sci. 72:30–37.
Tapley, M., Ortiz, B.V., van Santen, E., Balkcom, K.S., Mask, P., Weaver, D.B. 2013. Location, seeding date, and variety interactions on winter wheat yield in southeastern United States. Agron. J. 105:509–518.
Electronic Supplementary Material (ESM)
Electronic Supplementary Material (ESM) associated with this article can be found at the website of CRC at http://www.akademiai.com/content/120427/
Electronic Supplementary Table S1. Description of the spring wheat cultivars, including their year of release and country of origin
Electronic Supplementary Table S2. Akaike Information Criterion (AIC) of stability models for the seven tested traits at two crop management levels
Electronic Supplementary Table S3. Mean values of grain yield and quality traits for 11 spring wheat cultivars grown at two crop management levels