DOI: 10.1556/066.2020.49.3.2
IMPACT OF NITROGEN TOPDRESSING ON THE QUALITY PARAMETERS OF WINTER WHEAT (TRITICUM AESTIVUM L.)
YIELD
A. E *a, K.M. K a, H. K a, V. K b, A. T a and M. J a
aCrop Production Institute, Szent István University, H-2100 Gödöllő, Páter Károly utca 1. Hungary
bAgricultural Institute, Centre for Agricultural Research, H-2462 Martonvásár, Brunszvik u. 2. Hungary (Received: 18 November 2019; accepted: 5 April 2020)
Scope of the study was to fi nd more eff ective N fertilisation doses and applications to reach not only higher quantity but better quality grains as well as to be able to help preserving the continuity of feed and food quality improvement, since wheat is one of the most consumed crops all over the world.
Samples of winter wheat (Triticum aestivum L.) varieties harvested from the experimental fi eld of the Szent István University in two consecutive crop seasons had been examined in the laboratory of the Crop Production Institute. Eff ects of nitrogen (N) application on the performance of grain protein were tested. Five high quality winter wheat varieties were studied regarding grain quality traits aff ected by applying undivided and split doses of N. The evaluated samples show that increasing doses of N topdressing and increasing time of application have benefi cial eff ects on the yield and the value of protein content. Wheat grain protein value ranged between 9.9% of the untreated Mv Karéj and Alföld, where the 120+40 kg ha–1 N was applied resulting in the highest value of 16.0%.
Similarly, the gluten values among untreated and N applied plots were in a wide range. Mv Karéj had the lowest wheat gluten value on untreated plot with 18.4% and Alföld had the highest value with 36.8% on the plot where the 120+40 kg ha–1 N was applied. There were no signifi cant changes recorded on test weight and thousand kernel weight. In the case of baking quality, there were signifi cant diff erences between varieties. The best records were obtained in the case of Mv Toborzó followed by Mv Karéj.
Keywords: grain protein, gluten, winter wheat, baking quality, nitrogen, nitrogen fertilisation
There are more lands planted with wheat in the world than with any other crop. It provides 20 percent of the world’s caloric consumption, even 50 percent for the world’s poorest, and it provides 20 percent of their protein consumption, too (W W F 2016/2017). The total global wheat output exceeded 749.3 million tons in 2016, according to FAOSTAT data (FAO, 2017). Wheat is also one of the most important cereals in Hungary and Turkey as well with a high economic value. The goal of wheat production is twofold:
providing quantity and quality as well. Milling and baking qualities of wheat are mainly determined by the genetic basis; however, it can be infl uenced by management techniques as well (P , 1981; G et al., 1996; V et al., 1996; P , 2010). The determination of wheat milling quality is very complex, however, the quality measurements lean on the kernel hardness, protein, starch, internal insect infestation, colour, disease, size, and moisture parameters (P , 2003). Baking quality of wheat fl our is determined by grain protein concentration (GPC) and its composition, and is highly infl uenced by environmental factors such as nitrogen (N) fertilisation management (X , 2019). The protein content of wheat crops has important impacts on their nutritional quality for humans
* To whom correspondence should be addressed.
E-mail: adnaneser@hotmail.com
and livestock and on their functional properties in food processing. (S & H , 2002). Economic value of winter wheat is aff ected by the genotype, cropping year, agro- climatic parameters as well as the agronomic applications and coordination (G , 2006;
V , 2008). Nitrogen (N) is one of the macronutrients required for plant growth, with high eff ect on quality and quantity values of winter wheat. The quality of wheat varieties is strongly infl uenced by year and genotype eff ects, and the eff ects of the management systems are also determinative on some physical and gluten quality characters of the grain (R
et al., 2016). H and co-workers (2014) also presented that increasing levels of N topdressing and increased number of applications had benefi cial eff ects on the protein content as well as on wet gluten values of wheat grain. S and co-workers (2005) found that increasing fertiliser dose applications had preferable eff ect on the protein and gluten contents, as well as quality improvement had been proved. K and T (2010) described that the increasing rate of N fertilisation application as well as the additional organic fertilisers infl uenced the biomass production and N uptake of winter wheat. The aim of the study was to investigate change in qualitative parameters of the winter wheat varieties sown in two crop seasons with diff erent level and split/undivided doses application of nitrogen fertilisation.
1. Materials and methods
In years 2017 and 2018, a fi eld trial of high milling and baking quality winter wheat (Triticum aestivum L.) varieties were set up under identical agronomic conditions using split-plot design (10 m2/plot). The trial was established at the experimental fi eld of the Szent István University, Crop Production Institute, Hungary. Soil type of the experimental fi eld was sand based brown forest soil (Chromic Luvisol). The textural classifi cation of the soil was sandy loam with parameters shown in Table 1. The agronomic characteristic of the soil was neutral sandy soil with variable clay content. The soil structure was susceptible regarding compaction.
The water retaining characteristics were poor due to the high sand fraction. The soil was exposed to drought impacts. The two-year experiment was set up in split-plot design with nine plot replications regarding each experimental factor such as variety and N application (time and dose) in each investigated year. The plots were sown and harvested with plot machines. Apart from N topdressing, all other agronomic treatments as well as sowing and harvesting were identically applied to all plots to study the impact of N treatments independently. N fertiliser topdressing was applied in single or split doses. N was applied in form of ammonium nitrate (NH4NO3); the amounts are indicating the N content in this paper, not the molecule. N was investigated in 6 diff erent variants: 4 levels single and 2 levels split dose treatments. Single application: 0, 80, 120, and 160 kg ha–1 N, split doses application:
80+40 kg ha–1 and 120+40 kg ha–1 in two applications. Applications were done at tillering stage in the case of single application, while split dose treatment was applied at the stage of tillering and heading. There was no N application in autumn in any of the crop years. The present study examined the performance of fi ve high baking quality winter wheat varieties Mv Karéj, Mv Nádor, Mv Toldi, Mv Toborzó, and Alföld. Grain yields of the winter wheat varieties were sampled and measured from each harvested plot. The protein, test weight, thousand grain weight, and baking quality parameters were measured from harvested wheat grain. Analyses were done at the research laboratory of the Szent Istvan University Crop Production Institute. Near infrared (NIR) spectroscopic equipment Mininfra Scan-T Plus
2.02 version (A , 2016) was used to measure gluten, protein, and Zeleny sedimentation values of whole grains. Falling number was also studied to determine amylase enzyme activity in the fl our. The Hagberg Falling Number (HFN) Perten Type:1400 system, which meets the requirements of the AACC (American Association of Cereal Chemist) No.56- 81.04, ICC (International Cereal Chemist) No. 107/1, and PN EN ISO 3093:2010 standards, was used to determine the falling number. The OS 1 type equipment by the ISO 7971-3:2019 standard was used to measure test weight. Thousand grain weight and test weight were measured with the KERN EMS and the Sartorius MA-30 precision scales. Farinograph (Valorigraph) instrument had been used to describe baking quality of the dough. ANOVA module of the statistical software SPSS V.23 was used for the statistical analyses.
Table 1. Soil type of the experimental fi eld at Szent István University, Crop Production Institute, Hungary
Humus % pH (H2O) KA Sand % Silt % Clay % CaCO3
Medium 1.32 7.08 40 49 25 26 0
2. Results and discussion
Protein and gluten contents of the tested wheat grain samples indicate that N supply had high eff ect on examined varieties in accordance with earlier research results (P , 1981;
V et al., 1996; P , 2010). There were varietal diff erences, too, as untreated plots had remarkable diff erences between varieties. Especially increasing dose applications had remarkable eff ect in the experimental year 2017.
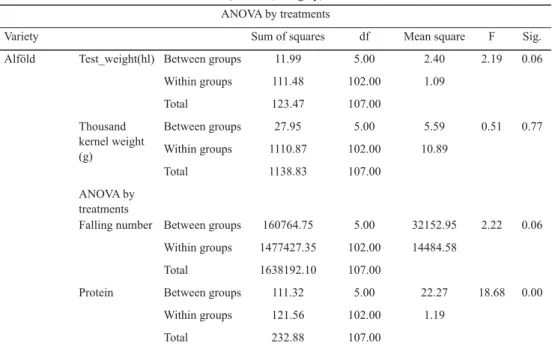
One-way ANOVA test in Table 2 clarifi es the results statistically; results are discussed case by case.
Table 2. Impact of undivided/split N topdressing applications on the quality parameters of wheat grain, 2017–2018 (Gödöllő, Hungary)
ANOVA by treatments
Variety Sum of squares df Mean square F Sig.
Alföld Test_weight(hl) Between groups 11.99 5.00 2.40 2.19 0.06
Within groups 111.48 102.00 1.09
Total 123.47 107.00
Thousand kernel weight (g)
Between groups 27.95 5.00 5.59 0.51 0.77
Within groups 1110.87 102.00 10.89
Total 1138.83 107.00
ANOVA by treatments
Falling number Between groups 160764.75 5.00 32152.95 2.22 0.06 Within groups 1477427.35 102.00 14484.58
Total 1638192.10 107.00
Protein Between groups 111.32 5.00 22.27 18.68 0.00
Within groups 121.56 102.00 1.19
Total 232.88 107.00
ANOVA by treatments
Variety Sum of squares df Mean square F Sig.
Gluten Between groups 987.88 5.00 197.58 21.08 0.00
Within groups 955.81 102.00 9.37
Total 1943.69 107.00
Zeleny Between groups 3659.71 5.00 731.94 9.53 0.00
Within groups 7835.60 102.00 76.82
Total 11495.31 107.00
Baking quality Between groups 2172.55 5.00 434.51 3.39 0.01 Within groups 13089.52 102.00 128.33
Total 15262.07 107.00
MV Nádor Test_weight (hl)
Between groups 9.56 5.00 1.91 1.50 0.20
Within groups 129.75 102.00 1.27
Total 139.31 107.00
Thousand kernel weight (g)
Between groups 138.84 5.00 27.77 6.24 0.00
Within groups 453.60 102.00 4.45
Total 592.44 107.00
Falling_number Between groups 5606.26 5.00 1121.25 0.10 0.99 Within groups 1206753.40 102.00 11830.92
Total 1212359.67 107.00
Protein Between groups 65.11 5.00 13.02 16.21 0.00
Within groups 81.94 102.00 0.80
Total 147.05 107.00
Gluten Between groups 592.99 5.00 118.60 15.69 0.00
ANOVA by treatments
Within groups 771.18 102.00 7.56
Total 1364.17 107.00
Zeleny Between groups 2374.65 5.00 474.93 9.76 0.00
Within groups 4962.07 102.00 48.65
Total 7336.72 107.00
Baking quality Between groups 164.97 5.00 32.99 2.28 0.06
Within groups 694.98 48.00 14.48
Total 859.95 53.00
ANOVA by treatments
Variety Sum of squares df Mean square F Sig.
MV Karéj Test_weight (hl)
Between groups 3.23 5.00 0.65 0.13 0.99
Within groups 521.60 102.00 5.11
Total 524.83 107.00
Thousand kernel weight (g)
Between groups 81.70 5.00 16.34 1.34 0.26
Within groups 1246.45 102.00 12.22
Total 1328.14 107.00
Falling_number Between groups 44637.32 5.00 8927.46 1.81 0.12 Within groups 502698.59 102.00 4928.42
Total 547335.91 107.00
Protein Between groups 121.32 5.00 24.27 13.86 0.00
Within groups 178.56 102.00 1.75
Total 299.88 107.00
Gluten Between groups 1279.15 5.00 255.83 19.90 0.00
Within groups 1311.16 102.00 12.86
Total 2590.31 107.00
Zeleny Between groups 6202.36 5.00 1240.47 22.89 0.00
Within groups 5526.90 102.00 54.19
Total 11729.25 107.00
Baking quality Between groups 2683.40 5.00 536.68 19.01 0.00
Within groups 2879.56 102.00 28.23
Total 5562.96 107.00
ANOVA by treatments
MV Toborzó Test_weight (hl)
Between groups 2.11 5.00 0.42 0.08 1.00
Within groups 529.54 102.00 5.19
Total 531.64 107.00
Thousand kernel weight (g)
Between groups 131.00 5.00 26.20 1.05 0.39
Within groups 2551.08 102.00 25.01
Total 2682.08 107.00
Falling_number Between groups 33203.60 5.00 6640.72 0.49 0.78 Within groups 1374205.67 102.00 13472.61
Total 1407409.27 107.00
Protein Between groups 75.83 5.00 15.17 6.57 0.00
ANOVA by treatments
Variety Sum of squares df Mean square F Sig.
Within groups 235.31 102.00 2.31
Total 311.13 107.00
Gluten Between groups 797.88 5.00 159.58 9.94 0.00
Within groups 1636.83 102.00 16.05
Total 2434.71 107.00
Zeleny Between groups 3676.52 5.00 735.30 22.67 0.00
Within groups 3309.08 102.00 32.44
Total 6985.59 107.00
Baking quality Between groups 800.27 5.00 160.06 0.97 0.44 Within groups 16871.26 102.00 165.40
Total 17671.53 107.00
MV Toldi Test_weight (hl)
Between groups 20.70 5.00 4.14 0.70 0.62
Within groups 601.57 102.00 5.90
Total 622.28 107.00
Thousand kernel weight (g)
Between groups 93.38 5.00 18.68 3.69 0.00
Within groups 515.92 102.00 5.06
Total 609.29 107.00
Falling_number Between groups 26999.59 5.00 5399.92 0.15 0.98
ANOVA by treatments
Within groups 3624628.16 102.00 35535.57
Total 3651627.75 107.00
Protein Between groups 53.59 5.00 10.72 8.85 0.00
Within groups 123.57 102.00 1.21
Total 177.16 107.00
Gluten Between groups 545.28 5.00 109.06 7.55 0.00
Within groups 1473.79 102.00 14.45
Total 2019.07 107.00
Zeleny Between groups 3088.55 5.00 617.71 10.29 0.00
Within groups 6123.85 102.00 60.04
Total 9212.40 107.00
Baking quality Between groups 753.61 5.00 150.72 0.46 0.81 Within groups 33358.66 102.00 327.05
Total 34112.27 107.00
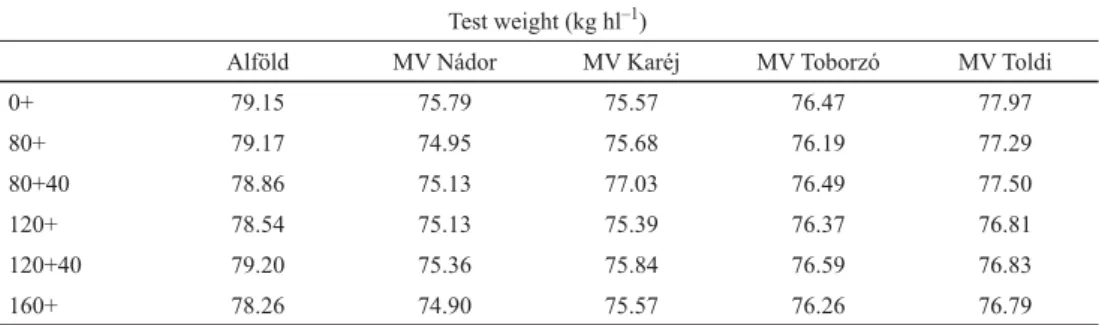
Table 3. Impact of N topdressing applications on wheat grain test weight. 2017–2018 (Gödöllő, Hungary) Test weight (kg hl–1)
Alföld MV Nádor MV Karéj MV Toborzó MV Toldi
0+ 79.15 75.79 75.57 76.47 77.97
80+ 79.17 74.95 75.68 76.19 77.29
80+40 78.86 75.13 77.03 76.49 77.50
120+ 78.54 75.13 75.39 76.37 76.81
120+40 79.20 75.36 75.84 76.59 76.83
160+ 78.26 74.90 75.57 76.26 76.79
Table 3 gives information on N application eff ects on test weight at the studied winter wheat varieties. Test weight (kg hl–1) values slightly decreased in some of the tested varieties by the increasing level of undivided N application, but the changes found were not signifi cant.
In addition, positive eff ect of split dose treatment had been detected, except in case of Mv Nádor 80+40 kg ha–1 to 120 kg ha–1 N application. The highest result had been recorded for the Alföld 120+40 kg ha–1 split dose application with 79.2 kg hl–1 and the lowest for Nador as 74.9 kg hl–1. However, split dose N application did not present signifi cant changes among the tested winter wheat varieties, similar results were reported by P (1981) and H and co-workers (2014).
Table 4 gives the results of the thousand kernel weight values with the eff ect of undivided/
split dose of N supply. Thousand kernel weight value decreased slightly in most of the cases for the increeasing undivided/split level of N applications, however, increasing number of N treatments had better eff ect in the comparison of 80+40 kg ha–1 to 120 kg ha–1 and 120+40 kg ha–1 to 160 kg ha–1, except Mv Toborzó comparison of 120+40 kg ha–1 to 160 kg ha–1. Mv Nádor and Mv Toldi showed signifi cant diff erences by the one-way ANOVA test of thousand kernel weight. Similar results were reported by S and co-workers (2005) and H and co-workers (2014). The highest thousand grain weight was recorded on the untreated Karéj plot with 46.7 g/thousand kernel weight, and the lowest was detected on an Alföld plot treated with undivided 160 kg ha–1 N application resulting 38.0 g/thousand kernel weight.
Table 4. Impact of N topdressing applications on thousand kernel weight of wheat varieties.
2017–2018 (Gödöllő, Hungary)
N topdressing Thousand kernel weight (g/1000 kernel)
Alföld MV Nádor MV Karéj MV Toborzó MV Toldi
0+ 39.73 44.78 46.70 45.05 45.81
80+ 38.73 43.16 45.58 42.64 44.20
80+40 38.63 42.79 45.82 42.42 45.07
120+ 38.56 42.10 45.40 41.44 43.77
120+40 38.83 42.21 45.36 42.40 44.40
160+ 38.02 41.09 43.78 42.60 42.88
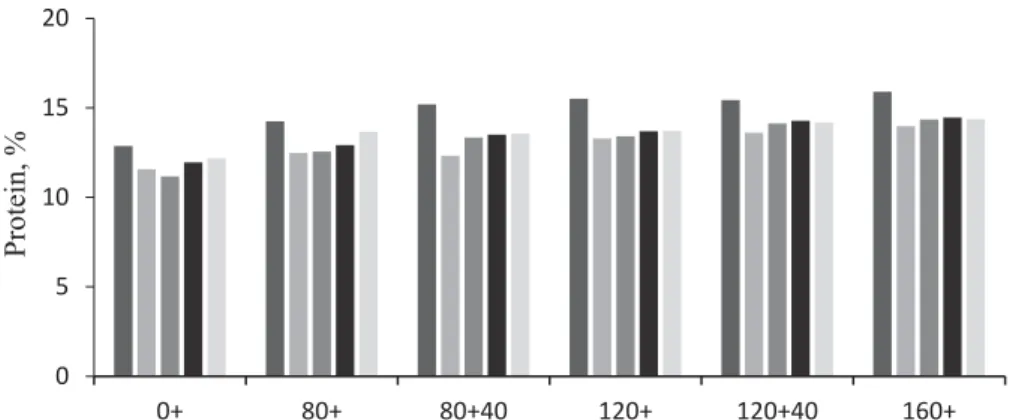
Based on the results of the experiment, it can be stated that increasing levels of N topdressing had signifi cant eff ect on grain protein content in all studied winter wheat varieties, either in split or undivided dose applications. Figure 1 and Table 2 show the grain protein
values in 2017–2018. Protein amounts changed from 9.9% to 16.0%. Highest value was observed on the Alföld plot with split 120+40 kg ha–1 N application (16.0%), and the lowest, 9.9%, was obtained on Karéj untreated plot. Split dose application did not have signifi cant eff ect compared to the same amount of undivided application.
0 5 10 15 20
0+ 80+ 80+40 120+ 120+40 160+
Protein, %
Fig. 1. Impact of N topdressing applications on wheat grain protein content, 2017–2018 (Gödöllő, Hungary) : Alföld; : MV Nádor; : MV Karéj; : MV Toborzó; : MV Toldi
Gluten content was signifi cantly aff ected by increasing doses of N applications as well with increased split dose applications. Similar examples have been reported by several authors (G , 2006; K & T , 2010; R i et al., 2016). Figure 2 and Table 2 show strong eff ect of N application on grain gluten content regardless of crop year, variety, or split/undivided application. Among the evaluated samples, the Alföld plot had the highest value (36.8%), where 120+40 kg ha–1 split N doses had been applied. In addition, Karéj had the lowest value with 18.4% on the untreated plot, and split dose application did not have signifi cant eff ect on gluten content compared to the same amount of undivided application.
0 5 10 15 20 25 30 35 40
0+ 80+ 80+40 120+ 120+40 160+
Gluten, %
Fig. 2. Impact of N topdressing applications on wheat grain gluten content, 2017–2018 (Gödöllő. Hungary) : Alföld; : MV Nádor; : MV Karéj; : MV Toborzó; : MV Toldi
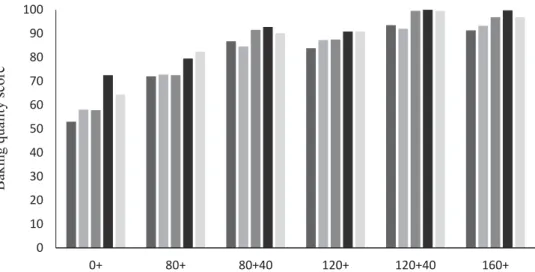
The results obtained show that all increasing levels of N applications aff ected the baking quality of the investigated winter wheat varieties, in accordance with the fi ndings of earlier research results (S & H , 2002; G , 2006; P , 2010), shown in Figure 3.
The lowest value, 53, was recorded in the case of Alföld on the untreated plot, and the best value, 100, was found for Toborzó on the 120+40 kg ha–1 split dose N applied plot. As well as increasing levels of N fertilisation, increasing number of the applications also had positive impact on baking quality of tested winter wheat varieties. Varieties Alföld and Karéj demonstrated signifi cant diff erences, and the split application of 80+40 and 120+40 kg ha–1 resulted 2.9% better values compared to 120 and 160 kg ha–1 single applications. N addition had no signifi cant eff ect on falling number (Table 2), however, Zeleny sedimentation number increased with increasing doses of N regardless of the variety.
0 10 20 30 40 50 60 70 80 90 100
0+ 80+ 80+40 120+ 120+40 160+
Baking quality score
Fig. 3. Impact of N application on wheat grain baking quality, 2017–2018 (Gödöllő, Hungary) : Alföld; : MV Nádor; : MV Karéj; : MV Toborzó; : MV Toldi
3. Conclusions
Rising amounts of N topdressing and the increased number of fertiliser applications were proved to have favourable impact on the crop yield and quality, on the amount of protein content, as well as on gluten values of tested winter wheat varieties. There were diff erences between the protein and quality results of the two cropping seasons due to meteorological diff erences; however, all parameters of the experimental agronomic techniques applied and all 5 wheat varieties used for both cropping seasons were identical. Among the investigated varieties, Alföld had the highest protein and gluten contents, and Mv Toborzó had the best baking quality among the tested varieties. Increasing doses of N application had signifi cant eff ect on Zeleny sedimentation number, but no eff ect of split application was detected. N treatment had no signifi cant eff ect on falling number. Increasing doses of N treatment had no signifi cant eff ect on test weight, but split application gave better results compared to single treatment with the same dosage.
*
The authors are grateful for the fi nancial support of the Tempus Public Foundation and NVKI of the Government of Hungary.
References
AACC (2010): Approved methods of analysis 11th ed. Determination of Falling Number Method No. 56-81.04.
A , I. (E .) (2016): Physical properties of foods: Novel measurement techniques and applications. CRC Press, 420 pages.
FAO (2017): Food and Agriculture Organization of the United Nations, Land Resources.
FAOSTATS-Crops. http://faostat.fao.org/site/567/default.aspx#ancor (last accessed: 10. October 2019).
G , B., T , A.S., F , R.B., S , P.R. N , J.A. (1996): Comparison of the expression patterns of wheat gluten proteins and proteins involved in the secretory pathway in developing caryopses of wheat. Plant Mol. Biol., 30, 1067–1073.
G , Z. (2006): A trágyázás hatása az őszi búza minőségére (Impacts of fertilizer application on winter wheat quality). Agrofórum, 17(9), 14–16.
H , C ., K , J., T , Á., K , K., N , H. J , M. (2014): The eff ect of nitrogen fertilization and crop year precipitation on the protein and wet gluten content of wheat (Triticum aestivum L.) grain.
Agrokem. Talajtan, 63(1),159–164.
ICC (1995): Determination of the Falling Number according to Hagberg - as a measure of the degree of alpha- amylase activity in grain and fl our. Method No. 107/1
ISO (2019): Cereals — Determination of bulk density, called mass per hectoliter. ISO 7971-3:2019
K , T. T , Z. (2010): Eff ect of mineral and organic fertilization on soil fertility as well as on the biomass production and N utilization of winter wheat (Triticum aestivum L.) in a long-term cereal crop rotation experiment (IOSDV). Arch. Acker. Pfl . Boden., 56(4), 473–479.
P , P. (2010): Adaptive capacity of wheat (Triticum aestivum L.) and maize (Zea mays L.) crop models to ecological conditions. Növénytermelés, 59. Suppl., 325–328.
PN EN ISO (2010): Wheat, rye and their fl ours, durum wheat and durum wheat semolina - Determination of the falling number according to Hagberg-Perten. PN EN ISO 3093:2010
P , E. (1981): A búza és a liszt minősége. (Quality of wheat and fl our). Mezőgazdasági Kiadó. Budapest.
203 pages.
P , E.S. (2003): Principles of milling. Encyclopedia of food science, food technology and nutrition. Academic Press, Harcourt Brace Jovanovich Publishers. London, pp. 3980–3986.
R , M., M , P., L , F., H , J., A , R. … B , Z. (2016): Comparison of quality parameters of wheat varieties with diff erent breeding origin under organic and low-input conventional conditions. J. Cereal Sci., 69.297–305.
S , P. H , N. (2002): Cereal seed storage proteins: structures, properties and role in grain utilization.
J. Exp. Bot., 53(370), 947–958.
S , Z ., K , C ., S , G. J , M. (2005): Eff ect of nitrogen top-dressing on winter wheat yield, quality and quantity. Acta Alimentaria, 34, 177–185.
V , G. (2008): Extreme soil moisture regime as limiting factor of the plants’ water uptake. Cereal Res.
Commun., 36(2), 3–6.
V , G ., B , Z. J , M. (1996): Agronómiai kezeléskombinációk őszi búzafajták sütőipari minőségére gyakorolt hatásának elemzése főkomponens-analízissel (Investigation of the eff ect of agronomical treatment combinations on the winter wheat’s baking qualities with main component analysis). Növénytermelés, 45(6), 453–462.
W W F 2016/2017: Washington Grain Commission http://wagrains.org/wp-content/
uploads/2015/04/WGC-2016-17WF4WebFinal.pdf (last accessed: 10 October 2019).
X , C., M , A., M , H.-P. M , K.-H. (2019): Protein composition and baking quality of wheat fl our as aff ected by split nitrogen application. Front. Plant Sci., 10, 642.
Open Access statement. This is an open-access article distributed under the terms of the Creative Commons Attri- bution 4.0 International License (https://creativecommons.org/licenses/by/4.0/), which permits unrestricted use, distribution, and reproduction in any medium, provided the original author and source are credited, a link to the CC License is provided, and changes – if any – are indicated. (SID_1)