THE IMPACT OF PROCESS INNOVATION ON BUSINESS PERFORMANCE Krisztina Demeter1, Dávid Losonci1, Tibor Keresztély1, Klára Major1, Harry Boer2
1Corvinus University of Budapest, Hungary
2Aalborg University, Denmark and Corvinus University of Budapest, Hungary krisztina.demeter@uni-corvinus.hu
ABSTRACT
The objective of this paper is twofold: 1) investigates the impact of process innovation on business performance in the context of a dependent market economy (DME); 2) look into the industrial specifics of the question. We assume that due to the context, process innovation is an important activity, which leads to higher business performance (measured as EBIT/sales), since the competitive advantage in a DME stems primarily from better (cheaper, faster, higher quality) production.
The 2016 Community Innovation Survey and 2014-2018 company profit and loss statements are used from Hungary with 5002 companies. The analyses only partly support the hypotheses. Although in overall innovating companies have better business performance, based on regression analyses company size and industry are more important factors to achieve higher business performance than any kind of innovation activity. Nevertheless, among the types of innovation (product, service, process), still process innovation has the largest impact on business performance.
Keywords: process innovation, product innovation, dependent market economy, industry, business performance
1. INTRODUCTION
Process innovation is an important ingredient of business success, especially in the Central and Eastern European region Hungary, where several subsidiaries of multinational companies operate giving a large portion of value added. Being a manufacturing base for Western Europe, these countries are also called as dependent market economies (DME) (Nölke and Vliegenthart, 2009). And it is vital for companies there to be efficient and produce with low cost. Indeed, low cost strategy is hand-in-hand with process innovation (Reichstein and Salter, 2006). These efforts are visible in lean management developments (e.g. Demeter and Losonci, 2020) and nowadays, in digital manufacturing to remain competitive (Szász et al., 2020). We use Hungary as a representative of these economies.
But process innovation is usually not the only innovation type to take place in companies. It frequently goes together with product (good or service) innovation. When new products are introduced, or existing products’ features change, the process also requires changes. In the early stage of the product’s life cycle product innovation focuses on product performance, but in later stages costs, and in parallel, process innovation becomes much more important (Utterback and Abernathy, 1975). It is therefore useful to study process innovation together with product innovation, not separately of product innovation.
Even if there are innovation efforts in every industry to remain competitive, the ratio of product and process innovation, as well as the extent of effort can be different (Reichstein and Salter, 2006; Pisano, 1997). Therefore, it is important to understand this contingency to make wiser decisions at both economy, industry and company levels.
The objective of this paper is twofold. First, to investigate the impact of process innovation on business performance in the context of a DME, and second, to get insight into the characteristics of industries in this matter. We assume that due to the context, process innovation is an important activity and these activities lead to higher business performance, since the competitive advantage in a DME stems primarily from better (cheaper, faster, higher quality) production (Nölke and Vliegenthart, 2009). There might be, however, some industry specifics due to competition intensity, business strategies, maturity, and other factors.
Our paper is organized as follows. First, we examine the literature to formulate our hypotheses.
Next, the database is introduced and described. The analysis contains the statistical results of the hypotheses’ testing. After the discussion, contribution and limitations are summarized.
2. LITERATURE REVIEW
Innovation is about to change what we do (product innovation) and how we do it (process innovation). As a result, innovation can change the competitive position of a company.
“Process innovation can be defined as new elements introduced into an organization’s production or service operations—input materials, task specifications, work and information flow mechanisms, and equipment used to produce a product or render a service—with the aim of achieving lower costs and/or higher product quality” (Reichstein and Salter, 2006:653).
Other authors add delivery speed or quality as potential targets for process developments (Gunday et al., 2011; Kahn, 2018).
Based on the definition provided by OECD (2005), and used by the Community Innovation Survey, “process innovation is a new or significantly improved production or delivery method.
This includes significant changes in techniques, equipment and/or software. Meanwhile,
“product innovation is a good or service that is new or significantly improved. This includes significant improvements in technical specifications, components and materials, software in the product, user friendliness or other functional characteristics.”
The context in which the company operates has tremendous impact on its actual and future innovation practices and performances. Mueller et al. (2013), for example, argue that national culture has a strong impact on the success of exploratory innovation, while uncertainty avoidance influences the results of exploitative innovation. Parilli et al. (2020), investigating at EU regional level, also found that regional specificities of technological capabilities matter in the use of various innovation modes (R&D based vs. knowledge sharing based) and the nature of innovation output.
Although we found one paper dealing with Central and Eastern European (CEE) countries (Prokop et al., 2019), that paper focuses on collaborations for innovation, and not on internal product or process innovation. But still emphasizes the difference between Western and Eastern European countries in innovation performance, development of innovation networks, the level of trust and cooperation between different actors. More general, CEE countries are DMEs, where skilled and cheap labour is available, multinational companies provide capital for subsidiaries via foreign direct investment and transfer technological innovations there. These subsidiaries have comparative advantage in assembling and producing relatively complex and durable consumer goods (Nölke and Vliegenthart, 2009). From an innovation point of view, it means that product innovation and in many cases process innovation, as well, takes place in Western countries and transferred to the DMEs. Nevertheless, since the subsidiaries produce the product, they can have some opportunities to influence the efficiency and effectiveness of these processes, much more, than the products themselves.
There are diverse results in the literature regarding the impact of process innovation on business performance. There are papers, which do not find any relationship (Gunday et al., 2011;
Koellinger, 2008; Ilmudeen et al., 2021), others find significant impact, although lower than that of product innovation (Cheng et al., 2010). We can also find papers showing the
performance effects of process innovation as significant as the performance effects of product innovation (Ar & Baki, 2011). Findings also depend on the measures used. For example, Koellinger (2008) found positive relationship with employment growth, but no relationship with profitability. Many papers use perceptive measures instead of objective ones, and they usually create a firm performance construct from these measures (Cheng et al., 2010; Ar &
Baki, 2011; Ilmudeen et al., 2021).
Altogether, although not obvious, but there seems to be more results supporting the positive relationship between process innovation and firm performance, so we formulate the following hypothesis:
H1: The impact of process innovation on business performance is larger than the impact of product innovation in the context of DME.
Even if the emphasis is on process innovation in DMEs, process innovation is not independent of product innovation (Koellinger, 2008; Ar & Baki, 2011; Xu & Zhang, 2008; Cheng et al., 2010). Reichstein and Salter (2006) analysed their relationship for both radical and incremental innovations and found strong correlation (>0.5) between the ratio of product and process innovation based on data from 18 industries. Martines-Ros (2000) also found complementarities between the two innovation types, although product innovation encouraged process innovation more, than vica versa. In contrast, Kraft (1990) found that while product innovation drives process innovation, process innovation does not influence product innovation.
Papers investigating the relationship between product and process innovation usually find that they together have a positive impact on firm performance. Reichstein and Salter (2006), focusing particularly on process innovation, found a positive moderation effect. Prange and Bruyaka (2016) investigated internationalization performance, and found that Chinese companies primarily use process innovation, but those relying on both process and product innovation through ambidexterity can reach better internationalization performance. Ceylan (2013) shows that process innovation leads to higher product innovation, which results in higher firm performance. Therefore, our next hypothesis is the following.
H2: Process innovation positively moderates the performance effect of product innovation.
The intensity and emphasis on different types of innovation depends on a range of factors, including the company’s strategy (Reichstein and Salter, 2006), the ownership (Cheng et al., 2010), but also the level of competition in its industry (Porter, 1979). In highly competitive markets companies cannot survive without continuous innovation. Not only high-tech companies depend on innovation. Pisano (1997) identified four groups of industries based on the rate of product and process innovation. In process driven industries (commodity chemicals, steel, paper) and mature industries (apparel, processed food, shipbuilding) the rate of product innovation is low and process development focuses on cost reduction. In product driven industries (software, entertainment, assembled products) either little process development can be found, or the focus is on design for manufacturability. In process enabling industries (pharmaceuticals, semiconductors, high-precision, miniature electronic goods) process development focuses on solving complex technical problems, rapid time to market and fast ramp-up (see Figure 1). Reichstein and Salter (2006) also detected large differences among industries regarding process innovation. Despite these large differences between industries no study so far has put them into the focus of analysis. Due to the differences in the rate of process and product innovation, as well, as differences in their relationship, we argue that the moderation impact of process innovation on the performance effect of product innovation can be higher, if the general rate of product innovation is higher in a given industry.
Rate of process innovation
High Process driven industries Process enabling industries Low Mature industries Product driven industries
Low High
Rate of product innovation Figure 1. Rate of product and process innovation in various industries
(based on Pisano, 1997)
Therefore, based on Pisano’s (1997) framework we formulate the following hypothesis:
H3: The moderation effect of process innovation is stronger in industries with a high rate of product innovation than in industries with a low rate of product innovation.
3. THE SAMPLE
We use two databases to answer our hypotheses. The 2016 Hungarian edition of the Community Innovation Survey (CIS) covers the innovation activities, efforts, and innovation performances over the period between 2014-2016. The survey altogether contains 6830 companies. We used three variables from this survey asking if during the three years 2014-2016, did companies introduced any 1) goods innovation (new or significantly improved goods: tangible object, such as a smartphone, furniture, or packaged software, but downlodable software, music and film are also goods) 2) service innovation (new or significantly improved services: usually intangible, such as retailing, insurance, educational courses, air travel, consulting, etc.), or 3) process innovation (new or significantly improved methods of manufacturing for producing goods or services).
We decided to use both goods and service innovation, for two reasons: first, there are both manufacturing and service industries in our sample, 2) due to servitization (Szász et al., 2017) several manufacturing companies provide a service package for their customers instead of pure products, so service innovation is relevant for them, as well.
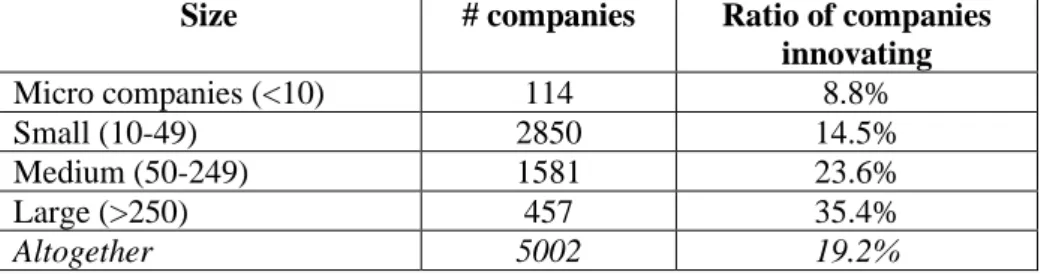
We link the CIS survey with the database containing Hungarian companies’ balance sheets and profit & loss statements. We use data from this latter database for five years (2014-2018). Three years embracing the years of CIS (2014-2016) and two additional years (2017-2018), assuming that innovation needs some time to come into effect. With this approach we can overcome the disadvantages of cross-sectional data analyses. In our analysis we considered the EBIT/sales as the key measure of business performance and took the average of the five years. EBIT/sales is one of the most frequently used measures for grasping the business performance. Since the performance of companies can be very hectic, considering more than one year can also help to overcome this shortcoming. Our original sample contained companies having both the CIS and the five-year EBIT/sales data. First data checking has shown that there is a large spread of the EBIT/sales measure with unrealistic numbers. Therefore, we decided to leave out 3-3% of companies with the highest and lowest EBIT/sales values. After this action the combined database contains 5002 companies. Descriptive statistics (size, industries) are provided in the tables below.
Size # companies Ratio of companies innovating
Micro companies (<10) 114 8.8%
Small (10-49) 2850 14.5%
Medium (50-249) 1581 23.6%
Large (>250) 457 35.4%
Altogether 5002 19.2%
Table 1. Structure of the database by size categories
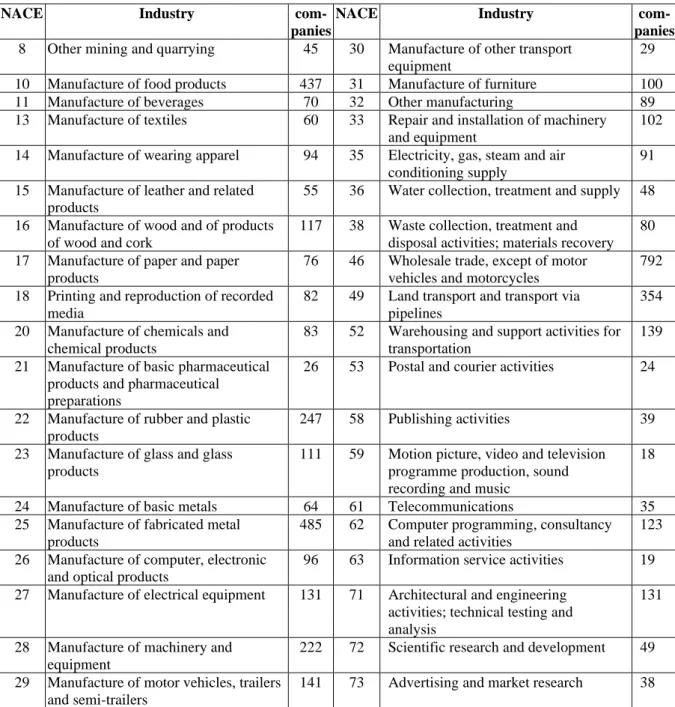
NACE Industry com- panies
NACE Industry com-
panies 8 Other mining and quarrying 45 30 Manufacture of other transport
equipment
29 10 Manufacture of food products 437 31 Manufacture of furniture 100
11 Manufacture of beverages 70 32 Other manufacturing 89
13 Manufacture of textiles 60 33 Repair and installation of machinery and equipment
102 14 Manufacture of wearing apparel 94 35 Electricity, gas, steam and air
conditioning supply
91 15 Manufacture of leather and related
products
55 36 Water collection, treatment and supply 48 16 Manufacture of wood and of products
of wood and cork
117 38 Waste collection, treatment and disposal activities; materials recovery
80 17 Manufacture of paper and paper
products
76 46 Wholesale trade, except of motor vehicles and motorcycles
792 18 Printing and reproduction of recorded
media
82 49 Land transport and transport via pipelines
354 20 Manufacture of chemicals and
chemical products
83 52 Warehousing and support activities for transportation
139 21 Manufacture of basic pharmaceutical
products and pharmaceutical preparations
26 53 Postal and courier activities 24
22 Manufacture of rubber and plastic products
247 58 Publishing activities 39
23 Manufacture of glass and glass products
111 59 Motion picture, video and television programme production, sound recording and music
18
24 Manufacture of basic metals 64 61 Telecommunications 35
25 Manufacture of fabricated metal products
485 62 Computer programming, consultancy and related activities
123 26 Manufacture of computer, electronic
and optical products
96 63 Information service activities 19 27 Manufacture of electrical equipment 131 71 Architectural and engineering
activities; technical testing and analysis
131
28 Manufacture of machinery and equipment
222 72 Scientific research and development 49 29 Manufacture of motor vehicles, trailers
and semi-trailers
141 73 Advertising and market research 38
Table 2. Structure of the database by industries
In order to get to know the nature of the data, some analyses were made before looking at the hypotheses. First, the combinations of the three kinds of innovation were investigated in the overall sample. For example, there are 4044 companies not having any kind of innovation activity (column 1). That is, most companies do not innovate at all. There is only a low ratio of companies (1.5% = 77 companies) doing each innovation types. Altogether, 685 (13.7%) companies did goods innovation in the examined period, 315 (6.3%) did service innovation and 431 (8.6%) did process innovation.
Goods 0 0 0 1 1 0 1 1
Service 0 0 1 0 1 1 0 1
Process 0 1 0 0 0 1 1 1
# comp 4044 123 97 342 88 53 178 77
Table 3. Kind of innovation activities of companies in the sample
Second, we checked the association between the performance of companies and their innovation activities. In order to do this, we created one overall innovation variable. Based on the results (t test: -3.05, p = 0.0012) there is a clear association between the performance of companies and their innovation activities.
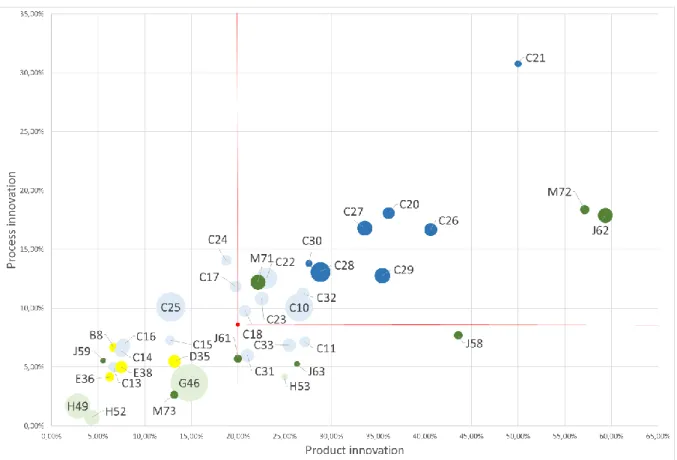
Third, to prepare for testing H3, we visualized the relationship between product and process innovation in various industries. Based on Figure 3, there is a clear association between product and process innovation. Industries having higher ratio of companies doing product innovation also have higher ratio of companies doing process innovation. The association is clear, most of the companies are on the diagonal, in the lowest and highest innovation boxes divided by the red lines along the total average (20% of companies do product innovation in average and 8.7%
of them do process innovation). The darker coloured industries tend to be in the highest innovation box, which suggest that technology and knowledge intensity have large influence on the level of innovation. In other words, we can assume that both process and product innovation are determined by them, rather than one innovation causes the other one.
Figure 2. Relationship between product and process innovation
(for codes see NACE Rev2: https://ec.europa.eu/eurostat/documents/3859598/5902521/KS-RA-07- 015-EN.PDF and Table 3) Signs: a) size of circles: number of observations; b) light/dark blue circles:
low and medium-low / medium-high and high tech manufacturing industries; c) light/dark green circles: less / more knowledge intensive services; d) yellow circles: not classified
4. HYPOTHESIS TESTING
We use linear regression analysis to see the impact of product and process innovation, as well as their interaction on business performance (H1 and H2). We use company size as a control variable. In Model 1 the business performance is explained by the different types of innovation.
Table 4 shows that the parameter of the process innovation is more than ten times larger than
the parameter of the good innovation. In addition, the coefficient of the good innovation is not significant at any significance level, but the coefficient of the process innovation is significant at all the reasonable significance levels. So we can state that H1 hypothesis is confirmed; the impact of process innovation on business performance is larger than the impact of product innovation.
In Model 2 we completed the previous equation by the interactions of the explaining variables of Model 1. If the parameter of the interaction of the process and the product innovation were significant, we could interpret it as the moderation of the effect of one of the variables on the other. But as Table 4 shows, the interaction parameters are not significant. It means that we have to reject H2; process innovation does not moderate the performance effect of product innovation.
In Model 3 we added the company size to the model as a control variable. Regarding the output of this model we can see that the set of the control variables is significant; the performance of the small companies is significantly better than the control group (micro companies). We can realize that the parameter of the process innovation is still two times larger than the parameter of the good innovation (even though neither of the parameters are significant). Table 4 also shows that the parameter of the interaction of the process and the product innovation is still not significant. So adding the control variable would not change our conclusion about H1 and H2.
Variables Model 1 Model 2 Model 3
new good 0.001
(0.00)
0.001 (0.00)
0.005 (0.00)
new service 0.007
(0.00)
0.005 (0.01)
0.005 (0.01)
new method 0.012***
(0.00)
0.008 (0.01)
0.011 (0.01)
new good x new serv -0.004
(0.01)
-0.006 (0.01)
new good x new method 0.003
(0.01)
0.004 (0.01)
new serv x new method 0.011
(0.01)
0,008 (0,01)
micro companies 0.000
(.)
small companies 0.019**
(0.01)
medium companies 0.003
(0.01)
large companies -0,007
(0.01)
intercept 0.061***
(0.00)
0.061***
(0.00)
0.049***
(0.01) R2
Adjusted R2
0.0043 0.0037
0.0047 0.0035
0.0244 0.0226 Number of observations
F (p)
5002 7.26 (0.0001)
5002 3.93 (0.0006)
5002 13.85 (0.000) Table 4. Determinants of business performance (based on the whole sample)
(data inside parenthesis are the corresponding standard errors)
Rejecting H2 hypothesis meant that the moderation effect of process innovation does not differ from zero in a statistical sense. This measurement was implemented on the whole sample. It is possible that repeating the same process on sub-samples we obtain different results. So we have repeated the previous estimations for two subsets: the companies in industries with a high and low rate of product innovation in order to test H3. The results are presented in Table 5 and Table 6.
Regarding the tables, we can see that the parameters of the interaction of the process and the product innovation are not significant in any case of any model. Comparing Model 6 and Model 9 we can realize that the afore-mentioned parameter is larger among companies in industries with a high rate of product innovation, but this larger parameter is not significant either (actually model 4, 5, 7, 8 themselves are not significant). So, we cannot conclude that the moderation effect of process innovation is stronger in industries with a high rate of product innovation than in industries with a low rate of product innovation. Therefore, H3 hypothesis is rejected.
Industries with high rate of product innovation
Industries with low rate of product innovation Variables Model 4 Model 5 Model 6 Model 7 Model 8 Model 9
new good -0.000
(0.00)
0.001 (0.00)
0.004 (0.00)
-0.001 (0.01)
-0.002 (0.01)
-0.001 (0.01)
new service 0.011
(0.01)
0.007 (0.01)
0.005 (0.01)
0.001 (0.01)
0.003 (0.01)
0.006 (0.01)
new method 0.011*
(0.00)
0.007 (0.01)
0.009 (0.01)
0.013*
(0.01)
0.009 (0.01)
0.012 (0.01)
new good x new serv -0.004
(0.01)
-0.004 (0.01)
-0.006 (0.01)
-0.007 (0.01)
new good x new method 0.001
(0.01)
0.003 (0.01)
0.013 (0.01)
0.013 (0.01)
new serv x new method 0.015
(0.01)
0,013 (0,01)
-0.001 (0.01)
-0,003 (0,01)
micro companies 0.000
(.)
0.000 (.)
small companies 0.016
(0.01)
0.021**
(0.01)
medium companies 0.003
(0.01)
0.002 (0.01)
large companies -0,009
(0.01)
-0,007 (0.01)
intercept 0.063***
(0.00)
0.063***
(0.00)
0.054***
(0.01)
0.059***
(0.00)
0.060***
(0.00)
0.046***
(0.01) R2
Adjusted R2
0.0061 0.0048
0.0069 0.0043
0.0228 0.0190
0.0021 0.0010
0.0025 0.0003
0.0283 0.0250 Number of observations
F (p)
2322 4.74
2322 2.68
2322 6.00
2680 1.87
2680 1.12
2680 8.64 (0.026) (0.0135) (0.000) (0.1329) (0.3491) (0.000) Table 5. Determinants of business performance (based on companies in industries with high/low
rate of product innovation) (data inside parenthesis are the corresponding standard errors)
5. DISCUSSION AND CONTRIBUTION
The issue of process innovation is especially important nowadays, due to the fast digitalization, which certainly has an enormous impact on processes. Using a large data set and a five-year
timespan for business results, our analysis can provide a robust answer to the impact of innovation on business performance. Furthermore, knowing the industrial specifics of process innovation can lead to more sophisticated governmental innovation policies, and companies themselves can make wiser decisions regarding the effort put into process or product innovation.
Process innovation indeed seems to have some influence on business performance (H1), which supports some of the previous research results (Cheng et al., 2010; Ar & Baki, 2011). However, the result that process innovation has higher influence than product innovation, and the latter does not have significant impact, is unique. This result supports our assumption about DMEs, namely, that process innovation is an important factor in achieving business success there (Nölke & Vliegenthart, 2009). Although the results are not very strong, as the explaining power of all the models is low. We believe that this low explaining power can be partly caused by the low ratio of innovating companies, and by the fact, that there are many other factors having more impact on business performance than innovation.
Based on the literature (Reichstein & Salter, 2006; Ceylan, 2013) we expected that process innovation has a moderating effect on the impact of product innovation on business performance (H2 and H3). But we had to reject these hypotheses. The two innovation types do not strengthen each other to make a synergetic impact on business performance. Even if business performance is higher at innovating companies, this result cannot be explained by the innovation types strengthening each other. Looking at Figure 2, the co-movement of process and product innovation might be more explained by a third factor, like the technological or knowledge intensity of various industries. Industrial factors (like these intensities or company sizes) have a far stronger impact on business performance than innovation.
In the future, we plan to extend our analysis in several directions. First, we want to use panel data for CIS data, containing more than one round of the survey to understand better the policies of companies regarding process innovation. Second, we are in the process to find partners from a market economy with high innovation performance, where product innovation is more usual and in the focus. Making the same analysis and comparing the results we can have a better understanding of the impact of (economic and market/competitive) context on innovation activities and results. Third, similarly to Reichstein & Salter (2006), we want to separate radical and incremental innovations and see their impact on business performance.
6. ACKNOWLEDGMENT
Project no. TKP2020-NKA-02 has been implemented with the support provided from the National Research, Development and Innovation Fund of Hungary, financed under the Tématerületi Kiválósági Program funding scheme.
REFERENCES
Ar, I.M. and Baki, B. (2011), Antecedents and performance impact of product versus process innovation, European Journal of Innovation Management, 14(2), 172-206.
Ceylan, C (2013): Commitment-based HR practices, different types of innovation activities and firm innovation performance, INTERNATIONAL JOURNAL OF HUMAN RESOURCE MANAGEMENT, 24(1), 208-226.
Cheng, CF; Lai, MK; Wu, WY (2010), Exploring the impact of innovation strategy on R&D employees' job satisfaction: A mathematical model and empirical research, TECHNOVATION, 30(7-8), 459-470.
Demeter, K. and Losonci, D. (2019), Transferring lean knowledge within multinational networks, Production Planning and Control, 30(2-3), 211-224.
Gunday, G., Ulusoy, G., Kilic, K. and Alpkan, L. (2011), Effects of innovation types on firm performance, International Journal of Production Economics, 133, 662-676.
Ilmudeen, A; Bao, YK; Alharbi, IM; Zubair, N (2021): Revisiting dynamic capability for organizations' innovation types Does it matter for organizational performance in China?, EUROPEAN JOURNAL OF INNOVATION MANAGEMENT, DOI:10.1108/EJIM-06-2019-0144.
Kahn, K.B. (2018), Understanding innovation, Business Horizons, 61, 453-460.
Koellinger, P (2008), The relationship between technology, innovation, and firm performance - Empirical evidence from e-business in Europe, RESEARCH POLICY, 37(8), 1317-1328.
Kraft, K. (1990), Are product- and process-innovations independent of each other? Applied Economics, 22, 1029–1038.
Martinez-Ros, E. (2000), Explaining the decisions to carry out product and process innovations: the Spanish case, Journal of High Technology Management Research, 10(2), 223–242.
Mueller, V; Rosenbusch, N; Bausch, A (2013), Success Patterns of Exploratory and Exploitative Innovation: A Meta-Analysis of the Influence of Institutional Factors, JOURNAL OF MANAGEMENT, 39(6), 1606-1636.
Nölke, A., Vliegenthart, A. (2009): Enlarging the varieties of capitalism: The emergence of dependent market economies in East Central Europe. World Politics, Vol. 61, No. 4, pp. 670-702.
OECD. (2005). Oslo manual: Guidelines for collecting and interpreting innovation data (3rd ed.). Oslo Manual.
https://ec.europa.eu/eurostat/documents/3859598/5889925/OSLO-EN.PDF/60a5a2f5-577a-4091-9e09- 9fa9e741dcf1?version=1.0.
Parrilli, MD; Balavac, M; Radicic, D (2020): Business innovation modes and their impact on innovation outputs:
Regional variations and the nature of innovation across EU regions, RESEARCH POLICY, 49(8), 104047-.
Prange, C; Bruyaka, O (2016): Better at home, abroad, or both? How Chinese firms use ambidextrous
internationalization strategies to drive innovation, CROSS CULTURAL & STRATEGIC MANAGEMENT, 23(2), 306-339.
Porter, M.E. (1979), How competitive forces shape strategy, Harvard Business Review, 57(2), 137–145.
Pisano, G.P. (1997), The Development Factory: Unlocking the Potential of Process Innovation, Boston: Harvard Business Press.
Prokop, V; Stejskal, J; Hudec, O (2019): Collaboration for innovation in small CEE countries, E & M EKONOMIE A MANAGEMENT, 22(1), 130-144.
Reichstein, T. and Salter, A. (2006), Investigating the sources of process innovation among UK manufacturing firms, Industrial and Corporate Change, 15(4), 653-682.
Szász, L., Demeter, K., Boer, H. and Cheng, Y. (2017), Servitization of manufacturing: the effect of economic context, Journal of Manufacturing Technology Management, 28(8), 1011-1034.
Szász, L., Demeter, K., Rácz, B.G. and Losonci, D. (2020), Industry 4.0: A review and analysis of contingency and performance effects, Journal of Manufacturing Technology Management, 32(3), 667-694.
Utterback, J.M. and Abernathy, W.J. (1975): A dynamic model of process and product innovation, OMEGA, The International Journal of Management Science, 3(6), 639-656.
Xu, EM; Zhang, H (2008), The impact of state shares on corporate innovation strategy and performance in China, ASIA PACIFIC JOURNAL OF MANAGEMENT, 25(3), 473-487.