Article
Asymmetric Impact of Institutional Quality on Tourism Inflows Among Selected Asian
Pacific Countries
Muhammad Asif Khan1 , József Popp2 , Mirza Nouman Ali Talib3,*, Zoltán Lakner4, Muhammad Atif Khan1,5and Judit Oláh6
1 Department of Commerce, Faculty of Management Sciences, University of Kotli, Azad Jammu and Kashmir 11100, Pakistan; khanasif82@hotmail.com
2 Faculty of Economics and Social Sciences, Szent István University, 2100 Gödöl˝o, Hungary;
popp.jozsef@gtk.szie.hu
3 School of Economics, Huazhong University of Science and Technology, Wuhan 430074, China
4 Department of Food Economics, Faculty of Food Science, Szent István University, Gödöll˝o, 2100 Budapest, Hungary; lakner.zoltan@etk.szie.hu
5 Zhongnan University of Economics and Law, School of Finance, Wuhan 430073, China;
sardaratifkhan@outlook.com
6 Faculty of Economics and Business, University of Debrecen, 4032 Debrecen, Hungary;
olah.judit@econ.unideb.hu
* Correspondence: nouman.ali918@yahoo.com
Received: 11 December 2019; Accepted: 5 February 2020; Published: 7 February 2020 Abstract:From an idealistic viewpoint, the existence of the tourism industry in a country/region is a blessing because of its anticipated sustainable economic benefits. To turn this idealistic state into a realistic one, institutions need to play a pivotal role in optimizing the desired incentives. The present study examines the asymmetric role of institutional quality in stimulating tourism inflows (receipts and arrivals) in selected Asia Pacific countries involved in tourism. The previous literature has established that improving institutional quality attracts tourism inflows to a destination. However, the literature fails to identify the specific point (threshold level) above (below) which the relationship turns positive (negative). To the best of our knowledge, this is the first study that estimates the asymmetries in the nexus of institutions and tourism inflows, using robust nonlinear autoregressive distributed lag approach. Our results show that the tourism inflow in Asian Pacific countries responds asymmetrically to any changes in institutional quality, and there is a single threshold of 7.52 points, where the impact of institutional quality reverses. We conclude that our findings are robust to the alternative measures of tourism inflows. The study offers useful policy inputs for devising short and long-run policies for the betterment of the institutional framework in the region by understanding the asymmetric impact of institutional quality on tourism inflow.
Keywords: institutional quality; tourism inflows; symmetric and asymmetric ARDL
1. Background and Motivation
Tourism is steadily growing as a strong pillar of sustainable development in the world. As a source of income, many developed and developing countries around the globe consider tourism as a potential contributor to the national balance of payments, employment creation, and foreign exchange accumulation. A large number of studies [1–9] have highlighted the tourism-led growth hypothesis in the past two decades, especially in Asian countries, signifying a reduction in poverty, the creation of employment opportunities, and the promotion of investments in both the physical and human capital of the countries concerned [10].
Sustainability2020,12, 1223; doi:10.3390/su12031223 www.mdpi.com/journal/sustainability
Relative to the other regions of the world, the Asian Pacific region is important as one of the favorite destinations for tourism. According to the United Nations’ World Tourism Organization [11], the Asian Pacific region has generated 390 billion dollars through tourism, which is estimated as 29%
of global tourism receipts. Between 2005 and 2016, the Asian region outperformed the rest of the world in terms of the annual growth rate of inbound tourist arrivals. The growth rate has increased by 7% per year, compared to the rest of the world’s average of 4% [11,12]. Being a region of many low- and middle-income countries, tourism in the Asian Pacific region is more significant in terms of both physical and human capital creation relative to other regions. Adding tourism-related revenues in the economies concerned potentially increases the growth of these countries [12].
Considering the increase in tourism receipts, some countries in Asia have seen a decreasing trend in tourism. For example, the tourism inflow receipts of Malaysia, the second most visited tourist destination in 2014, declined drastically in 2017 [12]. Similarly, the inbound receipts of South Korea increased in 2016 by 17 million but declined in 2017 to 13 million US dollars [11,12]. Considering the Travel and Tourism Competitiveness report [13], while Indonesia increased its competitiveness in tourism, the Philippines significantly declined in 2017. In response to the countries’ fluctuating (non-linear) patterns of tourism inflow, it is, therefore, important to consider the factors responsible for the growth or decline of tourism inflow in Asia Pacific countries.
As implied from various studies, tourism inflows may respond asymmetrically to the rule of law, corruption, protection of property rights, political stability, or the change in political conditions within each country. Driven by institutional quality, governance, and economic growth, the tourism industry could be expected to show non-linearities. In the presence of non-linearities, a linear model may produce inconsistent and less reliable estimations. With the existence of nonlinearities, the response of the tourism industry to the positive effects of tourism institutions and economic development might differ from their response to the negative effects. For long-run equilibrium adjustments, it is vital to detect the asymmetries that make it important for investors and policymakers to exploit valuable information by managing tourism strategies and minimizing their exposure to the risk of political instability. Motivated by the shortcomings of previous studies, we have considered an asymmetric approach to describe these differences, which may bring more insight for policymakers or investors.
In this paper, we, therefore, consider the relationship between institutional quality and tourism inflows in a more distinctive way than previous studies. We first acknowledge the existing literature explaining the institutional effects on tourism inflow (number of arrivals and tourism revenue received), and secondly the inclusion of asymmetries at the country-specific level. Yet, our study remains distinct from the existing literature by measuring asymmetries and capturing nonlinearities. Several studies have taken asymmetries into account in recent literature [14,15], although not from the perspective of tourism inflow.
To estimate the potential asymmetric relationship between tourism inflow and its institutional and economic determinants, our study employs the methodology of asymmetric cointegration in the non-linear framework. Under this paradigm, the asymmetric (non-linear autoregressive distributive lag) methodology of Shin and Yu [16] was considered. With the presence of possible nonlinearities in the relationship between institutional quality and tourism inflow, along with a set of control variables, the application of the nonlinear autoregressive distributive lag technique enriches the existing literature on tourism inflow, and in this case specifically for Asian Pacific tourism modelling.
The previous literature has established that improving institutional quality attracts tourism inflows to a destination. However, the literature fails to identify the specific point (threshold level) above (below) which the relationship turns positive (negative). To the best of our knowledge, this is the first study to estimate the asymmetries in the nexus of institutions and tourism inflows, using the robust Shin, Yu and Greenwood-Nimmo [16] approach.
The rest of the study is organized as follows. Section2gives a brief account of institutional quality and tourism inflow. Section3provides a methodological setting. The results are discussed in Section4, while Section5concludes the study.
2. Brief Literature Review on Institutional Quality and Tourism
Institutions include formal and informal standards that determine how people treat each other [17].
Good institutions promote economic growth and sustainable development by building trust and cooperation, encouraging investment, and deterring free movement and the search for rent. Bad institutions lead to an economic recession, corruption, and political instability. There is a great deal of evidence that institutional quality is one of the main (if not the main) determinants of the differences in economic and financial development between countries [18–21]. The literature argues that high institutional quality may affect the flow of tourists. For example, the impact of corruption on tourism is varied and does not necessarily have to be negative [22]. Corruption can facilitate commercial activities that increase the speed of money and business transactions. Thus, tourism is often associated with illegal and criminal activities (e.g., gambling and prostitution).
The previous literature has discussed the importance of a healthy relationship between governing institutions and the tourism industry. A time-series analysis conducted on Malaysian tourism by Tang [23] showed that international tourists are concerned about the political stability, law enforcement, government effectiveness, and regulations of the country [24]. Efficient governance and institutions stimulate economic growth and encourage tourism and suggest further that improvement in institutional performance stimulates economic growth and signals the level of security, which may increase tourism demand [6,25,26]. In addition, better control of corruption and stability is highly likely to attract more tourism demand [27–29]. This suggests that institutional changes and variations are key fundamentals to differences in tourism inflow among countries around the globe.
Institutions are the backbone of economic and financial sustainability [20,21,30,31], and after the influential work of Balaguer and Cantavella-Jorda [32], several studies (e.g., [33–40]) have emphasized the economic and institutional factors responsible for tourism inflow. Emphasizing the streamlining of the economy hypothesis, several studies have discussed the growth-tourism nexus while considering the factors of income, exchange rates, and tourism prices. In the second stream, recent studies have considered the institutional hypothesis to be important for tourism inflow. Good governance enhances economic growth and promotes tourism inflow [12,26,41], as demonstrated by the fact that good governance reduces security risks, encourages investments and also stimulates tourism [42]. Ghalia, Fidrmuc, Samargandi, et al. [43] use the gravity model to examine the effects of political risks, distance, and socio-economic factors in tourist flow, as well as tourist quality, and factors that stimulate the flow of tourists to the countries of origin and the absence of institutional quality and conflict.
Yeh [44] examined the influence of the governance of the board of directors on the institutional property of tourism companies abroad, using signaling theory to interpret the data of the tourism companies included in the listed companies. The author states that the listed tourism companies with a smaller board are characterized by higher foreign institutional ownership. However, foreign institutional ownership is not influenced by the proportion of independent directors. Luo, Moyle, Bao, et al. [45] examined the role of institutions in generating areas for tourism in national forest parks and showed how institutional changes reflect the dynamic role of the state, capital, and society in China’s national forest parks.
Badola, Hussain, Dobriyal, et al. [46], through the analysis of several case studies using participant observations, group discussions, and stakeholder analysis, was one of the institutional frameworks for tourism management, with four of the most suitable PAs in the Indian Himalayas. The study shows that weak institutions and governance systems can lead to mass tourism controlled by powerful actors.
In addition, local institutions with strong spatial connections are more suited to the challenges of the global economy, while traditional institutions supported by local governments and NGOs are best suited to achieve the Aichi Biodiversity Objectives. Balli, F., Balli, H.O., Louis, et al. [47] examines the link between migration and tourism from developed and emerging markets and demonstrates that immigrants have a significant impact on incoming tourism. The effect varies from region to region.
The main results of the study are that institutional quality is important for visitors, who will decide on the target country.
Undoubtedly, institutional quality and stability determine the health of a country’s economy, and developed quality cultures support the innovation environment [48]. Moreover, as mentioned in a seminal work [17], institutions are defined as the rules of the game in society shaping human interactions, whether economic, social or political [49]. While realizing the complexity and dynamism of the institutional environment, previous studies [27,28,50] have considered institutional quality and tourism inflow but have not considered the asymmetric relationship between institutions and tourism inflow in Asian Pacific countries.
3. Methodological Setting
3.1. Data and Variables
The study utilizes the balanced panel data from 1980–2018 in nine high-tourist Asia Pacific countries, namely China, Hong Kong, India, Indonesia, Japan, Malaysia, South Korea, Singapore, and Thailand. The time span is restricted by data availability constraints. The dependent variable, tourism inflows [12,38,51], is measured by two proxies, 1) the number of international tourism arrivals for sample countryiat timet, and 2) revenue received from international tourists for countryiat timet.
The data for these two proxies are compiled from the World Bank, World Development Indicators. The explanatory variable,institutional qualityis a composite index of Area 2 and Area 5 of the overall index provided by the Fraser Institute of Canada. Area 2 consists of nine sub-indicators namely: “judicial independence, impartial courts, protection of property rights, military interference in rule of law and politics, the integrity of the legal system, legal enforcement of contracts, regulatory restrictions on the sale of real property, reliability of police, and business costs of crime”.
However, Area 5 is built on credit market regulations, labour market regulations, and business regulations. A recent related study [52] used nine components of Area 2 to examine their aggregate impact on inbound tourism, while we incorporate three additional sub-components from Area 5. All these indicators range from 0 to 10. In order to obtain an aggregated score of institutional quality, we group these indicators by taking a simple average. The index provides a comprehensive and comparable measure for the quality of intuitions. The score ranges between 0 and 10—a high score indicates an efficient and secure institutional framework in terms of the legal system, protection of property rights, and regulations.
Furthermore, the literature on tourism suggests that there are several other factors that influence tourism inflows. However, it is difficult to choose which of these are more relevant in the case of the present study. Therefore, following the recommendations of anonymous referees, we chose only those controls which are used in panel studies on the institutions-tourism nexus. We select these from a recent study [51,52] which examined the impact of the freedom of the press on inbound tourism. Thus, these variables have been taken as possible factors influencing tourism inflows in the Asian Pacific region. These include gross domestic product per capita, international trade, exchange rate, total coast, coast per KM2, total land area, total surface area, and the number of heritage sites [51,52]. The data for Gross_Domestic_Product_Per_Capita, International_Trade, and effective exchange rate have been sourced from the World Bank, World Development Indicators (WDI). The data for Total_Coast, Coast_Per_KM2, and Number_of_Heritage variables are obtained from the Central Intelligence Agency (CIA) World Fact Book.
3.2. Panel Unit-Root
As is conventional for macro-level panels with considerably large time series, it is essential to find an integration order before estimating the cointegration among the variables. Secondly, depending upon the non-stationarity of the variables, the dynamic heterogeneous panel data models are specified (as preferred in this study). The different types of unit root tests used in the literature can be divided into two groups. The first group comprises the traditional unit-root tests (referred to as first-generation tests [53,54]). The second group is considered to be the second generation tests, i.e., those which
account for cross-sectional dependence [55]. The first test assumes the null hypothesis of the unit root with common processes and is suitable for unbalanced panel datasets, whereas the second traditional test undertakes the null hypothesis with individual unit root processes and is counted for balanced panel data fields. Moreover, we further consider the Pesaran [55] unit root test which is considered important to analyze whether the various cross-sections taken are heterogeneous or homogenous.
The null hypothesis of this test assumes homogenous non-stationarity, contrary to the alternative possibility of heterogeneity. Pesaran [55] has proposed the cross-sectionally augmented Im, Pesaran and Shin [54] second-generation panel unit-root test to estimate for the cross-sectional dependence.
Based on the cointegration at order zero (I (0)) or order one (I (1)), none of the variables may have cointegration at order 2.
3.3. Pedroni Cointegration Test
After the stationary test, the panel cointegration is performed. The Pedroni test includes seven different statistics, four of which belong to the internal dimension (panel), namely v statistics, p statistics, PP statistics, and ADF statistics, three of them (group), i.e., p statistics, belong to the dimension between PP statistics and ADF statistics. Both types of tests focus on the null hypothesis of cointegration. These statistics are distributed asymptotically as a normal norm.
3.4. Symmetric Panel with ARDL Modeling
We initiate our long-run analysis by assuming the symmetric response of institutional quality to tourism inflow and thereafter, by relaxing the assumption of positive and negative changes in institutional quality, we calculate the estimates. As a first step, the symmetric panel ARDL can be written as:
∆yit=β0i+β1iyt−1+β2ixt−1+β3iδt−1+XN1
j=1πi jyi,t−j+XN1
j=0ωi jxi,t−j+XN1
j=0Υi jδi,t−j+φi+εit (1) where yrepresents the log of tourism inflows (arrivals and revenues respectively) for each of the cross-sectionsiover the periodt,xrepresents the institutional quality,δpresents the vector of control variables, and whereλis the group-specific effect. While considering the assumption of∆yit−j=0 and
∆xit−j=0, the long-run slope coefficients can be calculated as−β2i/β1iand−β3i/β1i. Hence, the short-run estimates for dependent variables can be obtained asωi jandΥi jrespectively. With incorporation, this equation can further be re-specified with the inclusion of the error correction term. The equation is as follows:
∆yit=αiµi,t−1+XN1
j=1πij∆yi,t−j+XN2
j=0ωij∆xi,t−j+XN3
j=0Υij∆δi,t−j+φi+εit (2) whereµi,t−1=yi,t−1−λ0i−λ1ixt−1is the linear error correction term for each unit, the parameterδis the speed adjustment of error correction and also equivalent toβ1i. The parametersλ0iandλ1iare further calculated as−β0i/β1iand−β2i/β1i, respectively. The linear models are evident in previous literature supporting the relationship of tourism inflow and institutions, but no breakdown of institutional quality into positive and negative changes can be found. Hence, by following Shin et al, 2014 we relax the assumption of a symmetric (linear) relation into negative and positive changes of institutional quality to allow for non-linearity or asymmetries.
3.5. Asymmetric Panel with ARDL Settings
Contrary to the linear case, the asymmetric panel ARDL allows for asymmetric responses of tourism inflow to institutional quality. In this case, the impacts cannot be expected to be identical to tourism inflow. Under these conditions, the asymmetric version of the equation is written as:
∆yit=β0i+β1iyt−1+β+2ix+t−1+β−2ix−t−1+β+3iδ+t−1+β−3iδ−t−1+PN1j=1πij∆yi,t−j
+PN2j=0(ω+ij∆x+i,t−j+ω−ij∆x−i,t−j) +PN3j=0(Υ+ijδ+i,t−j+Υ−ijδ−i,t−j) +φi +εit
(3)
where x+and x−denotes the improvement and decline of institutional quality, respectively. These institutional changes are estimated as the negative and positive partial sum of institutional quality changes as mentioned below:
x+ =
t
X
k=1
∆x+ik =
t
X
k=1
max(∆xik, 0) (4)
x−= Xt
k=1
∆x−ik= Xt
k=1
max(∆xik, 0) (5)
With the error correction term the equation yields the following:
∆yit=θiρi,t−1+PN1j=1πij∆yi,t−j+PN2j=0(ω+
ij∆x+i,t−j+ω−
ij∆x−i,t−j) +PN3j=0(Υ+
ijδ+
i,t−j
+Υ−ijδ−i,t−j) +φi+εit (6) As specified in the equation, in this setting of asymmetric panel ARDL the Error correction term (ρi,t−1) estimates the long-run equilibrium while the parameterθiadjusts the speed to measure the convergence time period to long-run equilibrium in the presence of any shock.
3.6. Robustness with Panel Threshold Regression
To check the robustness, we further investigate the panel threshold regression to trace the exact point at which institutional quality changes to nonlinearity. Although traditional approaches that use a quadratic term of an explanatory variable to find nonlinearities are successful, these fail to identify potential structural breaks [56], the exact point at which the relationship turns in the opposite direction and how it does so. In such a case the panel threshold model proposed by [57,58] is an appropriate solution that can trace the turning points. Therefore, the panel threshold regression with a single threshold value is established as follows:
yi,t=
( µi+α1Xi,t+β1qi,t+εi,t, qi < γ
µi+α2Xi,t+β2qi,t+εi,t, qi ≥γ (7) where,yis our dependent variable, tourism inflows,Xis the vector of independent variables andqis the threshold variable—institutional quality,i, andtare country and time, respectively. α1,α2and β1,β2are, respectively, the coefficients of independent and threshold variables, whileγis the threshold value. µiis the fixed effects andεi,tis the error term with assumed zero mean, finite variance and independent and identically distributed.
4. Results and Discussion
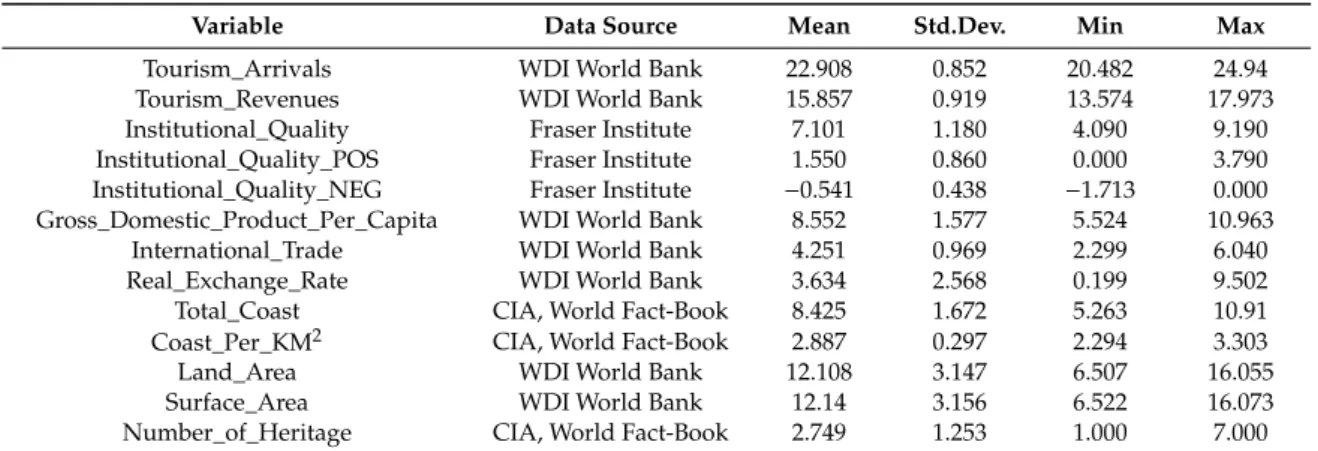
Descriptive statistics and data sources, with reference to each of the variables, are shown in Table1.
Tourism arrivals and receipts are dependent variables ranging between 13.21 and 24.94, with a mean value of 15.85 and 22.91, while the standard deviation is 0.97 and 0.92, respectively. Institutional quality
is an explanatory variable in the form of the index from the Fraser Institute, and ranges between 3.64 (minimum) and 9.19 (maximum), with an average score of 7.101 and a standard deviation of 1.22.
The overall descriptive statistics seem suitable for further estimation.
Table 1.Descriptive statistics.
Variable Data Source Mean Std.Dev. Min Max
Tourism_Arrivals WDI World Bank 22.908 0.852 20.482 24.94
Tourism_Revenues WDI World Bank 15.857 0.919 13.574 17.973
Institutional_Quality Fraser Institute 7.101 1.180 4.090 9.190
Institutional_Quality_POS Fraser Institute 1.550 0.860 0.000 3.790 Institutional_Quality_NEG Fraser Institute −0.541 0.438 −1.713 0.000 Gross_Domestic_Product_Per_Capita WDI World Bank 8.552 1.577 5.524 10.963
International_Trade WDI World Bank 4.251 0.969 2.299 6.040
Real_Exchange_Rate WDI World Bank 3.634 2.568 0.199 9.502
Total_Coast CIA, World Fact-Book 8.425 1.672 5.263 10.91
Coast_Per_KM2 CIA, World Fact-Book 2.887 0.297 2.294 3.303
Land_Area WDI World Bank 12.108 3.147 6.507 16.055
Surface_Area WDI World Bank 12.14 3.156 6.522 16.073
Number_of_Heritage CIA, World Fact-Book 2.749 1.253 1.000 7.000
Note: Except for the number of heritage sites, all variables are shown in the natural logarithm.
As discussed in the methodology section, the study applies both first-generation and second-generation panel unit-root tests to determine the integration order. The results are reported in Table 2, which reveals that using Levin-Lin-Chu, Institutional_Quality, Gross_Domestic_Product_Per_Capita, Total_Coast, Coast_Per_KM2, and Surface_Area are stationary at level, while tourism_arrivals, tourism_receipts, International_Trade and Number_of_Heritage become stationary when transformed to the first difference. The second generation Im, Pesaran and Shin suggests that only Total_Coast and Coast_Per_KM2are free from unit-root at level, with the rest of the variables becoming stationary at the first difference. This mixed order of integration calls for the use of a cointegration approach which produces the best estimation under a mixed order of integration.
Table 2.Panel unit-root test results.
Levin-Lin-Chu Im, Pesaran, and Shin
Variables Level 1st Difference Level 1st Difference
Tourism_Arrivals −0.748 −18.941 *** −1.442 −4.948 ***
Tourism_Revenues −0.408 −13.559 *** −1.028 −5.051 ***
Institutional_Quality −2.575 *** - −1.028 −2.522 ***
Gross_Domestic_Product_Per_Capita −2.507 ** - −1.801 −4.253 ***
Total_Coast −2.832 ** - −2.610 ** -
Coast_Per_KM2 −5.342 *** - −3.610 *** -
International_Trade −0.961 −11.181 *** −1.792 −4.708 ***
Rearl_Exchange_Rate −4.222 *** - −1.829 −4.133 ***
Land_Area −2.162 −7.873 *** −1.515 −4.712 ***
Surface_Area −4.882 *** - −1.841 −5.749 ***
Number_of_Heritage −0.197 −8.344 *** −1.847 −4.074 ***
Note: *** and ** indicate the level of significance at 1% and 5%.
4.1. Cointegration Testing
The study applies Pedroni’s cointegration approach, which is widely used to define panel cointegration. The Pedroni test includes seven different statistics, four of which belong to the internal dimension (panel), namely v statistics, p statistics, PP statistics, and ADF statistics, three of them (group), i.e. p statistics, belong to the dimension between PP statistics and ADF statistics. Both types of tests focus on the null hypothesis of cointegration. These statistics are distributed asymptotically as
a normal norm. Table3shows the statistics of the cointegration test within the panel and between groups for each data set. These statistics are based on the mean values of individual autoregressive coefficients associated with unit root residue tests for each country in the panel. In both models, the zero hypotheses of cointegration for seven cointegration tests are rejected at a 5% significance level for the panel. Evidence suggests that the two panels have a long-term equilibrium relationship between the variables.
Table 3.Pedroni’s panel cointegration test results.
Model (1) Model (2)
Test Statistics Within Panel Between-Group Within Panel Between-Group
v −5.969 −6.829
rho −3.610 −4.699 −3.784 −4.778
t −3.437 −4.574 −3.884 −4.359
ADF −2.807 −2.314 −3.198 −2.290
All test statistics are distributedN(0,1), under a null of no-cointegration, and diverge to negative infinity.
4.2. Symmetric and Asymmetric Relationship
In the previous section, Pedroni’s cointegration test confirms the cointegration relationship between institutional quality, a vector of controls, and tourism arrivals and receipts, respectively.
Pedroni’s cointegration test indicates the overall presence of cointegration, therefore, policymakers sometimes need to know about the short-run and long-run dynamics to frame policies accordingly.
More specifically, the study applies a linear panel ARDL approach [59] to come up with short-run and long-run individual coefficients along with the speed of adjustment with which the previous period disequilibrium is corrected. Following this, we estimate the asymmetric relationship using the recently developed non-linear modelling [16].
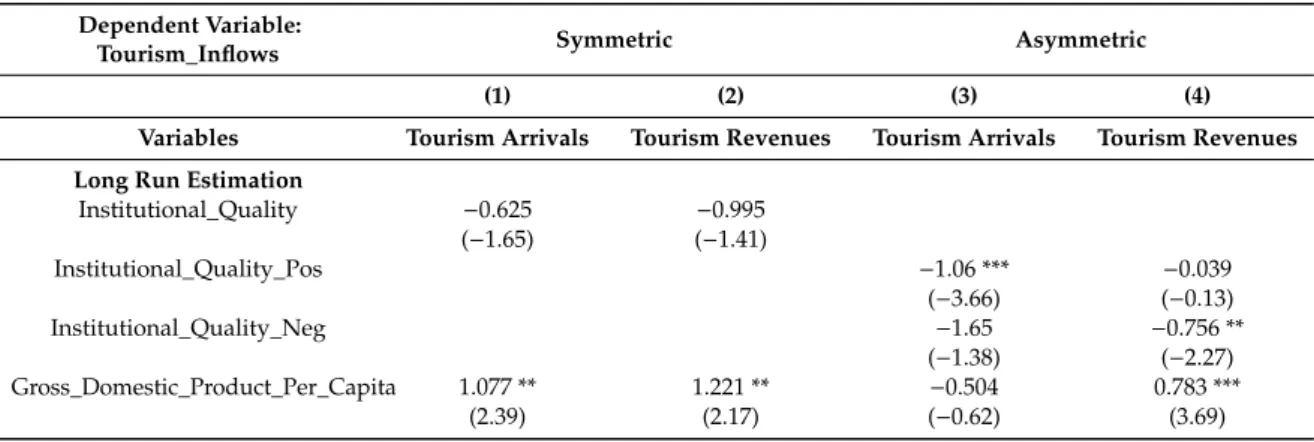
Table4shows the symmetric and asymmetric relationships among the variables. Models (1) and (2) capture the symmetric relationship, and document that the institutional framework is important to encourage tourism inflow in selected Asia Pacific countries, both in the long-run and the short-run, as coefficients are statistically significant and positive in both models. On the other hand, Models (3) and (4) report the asymmetric estimation, which presents the positive and negative associations of institutional quality on tourism inflow in the region. We find that a positive and negative change in institutional quality brings a nonlinear pronouncement in tourism inflow under both specifications.
This implies that institutional quality plays a vital role in attracting tourism inflow in nine Asia Pacific countries. The error correction term suggests that the previous period disequilibrium is corrected at an annual speed of adjustment of 30% and 31% in symmetric models, and 41% and 46% in asymmetric specifications, respectively.
Table 4.Symmetric, and asymmetric panel ARDL estimation results.
Dependent Variable:
Tourism_Inflows Symmetric Asymmetric
(1) (2) (3) (4)
Variables Tourism Arrivals Tourism Revenues Tourism Arrivals Tourism Revenues Long Run Estimation
Institutional_Quality −0.625 −0.995
(−1.65) (−1.41)
Institutional_Quality_Pos −1.06 *** −0.039
(−3.66) (−0.13)
Institutional_Quality_Neg −1.65 −0.756 **
(−1.38) (−2.27)
Gross_Domestic_Product_Per_Capita 1.077 ** 1.221 ** −0.504 0.783 ***
(2.39) (2.17) (−0.62) (3.69)
Table 4.Cont.
Dependent Variable:
Tourism_Inflows Symmetric Asymmetric
(1) (2) (3) (4)
Variables Tourism Arrivals Tourism Revenues Tourism Arrivals Tourism Revenues
International_Trade 0.293 0.670 −0.740 * −0.009
(0.70) (1.21) (−1.71) (−0.03)
Real_Exchange_Rate 1.040 ** 1.297 * 0.618 1.067 *
(2.47) (1.76) (1.13) (1.66)
Land_Area 27.127 −135.772 141.574 86.266
(1.44) (−0.95) (1.01) (1.02)
Surface_Area 119.830 53.322 −672.338 24.905
(1.02) (0.99) (−1.00) (0.91)
Number_of_Heritage 0.138 0.145* −0.090 0.063
(1.10) (1.71) (−0.89) (1.08)
Error Correction Term −0.300 *** −0.315 *** −0.413 *** −0.466 ***
(−3.27) (−5.56) (−3.90) (−7.90)
Short-Run Estimation
∆Institutional_Quality_Pos 0.014 0.023 −0.072 −0.013
(0.32) (0.31) (−1.20) (−0.27)
∆Institutional_Quality_Neg 0.199 ** −0.037 **
(2.23) (−2.41)
∆Gross_Domesticproduct_Per_Capita 0.224 0.273* 0.136 0.127
(1.19) (1.89) (0.80) (0.65)
∆International_Trade 0.081 * 0.136 ** 0.101 0.160
(1.66) (2.06) (1.25) (1.40)
∆Real_Exchange_Rate 0.181 0.141 0.201 −0.464 **
(0.52) (0.32) (0.49) (−2.21)
∆Land_Area 4.929 2.588 −22.608 −32.180
(0.39) (0.25) (−1.21) (−1.16)
∆Surface_Area −27.551 −8.757 −9.008 −4.212
(−1.02) (−0.80) (−1.05) (−0.58)
∆Number_of_Heritage −0.005 −0.018 −0.002 −0.018
(−0.48) (−1.37) (−0.23) (−1.26)
Constant −198.134 −278.189 311.089 −816.061
(−1.14) (−0.77) (0.47) (−1.27)
Wald test (long-run) 1.95 * 2.55 ***
Wald test (short-run) 10.61 *** 5.11 ***
Note: ***, **, and * indicates significance level at 1, 5, and 10% respectively. The numbers in parenthesis are t-statistics.
∆denotes the respective lag variable (lag 1 and lag 2).
NARDL possesses a unique feature to capture the asymmetric changes explained by the explanatory variable (positive and negative) to the dependent variable. To account for this, the study conducts the Wald test to compare the positive and negative changes institutional quality has brought to tourism inflow. The results of the Wald test in Table5confirm that there exist an asymmetric long-run and short-run relationship between institutional quality and tourism inflow in selected countries. The Wald statistics for both short and long-run dynamics are significant, which implies that it is important to understand the policy implications considering both positive and negative impacts. This also means the selection of asymmetric modelling for the present study.
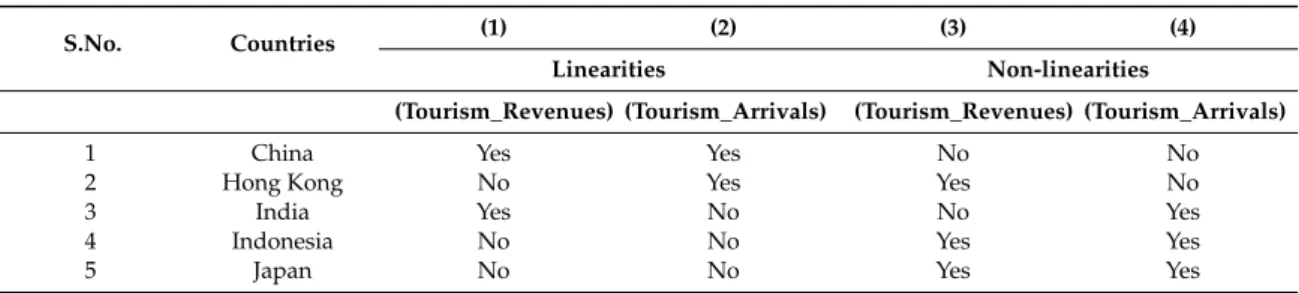
Table 5.Linearities and non-linearities at the country level.
S.No. Countries (1) (2) (3) (4)
Linearities Non-linearities
(Tourism_Revenues) (Tourism_Arrivals) (Tourism_Revenues) (Tourism_Arrivals)
1 China Yes Yes No No
2 Hong Kong No Yes Yes No
3 India Yes No No Yes
4 Indonesia No No Yes Yes
5 Japan No No Yes Yes
Table 5.Cont.
S.No. Countries (1) (2) (3) (4)
Linearities Non-linearities
(Tourism_Revenues) (Tourism_Arrivals) (Tourism_Revenues) (Tourism_Arrivals)
6 Malaysia No No Yes Yes
7 South Korea No Yes Yes No
8 Singapore No No Yes Yes
9 Thailand No No Yes Yes
4.3. Identifying Linearities and Non-Linearities at Country-level
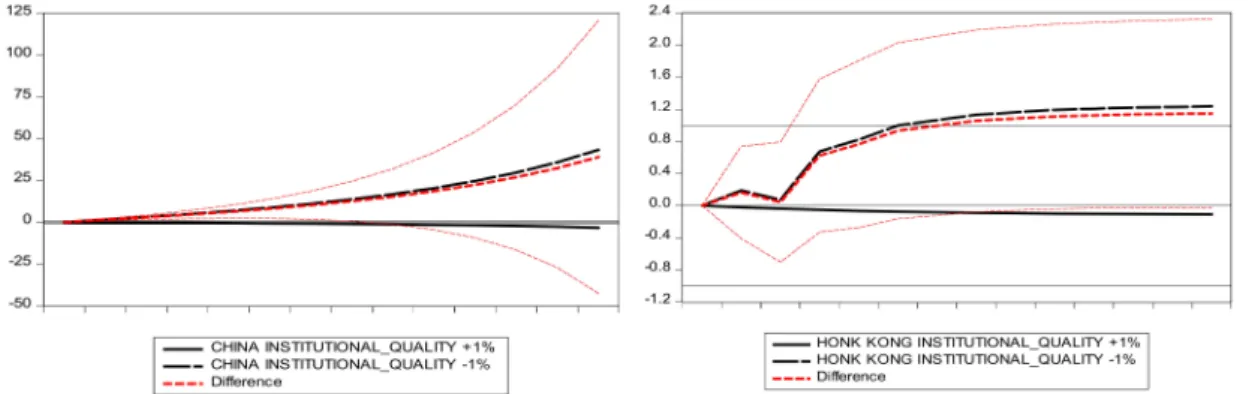
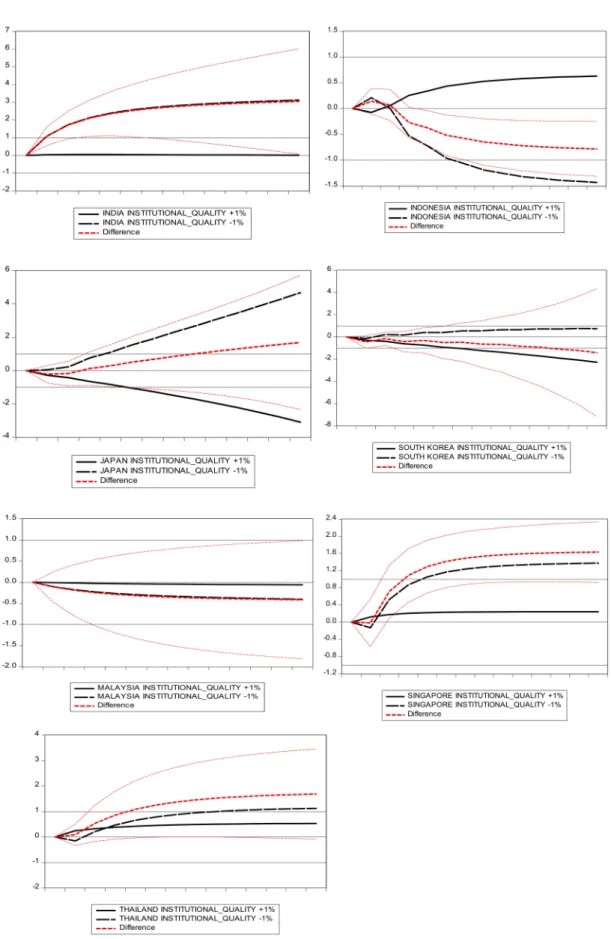
We further break down the analysis to identify the linearities and non-linearities at the country level. Table5corroborates these results in nine selected countries, which reveals that in China and India the association between institutional_quality and tourism_revenues is linear, while a non-linear association of institutional quality with tourism_revenues is witnessed in Hong Kong, Indonesia, Japan, Malaysia, South Kores, Singapore, and Thailand. With an alternative measure of tourism inflows such as tourism_arrivals, we find that the connection is linear in the case of China, India, and South Korea, while in Hong Kong, Indonesia, Japan, Malaysia, Singapore, and Thailand the nexus of institutional quality and tourism_arrivals is non-linear. The case of Hong Kong, India, and South Korea appears much more complex in terms of inconsistency because both measures of tourism inflows tell different stories. The nonlinear patters of institutional quality are also shown in Figure1as NARDL multiplier graphs. These mixed results using two measures of tourism inflows appear to be behaving differently from institutional quality. This implies that policymakers need to understand the unique nature of each economy in the sample, and to consider separately the different patterns of behaviour in order to effectively formulate related policies.
The findings provide insight to assist the formulation of a policy designed to maintain a conducive institutional framework that can safeguard the interests of tourists, including security, friendly visa policies, and more importantly, controlling for any political unrest that may threaten the tourists arriving in these countries. Although the institutional quality within these economies looks sound, there is room for improvement because the institutional quality is not the same in all these countries.
Specifically, a decline in the patterns of institutional quality discourages international tourists, which raises serious challenges for policymakers in terms of the reforms which need to be introduced to improve the institutional framework. The policies introduced in this regard would lead the respective economies towards self-reliance. In addition, tourism inflow in these countries makes a considerable contribution to economic prosperity in the region. Therefore, policies to utilize the revenues received from tourism inflow should be put in place to promote the infrastructure and related facilities associated with the popular tourist locations.
Figure 1.Cont.
Figure 1.NARDL Multiplier Graphs (tourism arrivals).
4.4. Identifying the Threshold Level
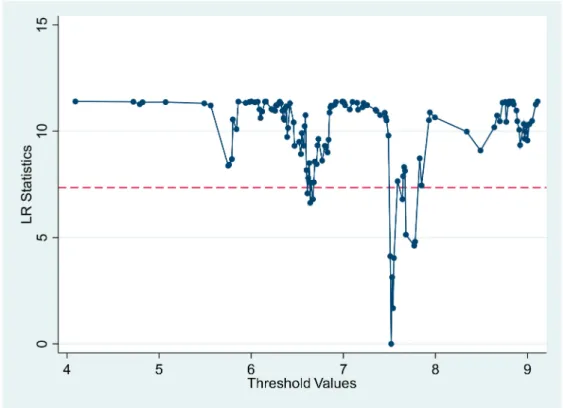
Using a panel threshold approach [57,58] we first estimate the single threshold model and, interestingly, find a 7.52 level which is significant at 5%. We further test multiple threshold models by
using two and three threshold mechanisms. Interestingly, the results reported in Table6and Figure2 confirm only one significant threshold (7.52), which implies that using a sample of 9 Asia-Pacific economies and the institutional quality index from Fraser Institute, the threshold point of 7.52 is critical, and indicates a point at which the effect of institutional quality on tourism inflows turns in either direction. The findings offer important policy inputs for regulators and policymakers to maintain a minimum level of institutional quality of at least 7.52 points, in order to yield positive benefits of tourism inflows because when institutional quality drops below this point, it results in a negative impact on tourism inflows. To be more specific, policymakers in China, India, Indonesia, South Korea, Malaysia, and Thailand need to pay serious attention to raise institutional quality above the 7.52 threshold point. Although the tourism inflows in these economies are progressive, they have not reached a level above which they can contribute optimally to economic sustainability.
Table 6.Threshold Estimation.
Threshold Threshold
Value F-stat p-Value Critical Value
at 10%
Critical Value at 5%
Critical Value at 1%
Single 7.52 11.79 0.044 9.969 11.211 13.717
Double 7.47 6.50 0.344 9.513 10.908 14.113
Triple 6.64 4.83 0.548 9.334 11.076 13.604
Note: In Table6only the single threshold is significant at 10% and 5%, while double and triple thresholds are insignificant.
Figure 2.Threshold Graph (tourism arrivals).
5. Conclusions
From an ideal perspective, the existence of the tourism industry in a country/region is a blessing because of the anticipated benefits in the form of economic prosperity, job creation, accumulation of foreign exchange, and earning tourism revenues [60,61]. Turning this idealistic state into reality means there must be a pivotal role for institutions that optimize the desired benefits. The present study examines the asymmetric role of institutional quality in stimulating tourism inflows in nine high tourist Asia Pacific countries using a panel dataset from 1980 to 2018. The study
extends the institutions—tourism literature, adding asymmetric evidence using a robust NARDL approach [16]. NARDL is an extended version of ARDL. Both models can capture long-run and short-run relationships—NARDL adds a unique feature by determining the asymmetries in long-run and short-run dynamics. We find that in the long-run, stronger (weaker) institutional quality among selected countries asymmetrically stimulates (hinders) the demand for tourism inflow. However, there is weak evidence of short-run asymmetries. Furthermore, in-depth analyses of each country show that except for China, institutional quality and tourism inflow co-move. However, the cointegration varies with respect to the measure of tourism inflow. We conclude that our findings are robust to the alternative measures of tourism inflow. The study offers useful policy inputs for devising short and long-run policies for the improvement of the institutional framework in the region by understanding the asymmetric impact of institutional quality on tourism inflow.
The study provides evidence for the existence of a non-linear long-run impact of institutional quality on the tourism demand. Therefore, applying only linear symmetric methods for institution-tourism models may provide misleading inferences. Adding to the literature of tourism modelling, the study provides an examination of both short and long-run potential impacts by using the NARDL cointegration methodology. Considered as a sunshine sector in the world, the tourism industry should be effectively managed while minimizing its exposure to political instability and poor governance.
For policymakers, the findings suggest that the non-linearity of institutional quality may hinder the socio-economic gains of the tourism industry, interrupting growth and development. There is a further need for political stability and progressive institutions to avoid any negative impacts on tourism inflows, especially in tourism-driven Asian Pacific economies.
Author Contributions:J.O., Z.L., and J.P. conceived and designed the experiments. M.N.A.T. analyzed the data.
Z.L., M.A.K. (Muhammad Atif Khan), and J.O. contributed analysis tools. M.N.A.T. and M.A.K. (Muhammad Asif Khan) wrote the paper. All authors have read and agreed to the published version of the manuscript.
Funding:This research received no external funding.
Acknowledgments:This research was supported by theÚNKP-19-4-DE-147 New National Excellence Program of the Ministry for Innovation and Technology, and by the János Bolyai Research Scholarship of the Hungarian Academy of Sciences.
Conflicts of Interest:The authors declare no conflicts of interest.
References
1. Pablo-Romero, M.D.P.; Molina, J.A. Tourism and economic growth: A review of empirical literature.Tour.
Manag. Perspect.2013,8, 28–41. [CrossRef]
2. Seetanah, B. Assessing the dynamic economic impact of tourism for island economies.Ann. Tour. Res.2011, 38, 291–308. [CrossRef]
3. Du, D.; Lew, A.A.; Ng, P.T. Tourism and economic growth.J. Travel Res.2016,55, 454–464. [CrossRef]
4. Pratt, S. The economic impact of tourism in SIDS.Ann. Tour. Res.2015,52, 148–160. [CrossRef]
5. Webster, C.; Ivanov, S. Transforming competitiveness into economic benefits: Does tourism stimulate economic growth in more competitive destinations?Tour. Manag.2014,40, 137–140. [CrossRef]
6. Tang, C.F.; Tan, E.C. Does tourism effectively stimulate Malaysia’s economic growth?Tour. Manag.2015,46, 158–163. [CrossRef]
7. Balli, E.; Sigeze, C.; Manga, M.; Birdir, S.; Birdir, K. The relationship between tourism, CO2 emissions and economic growth: A case of Mediterranean countries.Asia Pac. J. Tour. Res.2019,24, 219–232. [CrossRef]
8. Remenyik, B.; Tóth, G.; Dávid, L.; Szücs, C.; Vasa, L.; Uakhitova, G. Lakes under Pressure: Data on the Development of Lake Tourism in Hungary. Available online:https://docplayer.net/21748706-Lakes-under- pressure-data-on-the-development-of-lake-tourism-in-hungary.html(accessed on 5 February 2020).
9. Tóth, G.; Dávid, L.D.; Vasa, L. The role of transport in European tourism flows.Acta Geogr. Slov.2014,54, 311–320. [CrossRef]
10. Máté, D. Impact of human capital on productivity growth in different labour-skilled branches.Acta Oecon.
2015,65, 51–67. [CrossRef]
11. World Tourism Organization. UNWTO Tourism Highlights 2017 Edition. Available online:https://www.
unwto.org/archive/global/publication/unwto-tourism-highlights-2017(accessed on 5 February 2020).
12. Tang, X.; Yao, X. Do financial structures affect exchange rate and stock price interaction? Evidence from emerging markets.Emerg. Mark. Rev.2018,34, 64–76. [CrossRef]
13. Crotti, R.; Misrahi, T.The Travel & Tourism Competitiveness Report 2017—Paving the Way for A More Sustainable and Inclusive Future; Word Econmic Forum: Geneva, Italy, 2017; pp. 1–387.
14. Li, C.; Pervaiz, K.; Asif Khan, M.; Ur Rehman, F.; Oláh, J. On the Asymmetries of Sovereign Credit Rating Announcements and Financial Market Development in the European Region.Sustainability2019,11, 6636.
[CrossRef]
15. Rehman, F.U.; Khan, M.; Khan, M.A.; Pervaiz, K.; Liaqat, I. The Causal, Linear and Nonlinear Nexus Between Sectoral FDI and Infrastructure in Pakistan: Using A New Global Infrastructure Index.Res. Int. Bus. Financ.
2019,52, 101129. [CrossRef]
16. Shin, Y.; Yu, B.; Greenwood-Nimmo, M. Modelling Asymmetric Cointegration and Dynamic Multipliers in a Nonlinear ARDL Framework. InFestschrift in Honor of Peter Schmidt; Springer: Berlin, Germany, 2014;
pp. 281–314.
17. North, D.Institutions, Institutional Change and Economic Performance; Cambridge University Press: New York, NY, USA, 1990.
18. Acemoglu, D.; Johnson, S.; Robinson, J.A. Reversal of fortune: Geography and institutions in the making of the modern world income distribution.Q. J. Econ.2002,117, 1231–1294. [CrossRef]
19. Acemoglu, D.; Johnson, S.; Robinson, J.A. The colonial origins of comparative development: An empirical investigation.Am. Econ. Rev.2001,91, 1369–1401. [CrossRef]
20. Khan, M.A.; Máté, D.; Abdulahi, M.E.; Sadaf, R.; Khan, M.A.; Popp, J.; Oláh, J. Do institutional quality, innovation and ICT technologies promote financial market development?Eur. J. Int. Manag.2020. [CrossRef]
21. Khan, M.A.; Ilyas, R.M.A.; Hashmi, S.H. Cointegration between Institutional Quality and Stock Market Development.NUML Int. J. Bus. Manag.2018,13, 90–103.
22. Dutt, P.; Traca, D. Corruption and bilateral trade flows: Extortion or evasion? Rev. Econ. Stat. 2010,92, 843–860. [CrossRef]
23. Tang, C.F. The impacts of governance and institutions on inbound tourism demand: Evidence from a dynamic panel data study.Asia Pac. J. Tourism Res.2018,23, 1000–1007. [CrossRef]
24. Mura, L. Enterpreneurship internationalization—Case of Slovak family businesses.Ad Alta J. Interdiscip. Res.
2019,9, 222–226.
25. Lee, S. Research note: Quality of government and tourism destination competitiveness.Tour. Econ.2015,21, 881–888. [CrossRef]
26. De Vita, G.; Kyaw, K.S. Tourism specialization, absorptive capacity, and economic growth.J. Travel Res.2016, 56, 423–435. [CrossRef]
27. Seetanah, B.; Durbarry, R.; Ragodoo, J.N. Using the panel cointegration approach to analyse the determinants of tourism demand in South Africa.Tour. Econ.2010,16, 715–729. [CrossRef]
28. Yap, G.; Saha, S. Do political instability, terrorism, and corruption have deterring effects on tourism development even in the presence of UNESCO heritage? A cross-country panel estimate.Tour. Anal.2013, 18, 587–599. [CrossRef]
29. Slusarczyk, B.; Smolag, K.; Kot, S. The supply chain of a tourism product. Actual Probl. Econ. 2016,179, 197–207.
30. Khan, M.A.; Khan, M.A.; Abdulahi, M.E.; Liaqat, I.; Shah, S.S.H. Institutional quality and financial development: The United States perspective.J. Multinatl. Financ. Manag.2019,49, 67–80. [CrossRef]
31. Khan, M.A.; Kong, D.; Xiang, J.; Zhang, J. Impact of Institutional Quality on Financial Development:
Cross-Country Evidence based on Emerging and Growth-Leading Economies.Emerg. Mark. Finance and Trade2019,56, 1–17. [CrossRef]
32. Balaguer, J.; Cantavella-Jorda, M. Tourism as a long-run economic growth factor: The Spanish case.Appl.
Econ.2002,34, 877–884. [CrossRef]
33. Habibi, F. The determinants of inbound tourism to Malaysia: A panel data analysis.Curr. Issues Tour.2017, 20, 909–930. [CrossRef]
34. Kadir, N.; Karim, M.Z.A. Demand for Tourism in Malaysia by UK and US Tourists: A Cointegration and Error Correction Model Approach. InAdvances in Tourism Economics: New Developments; Matias,Á., Nijkamp, P., Sarmento, M., Eds.; Physica-Verlag HD: Heidelberg, Germany, 2009; pp. 51–71.
35. Ooi, C.-A.; Hooy, C.-W.; Mat Som, A.P. Tourism crisis and state level tourism demand in Malaysia.Int. J. Bus.
Soc.2013,14, 376–389.
36. Salleh, N.H.M.; Othman, R.; Noor, A.H.S.M.; Hasim, M.S. Malaysian tourism demand from the Middle East market: A preliminary analysis.Int. J. West Asian Stud.2010. [CrossRef]
37. Salleh, N.H.M.; Othman, R.; Ramachandran, S. Malaysia’s tourism demand from selected countries: The ARDL approach to cointegration.Int. J. Econ. Manag.2007,1, 345–363.
38. Tang, C.F.; Tan, E.C. The determinants of inbound tourism demand in Malaysia: Another visit with non-stationary panel data approach.Anatolia2016,27, 189–200. [CrossRef]
39. Tan, A.Y.; McCahon, C.; Miller, J. Stability of inbound tourism demand models for Indonesia and Malaysia:
The pre-and postformation of tourism development organizations. J. Hosp. Tour. Res. 2002,26, 361–378.
[CrossRef]
40. Nonthapot, S. Mediation between tourism contribution and economic growth in the greater Mekong subregion.Asia Pac. J. Tour. Res.2016,21, 157–171. [CrossRef]
41. Kurowska-Pysz, J.; Szczepa ´nska-Woszczyna, K.; Štverková, H.; Kašík, J. The catalysts of cross-border cooperation development in Euroregions.Pol. J. Manag. Stud.2018,18, 180–193. [CrossRef]
42. Valaskova, K.; Kliestik, T.; Kovacova, M. Management of financial risks in Slovak enterprises using regression analysis.Oeconomia Copernic.2018,9, 105–121. [CrossRef]
43. Ghalia, T.; Fidrmuc, J.; Samargandi, N.; Sohag, K. Institutional quality, political risk and tourism. Tour.
Manag. Perspect.2019,32, 100576. [CrossRef]
44. Yeh, C.M. Does board governance matter for foreign institutional investors to invest in listed tourism firms?
Tour. Manag.2018,68, 66–78. [CrossRef]
45. Luo, F.; Moyle, B.D.; Bao, J.; Zhong, Y. The role of institutions in the production of space for tourism: National Forest Parks in China.For. Policy Econ.2016,70, 47–55. [CrossRef]
46. Badola, R.; Hussain, S.A.; Dobriyal, P.; Manral, U.; Barthwal, S.; Rastogi, A.; Gill, A.K. Institutional arrangements for managing tourism in the Indian Himalayan protected areas.Tour. Manag.2018,66, 1–12.
[CrossRef]
47. Balli, F.; Balli, H.O.; Louis, R.J. The impacts of immigrants and institutions on bilateral tourism flows.Tour.
Manag.2016,52, 221–229. [CrossRef]
48. Durana, P.; Kral, P.; Stehel, V.; Lazaroiu, G.; Sroka, W. Quality Culture of Manufacturing Enterprises:
A possible way to adaptation to Industry 4.0.Soc. Sci.2019,8, 124. [CrossRef]
49. Máté, D. Human capital, unions and productivity in a labour-skilled sectoral approach.Soc. Econ.2014,36, 369–385. [CrossRef]
50. Saha, S.; Yap, G. The moderation effects of political instability and terrorism on tourism development:
A cross-country panel analysis.J. Travel Res.2014,53, 509–521. [CrossRef]
51. Demir, E.; Gozgor, G. Does freedom of the press enhance inbound tourism? Curr. Issues Tour. 2019,22, 2550–2565. [CrossRef]
52. Gozgor, G.; Lau, C.K.M.; Zeng, Y.; Lin, Z. The effectiveness of the legal system and inbound tourism. Ann.
Tour. Res.2019,76, 24–35. [CrossRef]
53. Levin, A.; Lin, C.-F.; Chu, C.-S.J. Unit root tests in panel data: Asymptotic and finite-sample properties.
J. Econom.2002,108, 1–24. [CrossRef]
54. Im, K.S.; Pesaran, M.H.; Shin, Y. Testing for unit roots in heterogeneous panels.J. Econom.2003,115, 53–74.
[CrossRef]
55. Pesaran, M.H. A simple panel unit root test in the presence of cross-section dependence.J. Appl. Econom.
2007,22, 265–312. [CrossRef]
56. Huang, J.; Liu, Q.; Cai, X.; Hao, Y.; Lei, H. The effect of technological factors on China’s carbon intensity:
New evidence from a panel threshold model.Energy Policy2018,115, 32–42. [CrossRef]
57. Hansen, B.E. Sample splitting and threshold estimation.Econometrica2000,68, 575–603. [CrossRef]
58. Hansen, B.E. Threshold effects in non-dynamic panels: Estimation, testing, and inference.J. Econom.1999, 93, 345–368. [CrossRef]
59. Mariyakhan, K.; Mohamued, E.A.; Asif Khan, M.; Popp, J.; Oláh, J. Does the Level of Absorptive Capacity Matter for Carbon Intensity? Evidence from the USA and China.Energies2020,13, 407. [CrossRef]
60. De Bruyn, C.; Meyer, N.; Meyer, D.F. Assessing the dynamic economic impact of tourism in a developing region in South Africa.J. Econ. Beh. Stud.2018,10, 274–283.
61. Meyer, D.F.; Meyer, N. The role of tourism on Local Economic Development: A comparative study.Afr. J.
Phys. Health Educ. Recreat. Danc.2015,A2, 197–214.
©2020 by the authors. Licensee MDPI, Basel, Switzerland. This article is an open access article distributed under the terms and conditions of the Creative Commons Attribution (CC BY) license (http://creativecommons.org/licenses/by/4.0/).