I
n today’s increasingly globalized economy, FDI by transnational corporations is considered as a major dri- ver of the economic development of less developed econo- mies, including the CEE (Pavlínek, 2015).In the last decades the Central Eastern European region was very popular in terms of foreign direct investments of primary Western European firms (Gál – Juhász, 2016). The key attractive elements of the CEE countries have been among others the central location (close to Western European countries) and the cheap and qualified labour force (Schuh, 2013).
For investors, the market had significant potential with tens of millions of inhabitants (Tondel, 2001).
However, besides these attractive features, the CEE countries also had political and economic instability, poor physical and institutional infrastructure (Tondel, 2001) and some further repulsive characteristics, which are the results and residuum of the planned economy structure (Schuh, 2013).
This study examines the FDI attractiveness of ten countries and introduces a special activity, called near- shoring. The research provides supporting quantitative evidence for the hypothesis that CEE countries can still be attractive for investors ahead of some Western European countries. The paper uses datasets from IMF, World Bank, WEF and Economist Intelligence Unit (EIU) for ten countries: four from Western Europe and six from Eastern Europe. The article is organized as follows: the first part is a general description of the region and its FDI attractiveness in the last decade, the second presents the concept of near-shoring and its relevance to the CEE region. The third chapter describes the theoretical framework of the model with its factors and data, while the fourth discusses the main findings, where the results of the attractiveness model concentrates only on the year
2016 to show the most recent features of the countries.
The final part offers some concluding remarks.
Investing in Central and Eastern Europe
“Central and Eastern European Countries” is an OECD term for the group of countries comprising Albania, Bul- garia, Croatia, the Czech Republic, Hungary, Poland, Ro- mania, the Slovak Republic, Slovenia, and the three Baltic States: Estonia, Latvia and Lithuania (OECD, 2001). This paper focuses only on six of these countries, i.e. on the Czech Republic, Hungary, Poland, Slovakia, Slovenia and Romania, because of their common history and central lo- cation.
In the CEE region similar tendencies of foreign direct investment were observable after the transition process and in the beginning of the 2000s, because the key investment motives remained the same: Western European investors have entered the CEE region in line with their expanding strategies before the great financial crisis. The motives of the expansion were mainly the lower production- and labour costs, skilled workers, cheap resources, site availability and suitability, low corporate taxes and availability of investment incentives (Allen – Overy, 2011;
Skanksa – JLL – Dentons – ABSL, 2016). There was a friendly and attractive climate for foreign investments at that time as well.
In general, the business model of the expanding companies to the CEE offered foreign entrants higher return on investments than their home countries, until 2008 (Schuh, 2012). However, despite higher growth rates and lower costs, investors faced several issues in CEE:
there was a high risk of doing business because in these transition countries the institutional frameworks, the bureaucracy and the court systems were not as developed
BEING AN INVESTMENT TARGET IN CEE
COUNTRY ATTRACTIVENESS AND NEAR-SHORING LŐRINCZ, NOÉMI
The Central Eastern European (CEE) region was relatively popular from foreign direct investors’ perspective after the fall of the iron curtain e.g. because of cheap labour force and reachable resources in relatively good quality (Balázs et al., 2014).
Since then, significant changes occurred in the economy of the region, including the great financial crisis (2008/2009) with effects observable for a long time. This paper surveys an answer defining which CEE countries remained appealing for foreign direct investment (FDI), and introduces the notion of a special investment activity, the so called near-shoring, which is also observable in some of the countries in the region. Near-shoring means that companies – because of different reasons (e.g. high operational costs or increasing labour costs in the country where they are present after an outsourcing process) – move their operation into a third country, which is close to its home location (Stehrer et al., 2012; Stentoft, J. et al., 2015). To deliver this answer, the author has used a simplified model based on the idea of the Global Competitiveness Index from Schwab (2016). This model consists of the three main indicators (labour, macroeconomic performance and investment climate) that companies may consider before initiating an FDI activity in CEE, which can also be a near-shoring eventually. The main finding of the paper is a list of the most relevant countries regarding foreign direct investments.
Keywords: CEE, country attractiveness, FDI, near-shoring
as in Western Europe. Furthermore, the status of weak civil and political rights also prevented countries to become attractive for FDI (Pournarakis – Varsakelis, 2002). The fact, that majority of CEE countries became member of the EU and introduced EU regulations and directives consequently, had positive effects on these kinds of issues.
The new regulatory systems had a risk reducing effect in general, and the EU membership is a strong guaranty for a transparent legal environment (Barry, 2002; Popescu, 2014).
In CEE countries’ GDP levels there was a fallback characteristic in the year 2009, with the magnitude of the impact varied across countries (European Central Bank, 2010). A year later the economies of the region could catch up slowly and managed to improve their performance, especially in countries with large manufacturing sectors like the Czech Republic and Slovakia (Schuh, 2012). The effects of the crisis threatened the business operations and strategies of the region’s companies, and the managers had to deal with them quickly to find solutions for potential changes. Only a handful of firms were planning new long-term strategy measures like M&A or changes in the capital structure. Expenditures were stopped at this time;
the liquidity security and cost structure security were on the top of the short-term strategic agenda (Roland Berger Strategy Consultants, 2009). After a “stand-by” mode in the years 2008-2009, companies became interested in market entry and expansions again.
CEE countries strived to attract FDI by developing legislation, rules and procedures and the efforts were successful: from 2009 to 2010 in Hungary and in Poland FDI levels increased by 38% and 40% (Allen – Overy, 2011). Sizeable consumer pools, skilled labour-force and resources of the CEE countries remained unaffected by the crisis. The results of an Ernst – Young survey from 2011 with international executives showed that after Western Europe and China, CEE was the third most attractive foreign investment location and the second most attractive for investments in manufacturing. However, investors were also interested in other countries in the wider CEE, like Bulgaria, Croatia, Serbia, Ukraine and Turkey (Allen – Overy, 2011). In the last two years the economic growth in CEE was significant, investment has increased with FDI and EU funds were also playing an important role (Szalavetz, 2017).
Companies operating in the region are mostly global and European players from consumer and industrial goods (Danone, General Electric, P&G, etc.), automotive industry (Audi, Mercedes, Suzuki, Toyota, Volkswagen etc.), especially in the Czech Republic, Hungary, Poland, Slovakia and Slovenia and service providers (T-Mobile, Tesco, etc.) (Schuh, 2012). The automotive sector is one of the most important industry sectors operating in the CEE.
It had a turnover of ca. EUR 150 billion and a growth of 170% between 2009 and 2014. There are more than 40 manufacturers present in the CEE, producing over 3.5 million vehicles yearly (ING, 2015).
Recently, the region developed faster than Western Europe, where the EU funds, a strong domestic demand
and low commodity prices also play a crucial role: in 2015 CEE’s GDP growth (3.1%) was ca. double that of the Euro area (1.6%) (Skanksa – JLL – Dentons – ABSL, 2016).
The Czech Republic, Poland, Romania and Slovakia will stay among the fastest growing economies in the EU in the next couple of years, as stated by the World Bank Group (2015).
Near-shoring
Near-shoring companies move their offshored manufac- turing activity closer to their home countries, because of shorter lead times, easier way of control, cheaper labour- and delivery costs (Stehrer et al., 2012; Stentoft, J. et al., 2015). In Europe the term is used in the context of offshor- ing to Central and Eastern Europe (Stehrer et al., 2012).
‘Backshoring’ or re-shoring is used, when companies, because of different reasons (e.g. operational costs, oper- ations management, quality problems, loss of knowledge, extended and uncertain lead times, etc.), move their pre- viously offshored activities back to their original location (Stehrer et al., 2012). The relocation generates FDI and international trade (Sass – Hunya, 2014). Both near-shor- ing and re-shoring result in job creation in the receiving countries. Furthermore, near-shoring firms in general pay higher salaries, spend more on research and development (Stentoft et al, 2015). Re-shoring and near-shoring – as different types of foreign direct investment – are not only characteristic for larger firms, even small and medium enterprises (SMEs) consider moving manufacturing off- shore. For the EU15 countries near-shore locations are es- pecially in the CEE region (Bobirca, 2007). Key levers are:
cost advantages relative to Western European economies, close alignment of time zones, capabilities (expertise in IT, engineering and automotive), educated skills and close cultural connectivity (Baldwin, 2016; Coleman, 2015).
Outsourcing and offshoring are major drivers in the global economy, especially in the Information Technology sector (IDG Connect, 2015). IT outsourcing is getting more important in the EU. The UK and Ireland invested a large amount of their IT budget into offshoring, the continental Europe is a “newcomer” in this sense. We can also find examples for offshoring (near-shoring) by Western European manufacturing firms into the Central Eastern European region: in 2011 the AWS Electronics Group – a leading independent electronic manufacturing solutions (EMS) provider – has announced the opening of a new purpose-built facility in Slovakia. New projects and growing orders have enabled the company to expand its operations in CEE. According to the company, costs at the Slovakian facility are comparable with countries in Asia, like China or Malaysia, which results in “back-shoring”
activities by some customers from South-East Asia to CEE (AWS, 2014). But we can find further examples in the region: in Poland Sabre and Motorola have near- shored software development centres, while Comarch, Capgemini and HCL are active in the IT consulting field. In Romania IT and business process providers have bases, such Accenture, Capgemini, Genpact, Luxoft and
Wipro (Coleman, 2015). Not just IT skills, but human resources, finance, sales and customer service functions are also being outsourced through near-shoring (Coleman, 2015). “Balancing cost-savings with other benefits, such as access to skills, greater speed to market or improved control over the supply chain, are important variables to consider.” – said Mark Craddock, global business services director at Deloitte (Coleman, 2015).
For the UK the nearest and most suitable near- shoring market is CEE, namely the Baltics, Bulgaria, the Czech Republic, Poland, Slovakia, Romania and also Turkey (IDG Connect, 2015). CEE adopts global service models increasingly: 30% of the top global outsourcing companies are already in the region. According to World Bank’s ‘Ease of Doing Business’ rankings, CEE is ranked ahead of other globally competitive O-O (Outsourcing – Offshoring) regions (Baldwin, 2016). Why could CEE be attractive over other parts of the world as possible offshoring destination?
For both near- and re-shoring firms there is a wide range of investment incentives in the CEE region from the micro to the macro level:
– cheap labour costs,
– qualified workers/available skills (university degree, English-knowledge, etc.),
– good location and infrastructure/improved speed to market and control over the supply chain/better control over the intellectual property,
– low corporate tax rate, – attractive economies of scale, – local domestic economic growth, – political stability,
– nearby time zones,
– cultural familiarities, etc. (IDG Connect, 2015;
Coleman, 2015).
According to Coleman, as the labour cost gap between Europe and Far East is getting closer, but the demand for speed and flexibility is rising, near-shoring is one of the viable solutions for many UK firms. If some of the factors above are failing or missing, near-shoring can have disad- vantages too. For example, the main challenges for Kabbee (producing software application, which company near- shored its operation from the UK to Kiev) were the lack of proficiency in English. Intensive English lesson should have been provided by the company to its Ukrainian em- ployees (Coleman, 2015).
Country attractiveness for foreign direct investments
The Global Competitiveness Index (GCI) measures the competitiveness of 138 countries in the world and ranks them every year according to their productivity and pros- perity (Schwab, 2016).
Based on this idea I built a simplified model and tried to determine a measurement mix of attractiveness.
In general, industry types and company activities define
the crucial factors of FDI, e.g. for manufacturer with high turnover on bulky products, the infrastructure and transport possibilities are important, while for service industries with research and development centers the availability of skilled labour is the key decision criteria (Allen – Overy, 2011).
According to Popescu (2014), a sound macroeconomic environment with low inflation rates results in stronger FDI inflow in CEE countries. He also states that the quality of infrastructure does not influence the FDI attractiveness capabilities of the CEE countries. A report from Allen – Overy states that the 6 most important factors for FDI investors in CEE are the real estate costs, the taxation system in a country, the labour issues, the transportation, the access to target markets and the economic stability. Based on the existing literature about near-shoring, for companies the most important indicators are the skilled and low cost labour, the growth rate of a country, the quality of the infrastructure, the corporate taxation, the legal rights and government policy (IDG Connect, 2015; Coleman, 2015). Therefore, I also included these variables in my analysis (weights are between 5% and 30%). Based on my model I would like to find the most attractive CEE countries for the investment activities of Western firms.
Observed countries
The question often arises, how should we consider CEE:
as a whole region, or as a group of individual countries?
As many countries in the CEE region are culturally highly diverse (Ying et. al., p. 191), I believe that countries should be considered individually rather than as a whole region homogenously, where also a broad strategy review should consider every possible level: the global, the regional and the national one (Ghemawat, 2005). For this reason, I an- alyzed the countries of the region separately, but based on the country level analysis inferences also for the whole re- gion can be drawn. I have collected data and applied the model for the following 10 countries:
Observed Western
European countries: Observed CEE countries:
1. Austria 1. Czech Republic
2. France 2. Hungary
3. Germany 3. Poland
4. Italy 4. Romania
5. Slovakia 6. Slovenia Attractiveness model
A.T. Kearney, a global management consulting company, publishes the so called Global Services Location Index (GSLI) every year. The GSLI analyses the capabilities of 55 European countries for offshoring across three ma- jor categories: financial attractiveness, people skills and availability, and business environment. Information tech- nology, business process outsourcing and voice services are in the scope, and the assessment is based on 38 metrics (A.T. Kearney, 2016).
Based on the methodology of A.T. Kearney’s GSLI and the global competitiveness index, my simplified model consists of the following three main categories with equal weights:
1. labour and employment (33.33%), 2. macroeconomic performance (33.33%), 3. business and investment climate (33.33%).
Each of the categories have 5 to 9 variables with different weights. The following table presents Austria as an exam- ple, in my data tables every country has its own calcula- tion.
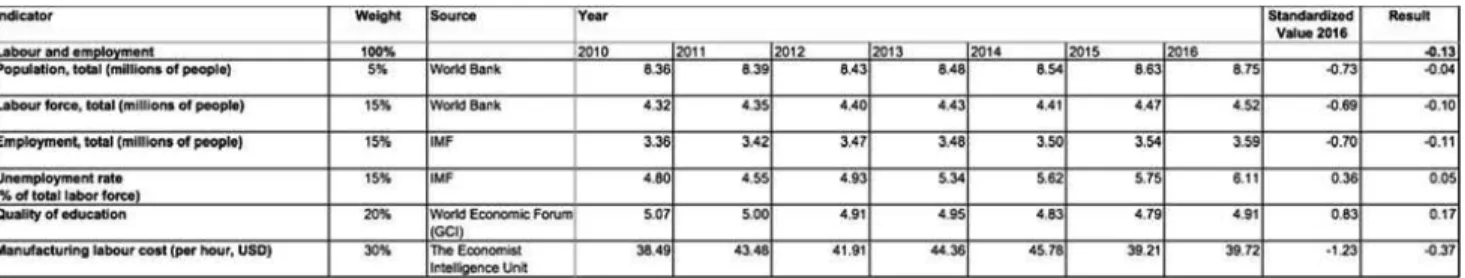
Labour and employment
The first pillar, ‘Labour and employment’ comprises 6 variables: total population, total labour force, total em- ployment, unemployment rate, quality of education and manufacturing labour cost per hour. Based on the previ- ous literature overview, for investing companies the cheap but skilled labour is crucial, therefore the total labour cost and the quality of education are the most important vari- ables in this pillar with 30% and 20% weights in the mod- el. Labour force, employment and unemployment rate, as the second most important variables are weighted by 15%
(Table 1).
Columns ‘Year 2010-2016’ contain original nominal data from different databases (World Bank, IMF, WEF and EIU) and the column ‘Standardized value 2016’ contains the standardized values of each variable for the year 2016.
‘Result’ contains the weighted values, e.g. in the case of the variable Population: 5%*(-0.73) = (-0.04).
Adding up each weighted numbers and multiplying the result by the weight of the first pillar (33.33%) we get: [(-0.04) + (-0.10) + (-0.11) + (0.05) + (0.17) + (-0.37)] * 33.33% = -0.13.
Macroeconomic performance
The second pillar, the ‘Macroeconomic performance’
contains 5 variables: GDP per capita in current USD, the annual GDP growth rate and inflation rate, the current ac- count balance and the FDI net inflow. The annual GDP growth rate and inflation rate are the most relevant vari- ables (30%), because they can reflect the state of the de- velopment of an economy and the change in the consumer prices in the observed countries. GDP per capita (15%) is also important, because the variable in general means that higher spending power attracts more FDI. The FDI net in- flow (15%) shows the presence of other investors and their invested assets. (Table 2)
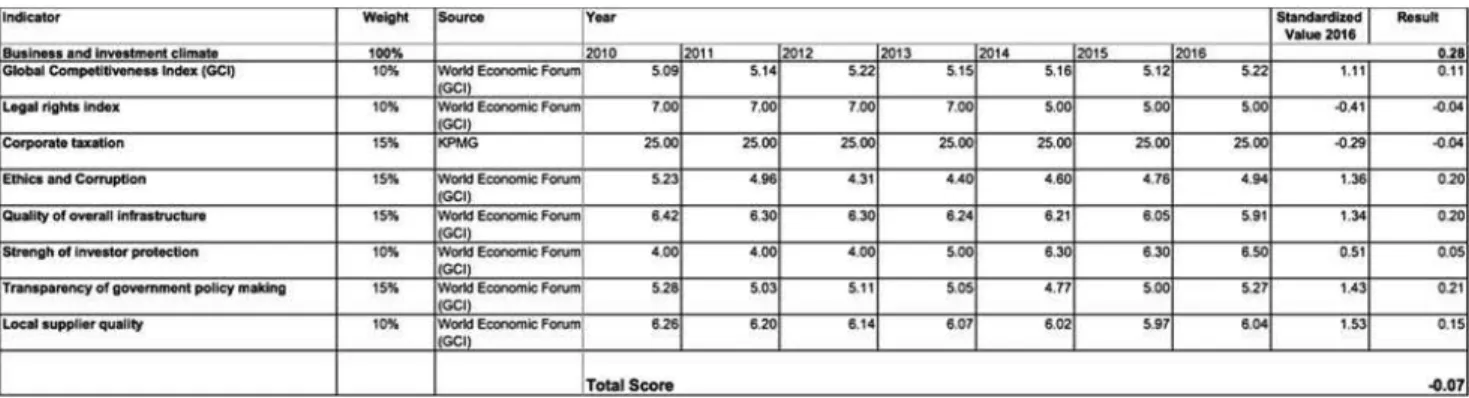
Business and investment climate
The third pillar, called ‘Business and investment climate’
has 8 variables: the Global Competitiveness Index (GCI), the legal rights index, the corporate taxation, the ethics and corruption, the quality of overall infrastructure, the strengths of investor protection, the transparency of gov- ernment policy and the local supplier quality. Based on the
literature, the legal rights index, the corporate taxation, the quality of the infrastructure and the transparency of government policy making received the highest weights (15%) in the model (IDG Connect, 2015; Coleman, 2015).
Ethics and corruption and strengths of investor protection are the second most important factors (10%).
Table 1 Indicator Labour and Employment
Source: Author’s creation Table 2 Indicator Macroeconomic Performance
Source: Author’s creation
In the case of near-shoring, the location of the target country is very crucial. Therefore, I have included the quality of the overall infrastructure, to understand the
physical connectivity between the near-shored operation and the original country. The variable from the World Economic Forum measures not only the transport infra- structure but the electricity and telephony infrastructure as well. Countries in CEE as ex-Soviet countries were notorious about their black and grey economies after the transition process from planned to market economies;
therefore, the variable of ‘Transparency of government policy making’ has a special relevance in this region. The
variable of ‘Ethics and corruption’ shows whether there are still observable signs of the dominance of grey econ- omy with a high grade of corruption and unclear regula- tory frameworks. (Table 3)
When we sum up the results of each pillar, we get the final score of a country, e.g. in the case of Austria the total score is the following: Labour and employment (-0.13) + Macroeconomic performance (-0.22) + Business and investment climate (+0.28) = -0.07
As described before, weights of the three main catego- ries in the model are the same, a value of 33.33%. Accord- ing to the results, the top 3 CEE performers regarding FDI attractiveness in 2016 were Romania (0.24), Poland (0.12) and Slovenia (0.11). Germany, as the best performer in la- bour and employment (0.22) and second best in business and investment climate (0.24), scored 0.49 in total (Table 4, Table 5).
Findings of the model
One reason behind the attractiveness of the CEE region can be the difference in wages: although wages have risen signifi- cantly in recent decades, they still remain lower than in West- ern Europe. Hourly wages in Bulgaria, Croatia, the Czech Republic, Hungary, Poland, Romania, Slovakia and Slovenia are much lower than in EU-15 countries. It has been attractive for new investments and helped to further improve the com-
Table 3 Indicator Business and Climate
Source: Author’s creation
Table 5 Country results for each pillar
Source: Author’s creation Table 4
Results of the calculations for each country
Source: Author’s creation
petitiveness of the countries. Parallel to the wage-advantage, CEE provides other benefits, such as good location and rela- tively high quality in general (Popescu, 2014).
Therefore, as the results of the model show, Central and Eastern Europe could still remain an attractive area for Western European businesses for new supply relations or setting up low-cost production facilities even after the financial crisis of 2008. A lot of CEE countries in the model like Romania, Poland, and Slovenia performed better than the Western European countries of France, Austria and Italy. The largest markets of the regions are Poland and Romania, but in Romania there is a weak institutional development with lack of transparency. The stable economic situation in Poland paired with the tax incentives and the close cultural affinity with the UK make the country an attractive investment target, including near-shoring. The world’s biggest tech companies, like Microsoft and Google, also built outsource centres there (Coleman, 2015). Romania had outstanding growth rates recently (4.82% in 2016) and the corporate taxation rates of 16% can also be considered as the lowest rate in the region.
The weak position of Slovakia can be explained by the relatively unfavorable ethics and corruption environment, suboptimal strength of investor protection, higher unemployment rate and below-peers quality of education.
In the case of Hungary, the muted GDP growth dynamics of 2016, the relatively low supplier and education quality and the limited transparency of government policy making are the key drivers behind the worse-than-expected model results.
Concluding remarks
Foreign direct investment is a significant growth engine for Central Eastern Europe. Advanced business services, IT and back-office operations are the most popular sectors for FDI in Europe, and the CEE region is highly experi- enced in these fields of businesses (Skanska et al., 2016;
Mattoo et al., 2004). Before the great financial and eco- nomic crisis, the CEE expansion offered higher returns on the investments of foreign investors because of the cheap sources, production costs and growth opportunities. The recovery from the crisis has happened relative quickly, countries could retain their appeal regarding the above mentioned factors.
In this paper I searched for the answer, whether CEE countries could be appealing for Western European countries’ potential FDI activities, including near-shoring.
According to the results of my model, Romania, Poland and Slovenia could be one of the most attractive countries to invest. Labour costs, quality of education, growth- and inflation rates, legal rights, corporate taxation, infrastructure and government policy had outstanding roles in the model.
Due to the fact that some of the CEE countries were not subject of my analysis, e.g. Bulgaria, Croatia, Serbia, Ukraine or the Baltic states, further research can be conducted in this topic. In terms of near-shoring, Lithuania for example is very rich in technology talent and therefore
it could be an alternative location to invest (Coleman, 2015).
References
Allen & Overy (2011): CEE you there! Foreign Direct Investment in Central and Eastern Europe. p. 2-13. http://
www.allenovery.com/SiteCollectionDocuments/
Foreig n%20direct%20invest ment%20in%20 Central%20and%20Eastern%20Europe.PDF
A.T. Kearney (2016): Global Services Location Index. On the Eve of Disruption: A new business model threatens established concepts of offshoring and expands the market. p. 1-4.
AWS (2014): EMS Provider AWS Electronics expands Slovakian facility to meet increased Demand.
AWS Electronic Group, Worcester, UK, May 2014 http://www.awselectronicsgroup.com/content/ems- provider-aws-electronics-expands-slovakian-facility- meet-increased-demand (downloaded: 15 October, 2017)
Balázs, Péter – Bozóki, András – Catrina, Stefan – Gotseva, Adelina – Horvath, Julius – Limani, Donika – Radu, Bodgan – Simon, Agnes – Szele, Áron – Tófalvi, Zselyke – Perlaky-Tóth, Krisztina (2014): 25 years after the fall of the Iron Curtain – The state of integration of East and West in the European Union.
European Commission, 2014, EUR 26678 EN, p. 2-91.
Baldwin, J. (2016): Nearshoring or offshoring – global VoIP matters. colt.net 25 April 2016 http://www.colt.
net/blog/2016/04/25/nearshoring-or-offshoring-global- voip-matters/(downloaded: 21 October, 2017)
Barry, F. (2002): EU Accession and Prospective FDI Flows to CEE Countries: A View from Ireland. Dublin:
University College Dublin, August 2002, p. 10.
Bobirca, A. (2007): Near-shoring it – enabled services in an enlarged Europe. Bucharest: Bucharest Academy of Economic Studies, p. 100.
Coleman, A. (2015): Nearshoring: Europe is the new services hub. Raconteur Magazine Published:
December 10, 2015 (downloaded: 15 October, 2017) http://raconteur.net/business/nearshoring-europe-is- the-new-services-hub
European Central Bank (ECB) (2010): The Impact of the Financial Crisis on the Central and Eastern European Countries. Monthly Bulletin, July 2010, p. 85.
Gál, Zoltán – Juhász, Bálint (2016): A vállalatok nemzetköziesedésének vizsgálata Kelet-Közép- Európában makrogazdasági módszerekkel.
Vezetéstudomány, XLVII. ÉVF. 2016. 8. szám, p. 26- Ghemawat, P. (2005): Regional Strategies for Global 29.
Leadership. Harvard Business Review, 2005 December (downloaded: 26 November, 2017) https://hbr.
org/2005/12/regional-strategies-for-global-leadership Guo, Y. – Rammal, H. G. – Dowling, P. J. (2016): Global
Talent Management and Staffing in MNE. International Business and Management Series, v. 32, ISBN: 978-1- 78635-354-2, p. 191.
IDG Connect (2015): Why European nearshoring is definitely an option now. April 20, 2015 http://www.
idgconnect.com/blog-abstract/9770/why-european- nearshoring-definitely-option (downloaded: 19 October, 2017)
ING E-magazine (2015): The View: Connected Europe – A business reality. http://view.ingcb.com/connected- europe-a-business-reality (downloaded: November 15, 2016)
International Monetary Fund (IMF) (2017): World Economic Outlook, October 2017 http://www.imf.
org/external/pubs/ft/weo/2017/02/weodata/index.aspx (downloaded: 22 November, 2017)
KPMG (2016): Corporate Tax Rates Table. https://home.
kpmg.com/xx/en/home/services/tax/tax-tools-and- resources/tax-rates-online/corporate-tax-rates-table.
html (downloaded: 19 October, 2017)
Mattoo, A. – Wunsch–Vincent, S. (2004): Pre-Empting Protectionism in Services: The GATS and Outsourcing.
Journal of International Economic Law, vol. 7(4), December 2004, p. 765-800. https://doi.org/10.1093/
jiel/7.4.765
OECD (2001): Glossary of statistical terms. Central and Eastern European Countries (CEECS), September 25, OECD (2003): Glossary of statistical terms. Unemployed – 2001 ILO https://stats.oecd.org/glossary/detail.asp?ID=2791 (downloaded: October 25, 2017)
OECD (2010): Competitiveness and Private Sector Development. Kazakhstan 2010, Sector Competitiveness Strategy, p. 219.
Pavlínek, P. (2015): Foreign direct investment and the development of the automotive industry in central and eastern Europe. Foreign investment in eastern and southern Europe, p. 209-255.
Popescu, G. H. (2014): FDI and Economic Growth in Central and Eastern Europe. Sustainability, 6, p. 8149- 8163; doi:10.3390/su6118149
Pournarakis, M. – Varsakelis N. C. (2002): Foreign Direct Investment in Central and Eastern European Countries: Do Institutions Matter? December 2002, Athens, Greece p. 8
Roland Berger Strategy Consultants (2009): The road to recovery in CEE – Management survey about the impacts of the economic crisis. p. 25
Sass, Magdolna – Hunya, Gábor (2014): Escaping to the East? Relocation of business activities to and
from Hungary, 2003–2011. Centre for Economic and Regional Studies
Hungarian Academy of Sciences, Discussion papers, Budapest, 2014, MT-DP – 2014/7, ISBN 978-615-5447-16-7, p. 6 Schuh, Arnold (2012): Strategy Review for Central and
Eastern Europe. Journal of East-West Business, Volume 18, 2012 – Issue 3, p. 185-207. https://doi.org/1 0.1080/10669868.2012.709221
Schuh, Arnold (2013): Central and Eastern Europe after the boom: Time for a strategy change for foreign multinational companies? Central European Business Review, Volume 2, Number 2, June 2013, p. 25-26.
DOI: 10.18267/j.cebr.43
Schwab, K. (2016): The Global Competitiveness Report 2016-2017. World Economic Forum, Insight Report, ISBN-13: 978-1-944835-04-0, p. 36, 371-379
Skanska – JLL – Dentons – ABSL (2016): CEE Investment Report 2016 (Data Partner: Fitch Ratings). p. 7
Stehrer, Robert – Borowiecki, Marcin – Dachs, Bernhard – Hanzl-Weiss, Doris – Kinkel, Steffen – Pöschl, Johannes – Sass, Magdolna – Schmall, Thomas Christian – Szalavetz, Andrea (2012): Global Value Chains and the EU Industry. The Vienna Institute for International Economic Studies, Research Reports 383, October 2012, p. 11-12.
Stentoft, J. – Olhager, J. – Heikkila, J. – Thoms, L.
(2015): Moving manufacturing back: a con-tent-based literature review. EurOMA conference presentation, 2015 June, Neuchatel, p. 1-2.
Szalavetz, Andrea (2017): Industry 4.0 in ‘factory economies’. In: Béla Galgóczi and Jan Drahokoupil (eds.) (2017): Condemned to be left behind? Can Central and Eastern Europe emerge from its low-wage model? Brussels: ETUI, D/2017/10.574/21, ISBN: 978- 2-87452-461-5 (print version) ISBN: 978-2-87452-462- 2 (electronic version), p. 133-152.
Tøndel, L. (2001): Foreign direct investment during transition. Determinants and patterns in Central and Eastern Europe and the former Soviet Union. WP 2001:9, p. 25-29.
World Bank Database (2016, 2017): http://www.worldbank.
org/ (downloaded: 24 October, 2017)
World Bank Group (2015): EU Regular Economic Report, Sustaining Recovery, Improving Living Standards (Fall, 2015). 10289, p. 32
World Economic Forum (WEF) (2017): http://www.
weforum.org/ (downloaded: 24 October, 2017)
Appendix
Name of variable Definition
Population, total Total population is based on the de facto definition of population, which counts all residents regardless of legal status or citizenship. The values shown are midyear estimates (World Bank, 2016).
Labour force, total
Total labour force comprises people ages 15 and older who meet the International Labour Organization defi- nition of the economically active population: all people who supply labour for the production of goods and services during a specified period. It includes both the employed and the unemployed. While national practices vary in the treatment of such groups as the armed forces and seasonal or part-time workers, in general the labour force includes the armed forces, the unemployed, and first-time job-seekers, but excludes homemakers and other unpaid caregivers and workers in the informal sector (World Bank, 2016).
Employment, total
Employment encompasses all activities performed by persons to produce goods and services for the main purpose of generating an income. For measurement purposes, persons in employment are defined as com- prising all those above a specified age who, during the reference period of measurement, were: (a) employed
“at work”, i.e. worked for at least one hour to generate income in the form of wage or salary, profit or family gain, paid in cash or in kind; or (b) employed “not at work”, i.e. with a job to generate income but temporarily absent, generally for less than three months, for specific reasons (ILO, 2013).
Unemployment rate
It counts the percentage of the total labour force, which is without work but available and seeking for employ- ment. (The unemployed comprise all persons above a specified age who during the reference period were:
without work, that is, were not in paid employment or self employment during the reference period; currently available for work, that is, were available for paid employment or self-employment during the reference pe- riod; and seeking work, that is, had taken specific steps in a specified recent period to seek paid employment or self-employment (OECD, 2003)
Quality of education It measures secondary and tertiary enrollment rates and the quality of education as evaluated by business leaders. The extent of staff training is also taken into consideration (WEF, 2016).
Manufacturing labour
costs per hour (US$) Average hourly compensation costs for all employees in manufacturing. Includes direct pay, bonuses, health- care and other social benefits, and labour-related taxes and subsidies (Economist Intelligence Unit, 2016).
GDP per capita
GDP per capita is gross domestic product divided by midyear population. GDP is the sum of gross value added by all resident producers in the economy plus any product taxes and minus any subsidies not included in the value of the products. It is calculated without making deductions for depreciation of fabricated assets or for depletion and degradation of natural resources. Data are in current U.S. dollars (World Bank, 2016).
GDP growth (annual %)
Annual percentage growth rate of GDP at market prices based on constant local currency. Aggregates are based on constant 2010 U.S. dollars. GDP is the sum of gross value added by all resident producers in the economy plus any product taxes and minus any subsidies not included in the value of the products. It is cal- culated without making deductions for depreciation of fabricated assets or for depletion and degradation of natural resources (World Bank, 2016).
Inflation, consumer prices (annual %)
Inflation as measured by the consumer price index reflects the annual percentage change in the cost to the average consumer of acquiring a basket of goods and services that may be fixed or changed at specified in- tervals, such as yearly. The Laspeyres formula is generally used (World Bank, 2016)
Current account balance
(% of GDP) Current account balance is the sum of net exports of goods and services, net primary income, and net sec- ondary income (World Bank, 2016).
FDI, net inflows (% of GDP)
Foreign direct investment are the net inflows of investment to acquire a lasting management interest (10 percent or more of voting stock) in an enterprise operating in an economy other than that of the investor. It is the sum of equity capital, reinvestment of earnings, other long-term capital, and short-term capital as shown in the balance of payments. This series shows net inflows (new investment inflows less disinvestment) in the reporting economy from foreign investors, and is divided by GDP (World Bank, 2016).
Ease of doing business It has been used as an important tool by policymakers of many countries over the years. Since its first pub- lication in 2005, the Index has become widely recognized as one of the key assessments of global competi- tiveness as defined by the World Economic Forum (WEF, 2016).
Legal rights index Degree of legal protection of borrowers’ and lenders’ rights on a 0–12 (best) scale. This index measures the degree to which collateral and bankruptcy laws protect borrowers’ and lenders’ rights and thus facilitate lending (WEF, 2016).
Corporate taxation Corporate tax rates (%) by countries (KPMG, 2016) Ethics and corruption Rating countries between 1 and 7 (best) (WEF, 2016) Quality of overall
infrastructure “How do you assess the general state of infrastructure (e.g., transport, communications and energy) in your country?“ [1 = extremely underdeveloped; 7 = extensive and efficient] | weighted average (WEF, 2016) Strength of investor
protection
This variable is a combination of the Extent of disclosure index (transparency of transactions), the Extent of director liability index (liability for self-dealing), and the Ease of shareholder suit index (shareholders’
ability to sue officers and directors for misconduct) (WEF, 2016).
Transparency of government policy making
“In your country, how easy is it for companies to obtain information about changes in government policies and regulations affecting their activities?” [1 = extremely difficult; 7 = extremely easy] | weighted average (WEF, 2016).
Local supplier quality “In your country, how do you assess the quality of local suppliers?” [1 = extremely poor quality; 7 = extreme- ly high quality] | weighted average (WEF, 2016).
Source: World Bank, ILO, OECD, WEF, EIU, 2017