Small-scale agricultural landscapes and organic management support wild bee 1
communities of cereal field boundaries 2
3
Anne-Kathrin Happe1,2†, Friederike Riesch1,3†, Verena Rösch1,4, Róbert Gallé1,5, Teja 4
Tscharntke1 and Péter Batáry1,6*
5 6
1Agroecology, University of Goettingen, Grisebachstr. 6, 37077 Göttingen, Germany;
7
2Ecological Networks, Technische Universität Darmstadt, Schnittspahnstr. 3, 64287 8
Darmstadt, Germany; 3Grassland Science, University of Goettingen, von-Siebold-Str. 8, 9
37075 Göttingen, Germany; 4Institute for Environmental Sciences, University of Koblenz – 10
Landau, Fortstr. 7, 76829 Landau, Germany; 5Department of Ecology, University of Szeged, 11
Közép fasor 52, 6726 Szeged, Hungary; 6GINOP Sustainable Ecosystems Group, MTA 12
Centre for Ecological Research, Klebelsberg Kuno u. 3, 8237 Tihany, Hungary.
13
†Equally contributing authors.
14 15
*Corresponding author: Grisebachstr. 6, 37077 Göttingen, Germany. Tel.: +49-551-3922358.
16
Fax: +49-551-398806. E-mail: pbatary@gmail.com (P. Batáry).
17
Abstract 18
Pollinators are sensitive to agricultural intensification at both local and landscape scales. High 19
configurational landscape heterogeneity due to small fields and a high amount of field 20
boundaries is hypothesized to enhance farmland biodiversity. Here, we investigated the 21
effects of organic vs. conventional farming in large- vs. small-scale agricultural landscapes on 22
wild bee communities and their floral resources to improve conservation schemes for 23
pollinators. We sampled bees in Central Germany at the field boundaries of 18 pairs of 24
conventionally and organically managed winter wheat fields along the former iron curtain 25
using pan traps and trap nests. Around traps, we surveyed species richness and flower cover 26
of insect-pollinated forbs. Compared to conventional farming, organic farming was related to 27
higher insect-pollinated forb species richness and flower cover in the field boundaries, 28
presumably due to the lack of herbicide use. Interestingly, small-scale agriculture did not 29
counteract the loss of floral resources under conventional management, as the difference to 30
organic management was even larger in Western small-scale agriculture. Organic farming, but 31
not small-scale agriculture, enhanced species richness of solitary bees, which is in line with 32
their small home ranges. In contrast, bumblebees benefitted only from small-scale agriculture, 33
which matches with their high dispersal ability. Despite similar levels of abundance and 34
diversity of trap-nesting bees in the two landscape types, brood cell parasitism was also 35
higher in small-scale agriculture. Both organic farming and small-scale agriculture directly 36
and indirectly supported different groups of wild bees, suggesting long-term benefits for 37
conservation. Agri-environment schemes should acknowledge the so far neglected benefits of 38
small-scale agriculture for biodiversity and its potential services.
39 40
Keywords: Agri-environment schemes, insect-pollinated plants, landscape configuration, pan 41
trap, pollinators, trap nest 42
1. Introduction 44
Wild bees are strongly affected by agricultural intensification and landscape homogenization.
45
At the local scale, a major threat is the increased input of pesticides and fertilizers (Robinson 46
and Sutherland, 2002), whereas changes in the agricultural landscape due to increased field 47
sizes and the loss of suitable habitats exert pressure on biodiversity and ecosystem services 48
(Steffan-Dewenter et al., 2002; Tscharntke et al., 2005; Rundlöf et al., 2008; Bommarco et al., 49
2010). Declines in the abundance and diversity of native bees, and their services can be 50
explained by the isolation from critical floral and nesting resources (Steffan-Dewenter and 51
Tscharntke, 1999; Kremen et al., 2002). Despite the importance of wild bees providing 52
pollination services and the increasing awareness of this problem (Klein et al., 2007; Aizen et 53
al., 2009; Garibaldi et al., 2013), pollinators in agricultural landscapes are still at risk.
54
Agri-environment schemes (AES) may be powerful mitigation tools to enhance habitat 55
quality for pollinators and combat biodiversity loss in intensively cultivated areas (Batáry et 56
al., 2015). Instead of establishing new protection areas, these schemes integrate conservation 57
efforts into the agricultural landscape. Farmers may provide flower strips, nesting resources 58
and restore semi-natural and natural areas adjacent to crops (Garibaldi et al., 2014, 2016;
59
Kleijn et al., 2015).
60
Even though AES are often considered as an expensive and complex form of 61
environmental protection (Batáry et al., 2015), the investment is observed to pay off. AES 62
enhance ecosystem services such as pollination and natural pest control by increasing 63
farmland heterogeneity and extensive farming practices (Inclán et al., 2015). Among AES 64
measures, organic farming is one of the most well-established management approaches 65
(Batáry et al., 2013). The high value of organic management for agro-biodiversity has been 66
shown for several agricultural systems (e.g. Schmidt et al., 2005; Rundlöf et al., 2008;
67
Schneider et al., 2014). Including data from 30 years and different farming systems in a meta- 68
analysis, Tuck et al. (2014) could show for example that organic farming increased species 69
richness by 30% with the strongest positive effects in cereals and mixed crops. Regarding 70
functional groups they emphasized the positive effect of organic farming on plants and 71
pollinators.
72
Various studies have shown that the composition of the surrounding landscape 73
moderates the effectiveness of AES in general, and organic farming in particular (Rundlöf et 74
al., 2007; Batáry et al., 2011). For example, pollinators profit from agri-environmental 75
management in simple but not in complex landscapes (Batáry et al., 2011). Landscape 76
configuration is an important factor affecting biodiversity and ecosystem services, but little is 77
known about how landscape configurational heterogeneity shapes biodiversity patterns under 78
AES (Belfrage et al., 2005; Marshall et al., 2006; Concepción et al., 2012). The shift from 79
small-scale family farms to large-scale agriculture has severely decreased landscape 80
configurational heterogeneity. This process is accompanied by a trend towards specialization 81
and the increase of field sizes on the expense of mixed farming and high quality edges, such 82
as hedgerows (Robinson and Sutherland, 2002; Holzschuh et al., 2010).
83
In this study, we used a novel approach to disentangle the interlinked effects of local 84
management and landscape configuration on wild bees. At the former inner German border 85
(iron curtain), two opposed farming strategies have led to diverging field size patterns. While 86
small private farms shape West Germany’s agriculture, Eastern farms were merged and 87
organised in large cooperatives. In 1989, average farm size in the West was 18.17 ha. In East 88
Germany, farms were on average 250 times as large due to collectivisation under planned 89
economy (Koester, 1999). Similarly, in many Central and Eastern European countries, 90
collectivised family farms were merged to large industrial farms of several hundred or 91
thousand hectares in size (Davidova et al., 2012; Sutcliffe et al., 2015). Today, post- 92
communist legacy effects in the agricultural landscape are still visible and affect farmland 93
biodiversity (Báldi and Batáry, 2011; Konvicka et al., 2016; Batáry et al., 2017). We studied 94
the effects of farming practice and landscape configuration based on these historically grown 95
structures alongside the former iron curtain. Our research focused on wild bees, which 96
contribute crucially to ecosystem service provision in agricultural landscapes, and on insect- 97
pollinated forbs, which offer essential food resources for this prominent group of pollinators.
98
Both bees and forbs are highly sensitive indicators for agricultural intensification at the local 99
and the landscape scale, and thus belong to the major target groups of AES(Batáry et al., 100
2015; Garibaldi et al., 2013; Kennedy et al., 2013). We expected local management and 101
landscape configuration to strongly affect abundance and species richness of both wild bees 102
and their floral resources in wheat field boundaries. We addressed the following research 103
questions: (1) Do insect-pollinated forb and wild bee species richness and abundance in cereal 104
field boundaries increase in small-scale compared to large-scale agricultural landscapes? (2) 105
Does organic farming enhance forb species richness and cover and pollinator diversity and 106
abundance? (3) Can we detect a coupled effect of farming practice and landscape 107
configuration on wild bees and their floral resources?
108 109
2. Materials and methods 110
2.1. Study sites and study design 111
We sampled a total of 36 winter wheat fields in southern Lower Saxony (former democratic 112
West Germany, hereafter ‘West’) and northern Thuringia (former communist German 113
Democratic Republic, hereafter ‘East’) in 2013, at both sides of the former inner German 114
border (Appendix S1 in Supplementary Material). Intensive cropland (mainly cereals and oil 115
seed rape) and pastures dominated the surrounding landscape accompanied by semi-natural 116
habitats such as forest patches and hedgerows. Annual precipitation was 581 mm and mean 117
annual temperature was 8.9 °C (measuring station Mühlhausen, 190 m a.s.l.) in Northern 118
Thuringia (DWD 2013). Western fields were situated around the city of Göttingen (weather 119
measuring station at 176 m a.s.l.) with a mean annual precipitation of 651 mm and a mean 120
annual temperature of 9.2 °C (DWD 2013). Edge length and average field size recorded in a 121
500 m buffer around study fields provided evidence for the strong contrast in landscape 122
configuration between large-scale East and small-scale West. Field edges in the West were 123
1.7 times longer and fields six times smaller than in the East), whereas the proportion of 124
agricultural area was similar in both landscape types (Table 1). The percentage of organic 125
farmland in the study regions accounted for 2.8% of the agricultural area in Lower Saxony 126
and 4.2% in Thuringia in 2015 (BMEL, 2015). We selected 18 pairs of organic and 127
conventional fields in both regions for simultaneous testing of the influence of landscape 128
configuration (large-scale East vs. small-scale West) and farming practice. In both regions, 129
conventional and organic systems were clearly differentiated based on management intensity 130
(no application of synthetic pesticides in organic farming; amount of nitrogen fertilizer used 131
about five times lower, and yields half as high in organic compared to conventional farming 132
(Batáry et al., 2017)). Fields belonging to one pair were located within the area of one village 133
in the immediate vicinity of each other (distance between paired fields in East: 2.60 ± 0.58 134
km; in West: 1.10 ± 0.22 km). Since organic farms are not as widely distributed in the East as 135
in the West, we had to apply a partly cross-nested study design (Batáry et al., 2017): In three 136
villages (in both East and West), we selected two pairs of fields belonging to the same 137
farmers, resulting in three villages with one pair and three villages with two pairs of organic 138
and conventional fields per landscape type (altogether 24 farms). On average, study field size 139
was seven times larger in the East than in the West (Table 1). Along each field, we selected 140
one grassy field boundary with homogeneous cover (excluding sown flower mixtures or 141
hedgerows) for pollinator sampling and vegetation surveys.
142 143
2.2. Vegetation surveys 144
Detailed vegetation surveys were conducted once in mid-June 2013, following the sampling 145
protocol used by Batáry et al. (2013). We assessed species richness and cover of insect- 146
pollinated forbs in three botanical plots of 5 × 1 m size, located in the centre of the grassy 147
field boundary and separated by 10 m from each other. Additionally, percent cover of 148
flowering plants, which might attract pollinators, was recorded in the plots around pan traps 149
(see below).
150 151
2.3. Pollinator sampling 152
In each field boundary, we sampled pollinators using three yellow pan traps placed on sticks 153
of 1 m height. We established the traps parallel to the field edge in the centre of the vegetation 154
survey plots at the field boundary. Yellow traps are known to be most attractive for wild bees 155
and are frequently used to compare pollinator diversity between different study sites (Grundel 156
et al., 2011; but see Morandin and Kremen, 2013). We opened the traps for seven days at each 157
site during three survey periods (May 6-16, May 28 - June 6 and June 24 - July 4, 2013).
158
Trapped pollinators were stored in 70% ethanol, dried, needled and identified to species level.
159
We sampled trap nesting bees using two trap nests per field boundary consisting of 160
plastic tubes filled with reed internodes (Gathmann et al., 1994). Each trap nest was 161
composed of two trapping cylinders set up on two wooden posts in 15 m distance from each 162
other in spring (April 22-24, 2014). We collected the traps in autumn (September 13-16, 163
2014). We opened occupied reed nests in the laboratory, examined them for parasitism and 164
identified trap-nesting bees and wasps to genus level.
165 166
2.4. Statistical analyses 167
We used the software R 3.3.2 (R Core Team, 2016) to conduct statistical analyses. We tested 168
the effects of farmland management and landscape configuration on insect-pollinated forb 169
diversity and cover, wild bee species richness and abundance (separately for solitary bees and 170
bumblebees) and genus richness, cell number and parasitized cell number of trap-nesting bees 171
and wasps by general and generalised linear mixed effect models (GLMM) using the 172
functions ‘lmer’ and ‘glmer’ of the package ‘lme4’ version 1.1-12 (Bates et al., 2015). To 173
avoid spatial and temporal autocorrelation, we pooled all samples per field by summing up 174
insect numbers. Based on the strong contrasts in landscape configuration and management 175
intensity (Table 1) we employed the factors ‘landscape scale’ (East: large-scale vs. West:
176
small-scale) and farm ‘management’ (organic vs. conventional) and their interaction as 177
categorical predictor variables. As some fields of the same management type belonged to the 178
same farmer, we included nested random effects, with ‘farmer’ nested in ‘village’ and ‘pair’
179
nested in ‘village’ (Batáry et al., 2017). In case of overdispersion, we accounted for 180
individual-level variability by including ‘field’ as additional random factor. We used visual 181
methods (quantile-quantile plots and homogeneity plots of residuals vs. fitted values) and 182
Shapiro-Wilk-tests to check the distribution of the residuals. Models were fitted with normal, 183
Poisson, or negative binomial distribution according to the error distribution of the response 184
variable (Table 2). We calculated all models nested in the global model by the command 185
‘dredge’ in the package ‘MuMin’ version 1.16.4 (Barton, 2016) and compared them based on 186
Akaike Information Criterion corrected for small sample size (AICc). We performed model 187
averaging (Anderson and Burnham, 2002) if the top model and subsequent models differed 188
less than two units in AICc. Model-averaged parameter estimates were calculated over the 189
subset of models including the parameter (conditional average) to avoid shrinkage towards 190
zero (Grueber et al., 2011). We present the 95% confidence interval (CI) of parameter 191
estimates and the relative importance of each parameter. Relative importance is 0%, when the 192
parameter does not appear in the top model set, and reaches 100%, when the parameter is 193
present in all top models. Figures represent mean and standard error of the mean (SEM) of 194
species or genus richness and abundance, respectively, for each landscape and management 195
type.
196 197
3. Results 198
3.1. Insect-pollinated forbs 199
In total, we recorded 175 plant species in the cereal field boundaries. According to Klotz et al.
200
(2002), 70 of these species were insect-pollinated forbs (Table S1). Species richness of insect- 201
pollinated forbs was highest in organic field boundaries in both large-scale agriculture (43 202
species) and small-scale agriculture (47 species), whereas only 15 species were found in 203
conventional field boundaries in small-scale agriculture, compared to 37 species in large-scale 204
agriculture. For insect-pollinated forb species richness we retained the full model including 205
landscape scale, management, and the interaction term as single top model (∆AICc < 2).
206
There was an interaction between landscape scale and management, indicating a stronger 207
management effect on insect-pollinated forb species richness in small-scale agriculture than in 208
large-scale agriculture (Table 2, Fig. 1a). Forb cover differed between management types 209
(higher cover in organic than in conventional field boundaries), but not between landscape 210
scales, as the single best candidate model for insect-pollinated forb cover contained only 211
management as predictor variable (Fig. 1b).
212 213
3.2.Bumblebees and solitary bees 214
We collected a total of 1915 wild bees (1512 solitary and 403 social bees) using pan traps and 215
identified 81 species belonging to 16 genera (Table S2). The highest species richness and 216
abundance occurred within the taxon Andrena with the species A. nigroaenea and A.
217
haemorrhoa being the most frequent. Individuals of the managed European honeybee (Apis 218
mellifera) were excluded from the analyses.
219
Species richness and abundance of social wild bees, i.e. bumblebees, in field boundaries 220
depended on the landscape type (Table 2, Fig. 2a,c). However, the landscape effect on species 221
richness was less evident than on abundance, which was more than two times higher in small- 222
scale agriculture relative to large-scale agriculture. In contrast, species richness and 223
abundance of solitary bees were affected by management, but not by landscape scale (Fig.
224
2b,d). Again, the effect on abundance was stronger than on species richness, with the number 225
of solitary bees being reduced almost by one third under conventional compared to organic 226
management.
227 228
3.3. Trap nesting bees and brood cell parasitism 229
We found 13 genera of trap nesting bees and wasps checking 7126 brood cells. Overall, 230
3.21% of cells were parasitized (Table S3). Management was the only factor explaining genus 231
richness and cell number of trap nesting bees and wasps, but evidence for a positive effect of 232
organic management was limited (Table 2, Fig. 3a,b). However, there were about twice as 233
many parasitized cells in small-scale agriculture than in large-scale agriculture, and the single 234
best candidate model for the number of parasitized cells strongly supported an effect of 235
landscape scale (Fig. 3c).
236 237
4. Discussion 238
Based on differences in landscape configuration derived from opposing agricultural land-use 239
history in former East and West Germany, our study allowed disentangling landscape-scale 240
(large-scale vs. small-scale agriculture) and local (organic vs. conventional management) 241
effects on wild bee communities and their floral resources. Organic management consistently 242
increased the cover and species richness of insect-pollinated forbs in the cereal field 243
boundaries, in both large-scale and small-scale agricultural landscapes. However, the more 244
pronounced increase in forb species richness in small-scale agriculture compared to large- 245
scale agriculture suggested a higher effectiveness of organic management in small-scale 246
systems. The positive effect of organic management on forbs was accompanied by an 247
enhanced abundance of solitary wild bees. By contrast, bumblebee abundance did not increase 248
under organic management, whereas it was much higher in small-scale than in large-scale 249
systems. Similarly, parasitism of trap nesting bees and wasps was higher in the small-scale 250
than in the large-scale agriculture.
251 252
4.1. Insect-pollinated forbs 253
Forb species richness in field boundaries was notably reduced under conventional 254
management, particularly in small-scale agriculture. The decrease in diversity and cover of 255
forbs observed in landscapes characterized by high cover of conventionally managed arable 256
land has been explained by the intensive use of herbicides and the loss of semi-natural refuge 257
habitats (Roschewitz et al., 2005; Gaba et al., 2010; Dainese et al., 2016). Forb species 258
richness in field boundaries might also decrease with increasing fertilizer application in the 259
adjacent conventional crop field (Kleijn et al., 2009). In our study, there was no evidence that 260
conventional farmers applied higher amounts of fertilizers and pesticides in small-scale 261
compared to large-scale agriculture (Batáry et al. 2017). Given the similar level of agro- 262
chemical applications in both regions, we expected that higher edge lengths in small-scale 263
agriculture counteract habitat loss and enhance forb species richness and cover in 264
conventional field boundaries. In contrast, we found the difference in species richness and 265
cover of forbs between organic and conventional management to be much more pronounced 266
in small-scale than in large-scale agricultural landscapes. Consequently, in our study, 267
heterogeneous small-scale agriculture did not reduce the effectiveness of organic farming in 268
enhancing biodiversity, as suggested by other authors (Tscharntke et al., 2012). Based on our 269
experiences a tentative explanation could be that conventional field margins in the large-scale 270
agricultural landscapes in the East are less frequently managed by mowing compared to the 271
small-scale landscapes in the West (Chaudron et al., 2016).
272
Our findings substantiate strong benefits of organic farming for plant species richness 273
and cover, which are well-known and can be explained by the lack of herbicide application 274
(Roschewitz et al., 2005; Rundlöf et al., 2009; Tuck et al., 2014). Although the effectiveness 275
of organic farming has been questioned, for example in comparison to the restoration of semi- 276
natural habitats (Batáry et al., 2015), organic farming has generally been given credit for 277
balancing between multiple sustainability goals, such as productivity, environmental impact, 278
economic profit and human well-being (Reganold and Wachter, 2016).
279
It has been shown that the favourable effect of organic farming in terms of biodiversity 280
conservation increases in areas with high crop cover (Tuck et al., 2014; Batáry et al., 2015).
281
In our comparison of large-scale and small-scale farming systems, however, the proportion of 282
agricultural area covering the surroundings of our study sites was similar in both landscape 283
types (ca. 80%, Table 1). Thus we can largely exclude that differences in plant species 284
richness in organic field boundaries between small- and large-scale agriculture were related to 285
crop cover in the surrounding landscape.
286 287
4.2. Bumblebees and solitary bees 288
Our results provide evidence that organic farming succeeds not only in promoting 289
insect-pollinated forbs, but also solitary bee abundances in the wheat field boundaries. Social 290
bees, i.e. bumblebees, did not benefit from organic management but from small-scale 291
agriculture, indicating that bumblebees are more sensitive to landscape-scale intensification 292
than solitary bees. Larger body sizes in social bees translate to larger foraging ranges 293
(Westphal et al., 2006; Greenleaf et al., 2007; Kennedy et al., 2013), suggesting that social 294
bees perceive landscapes at a broader spatial scale than solitary bees (Steffan-Dewenter et al., 295
2002). Steffan-Dewenter and Tscharntke (1999), who tested the effect of habitat isolation on 296
wild bees, confirmed a positive correlation of body size and foraging distance. In our study, 297
the large foraging ranges of bumblebees, especially of the most common species Bombus 298
terrestris, may partly explain the positive effect of landscape heterogeneity, i.e. smaller fields 299
with higher boundary lengths per unit area in small-scale agriculture, on bumblebee species 300
richness and abundance. Bumblebees depend strongly on high quality foraging habitat and 301
flower-rich field boundaries (Carvell et al., 2004), which were more available in small-scale 302
agriculture based on higher edge lengths (Table 1). Carvell et al. (2017), for instance, showed 303
that the survival of bumblebee family lineages between years increased significantly, when 304
bumblebees had access to flower rich field boundaries within 250-1,000 m from nesting sites.
305
Our finding that bumblebees benefit from small-scale agricultural landscapes is also in 306
accordance with Morandin et al. (2016), who showed that small-scale restorations of field 307
boundaries with hedgerows could be ecologically and economically cost effective in 308
promoting pollinators in adjacent crops within simplified agricultural landscapes.
309
Kennedy et al. (2013) found only weak effects of landscape configuration on wild bees, 310
but a strong influence of organic management. Contrary to our results, they reported that both 311
solitary and social bees profited from improved habitat conditions under organic management, 312
especially if vegetation diversity in the fields was high. There is no simple explanation why 313
the higher flower-richness we recorded in boundaries of organic fields did not lead to higher 314
bumblebee abundance and/or species richness. We assume that strong landscape-scale effects 315
in our study may have superimposed a potential positive effect of organic farming on 316
bumblebees. It is likely that the higher density of boundaries in small-scale agriculture offers 317
nesting sites and foraging resources at larger spatial scales, reducing the attractiveness of local 318
floral resources provided in organic field margins.
319 320
4.3. Trap nesting bees and their parasitism 321
Trap nest communities have been effectively used to study pollinators, predatory wasps, their 322
parasitoids and parasitism, which is an essential ecosystem function regulating host 323
populations (Tylianakis et al., 2006; Pereira-Peixoto et al., 2014, 2016). In our study, 324
parasitism of trap nesting bees and wasps was affected by small-scale agriculture, which 325
enhanced parasitoid abundance independently from farm management and host density.
326
Pereira-Peixoto et al. (2014) found more natural enemies of cavity-nesting bees in 327
heterogeneous habitats (urban-rural interface vs. either urban or rural), which were assumed 328
to provide more resources to parasitoids (Pereira-Peixoto et al., 2016), i.e. floral resources as 329
well as hosts and nesting sites for hosts. Their finding is in accordance with the high 330
parasitoid abundance we detected in small-scale agricultural landscapes, though we did not 331
find more brood cells of hosts or a higher number of cavity nesting bee genera in small-scale 332
agriculture. As opposed to this, Holzschuh et al. (2010) observed that local- and landscape- 333
scale effects on parasitoids were mainly mediated by their hosts, and parasitism rates were 334
marginally affected by local factors. However, in line with our findings, Steckel et al. (2014) 335
reported a similar response of trap nest parasitoids in grasslands at different land use 336
intensities, with parasitoids reacting more sensitive to low configurational landscape 337
heterogeneity than their hosts and perceiving the influence of this factor at larger spatial 338
scales (up to 1500 m). Hence, small-scale landscapes can enhance potential regulation of host 339
populations, which can be generally expected based on constraints in dispersal ability and 340
feeding specialization of natural enemies (Perović et al., 2017). By studying trap-nest 341
communities we were able to show that landscape configuration and management affect host 342
abundance and parasitism differently, implying effects on trophic interactions and ecosystem 343
functions.
344 345
5. Conclusion 346
Comparing management and landscape-scale effects on insect-pollinated forbs, bees and their 347
parasitoids, we showed that organic farming and the associated high availability of local floral 348
resources enhanced solitary bees, which are spatially restricted by their small foraging ranges.
349
Perceiving landscapes at a broader spatial scale, bumblebees profited from small-scale 350
agriculture. Therefore, we propose to promote small-scale agriculture, i.e. the reduction of 351
field sizes, as an AES to enhance habitat conditions for wild bee communities in farmland.
352
Next to organic management, the reduction of field sizes may serve as an effective tool to 353
support pollinators in the agricultural landscape.
354 355
Acknowledgements 356
We thank the farmers for participation and Z. Józan for identification of bees. Funding was 357
provided by the German Research Foundation (DFG BA 4438/1-1). During the preparation of 358
the paper, PB was supported by the Economic Development and Innovation Operational 359
Programme of Hungary (GINOP–2.3.2–15–2016–00019).
360
References 361
Aizen, M.A., Garibaldi, L.A., Cunningham, S.A., Klein, A.M., 2009. How much does 362
agriculture depend on pollinators? Lessons from long-term trends in crop production.
363
Ann. Bot. 103, 1–10.
364
Anderson, K.P., Burnham, D.R., 2002. Model selection and multimodel inference: a practical 365
information-theoretic approach. Springer-Verlag, New York.
366
Báldi, A., Batáry, P., 2011. Spatial heterogeneity and farmland birds: different perspectives in 367
Western and Eastern Europe. Ibis 153, 875–876.
368
Barton, K., 2016. MuMIn: Multi-Model Inference. R package version 1.16.4.
369
https://CRAN.R-project.org/package=MuMIn.
370
Batáry, P., Báldi, A., Kleijn, D., Tscharntke, T., 2011. Landscape-moderated biodiversity 371
effects of agri-environmental management: a meta-analysis. Proc. Roy. Soc. B 278, 372
1894–1902.
373
Batáry, P., Dicks, L.V., Kleijn, D., Sutherland, W.J., 2015. The role of agri-environment 374
schemes in conservation and environmental management. Conserv. Biol. 29, 1006–1016.
375
Batáry, P., Gallé, R., Riesch, F., Fischer, C., Dormann, C.F., Mußhoff, O., Császár, P., 376
Fusaro, S., Gayer, C., Happe, A.-K., Kurucz, K., Molnár, D., Rösch, V., Wietzke, A.
377
Tscharntke, T., 2017. The former iron curtain still drives biodiversity-profit trade-offs in 378
German agriculture. Nature Ecol. Evol. 1, 1279–1284.
379
Batáry, P., Sutcliffe, L., Dormann, C.F., Tscharntke, T., 2013. Organic farming favours 380
insect-pollinated over non-insect pollinated forbs in meadows and wheat fields. PLoS 381
ONE 8, e54818.
382
Bates, D., Maechler, M., Bolker, B., Walker, S., 2015. Fitting linear mixed-effects models 383
using lme4. J. Stat. Softw. 67, 1–48.
384
Belfrage, K., Björklund, J., Salomonsson, L., 2005. The effects of farm size and organic 385
farming on diversity of birds, pollinators, and plants in a Swedish landscape. Ambio 34, 386
582–588.
387
BMEL, 2015. Ökologischer Landbau nach Verordnung (EG) Nr. 834/2007 i.V.m.
388
Verordnung (EG) Nr. 889/2008 in Deutschland im Jahr 2015. Bundesministerium für 389
Ernährung und Landwirtschaft, URL: http:// www.bmel.de, accessed 19.10.2017.
390
Bommarco, R., Biesmeijer, J.C., Meyer, B., Potts, S.G., Poyry, J., Roberts, S.P.M., Steffan- 391
Dewenter, I., Ockinger, E., 2010. Dispersal capacity and diet breadth modify the 392
response of wild bees to habitat loss. Proc. Roy. Soc. B 277, 2075–2082.
393
Carvell, C., Bourke, A.F.G., Dreier, S., Freeman, S.N., Hulmes, S., Jordan, W.C., Redhead, 394
J.W., Sumner, S., Wang, J., Heard, M.S., 2017. Bumblebee family lineage survival is 395
enhanced in high-quality landscapes. Nature 543, 547–549.
396
Carvell, C., Meek, W.R., Pywell, R.F., Nowakowski, M., 2004. The response of foraging 397
bumblebees to successional change in newly created arable field margins. Biol. Conserv.
398
118, 327–339.
399
Chaudron, C., Perronne, R., Bonthoux, S., Di Pietro, F., 2016. Influence of management 400
practices on plant assemblages of road–field boundaries in an agricultural landscape.
401
Appl. Veg. Sci. 19, 644–654.
402
Concepción, E.D., Díaz, M., Kleijn, D., Báldi, A., Batáry, P., Clough, Y., Gabriel, D., 403
Herzog, F., Holzschuh, A., Knop, E., Marshall, E.J.P., Tscharntke, T., Verhulst, J., 2012.
404
Interactive effects of landscape context constrain the effectiveness of local agri- 405
environmental management. J. Appl. Ecol. 49, 695–705.
406
Dainese, M., Montecchiari, S., Sitzia, T., Sigura, M., Marini, L., 2016. High cover of 407
hedgerows in the landscape supports multiple ecosystem services in Mediterranean 408
cereal fields. J. Appl. Ecol. 54, 380–388.
409
Davidova, S., Fredriksson, L., Gorton, M., Mishev, P., Petrovici, D., 2012. Subsistence 410
farming, incomes, and agricultural livelihoods in the new member states of the European 411
Union. Environ. Plann. C 30, 209–227.
412
DWD, 2013. Climate data for Germany per measuring stations – long term means (1981- 413
2010). Deutscher Wetterdienst, URL: http://www.dwd.de, accessed 09.08.2015.
414
Gaba, S., Chauvel, B., Dessaint, F., Bretagnolle, V., Petit, S., 2010. Weed species richness in 415
winter wheat increases with landscape heterogeneity. Agric. Ecosyst. Environ. 138, 318–
416
323.
417
Garibaldi, L.A., Carvalheiro, L.G., Leonhardt, S.D., Aizen, M.A., Blaauw, B.R., Isaacs, R., 418
Kuhlmann, M., Kleijn, D., Klein, A.M., Kremen, C., Morandin, L., Scheper, J., Winfree, 419
R., 2014. From research to action: enhancing crop yield through wild pollinators.
420
Frontiers Ecol. Environ. 12, 439–447.
421
Garibaldi, L.A., Carvalheiro, L.G., Vaissière, B.E., Gemmill-Herren, B., Hipólito, J., Freitas, 422
B.M., Ngo, H.T., Azzu, N., Sáez, A., Åström, J., An, J., Blochtein, B., Buchori, D., 423
García, F.J.C., Oliveira da Silva, F., Devkota, K., Ribeiro, M. de F., Freitas, L., 424
Gaglianone, M.C., Goss, M., Irshad, M., Kasina, M., Filho, A.J.S.P., Kiill, L.H.P., 425
Kwapong, P., Parra, G.N., Pires, C., Pires, V., Rawal, R.S., Rizali, A., Saraiva, A.M., 426
Veldtman, R., Viana, B.F., Witter, S., Zhang, H., 2016. Mutually beneficial pollinator 427
diversity and crop yield outcomes in small and large farms. Science 351, 388–391.
428
Garibaldi, L.A., Steffan-Dewenter, I., Winfree, R., Aizen, M.A., Bommarco, R., Cunningham, 429
S.A., Kremen, C., Carvalheiro, L.G., Harder, L.D., Afik, O., Bartomeus, I., Benjamin, F., 430
Boreux, V., Cariveau, D., Chacoff, N.P., Dudenhöffer, J.H., Freitas, B.M., Ghazoul, J., 431
Greenleaf, S., Hipólito, J., Holzschuh, A., Howlett, B., Isaacs, R., Javorek, S.K., 432
Kennedy, C.M., Krewenka, K.M., Krishnan, S., Mandelik, Y., Mayfield, M.M., Motzke, 433
I., Munyuli, T., Nault, B.A., Otieno, M., Petersen, J., Pisanty, G., Potts, S.G., Rader, R., 434
Ricketts, T.H., Rundlöf, M., Seymour, C.L., Schüepp, C., Szentgyörgyi, H., Taki, H., 435
Tscharntke, T., Vergara, C.H., Viana, B.F., Wanger, T.C., Westphal, C., Williams, N., 436
Klein, A.M., 2013. Wild pollinators enhance fruit set of crops regardless of honey bee 437
abundance. Science 339, 1608–1611.
438
Gathmann, A., Greiler, H.-J., Tscharntke, T., 1994. Trap-nesting bees and wasps colonizing 439
set-aside fields: succession and body size, management by cutting and sowing.
440
Oecologia 98, 8–14.
441
Greenleaf, S.S., Williams, N.M., Winfree, R., Kremen, C., 2007. Bee foraging ranges and 442
their relationship to body size. Oecologia 153, 589–596.
443
Grueber, C.E., Nakagawa, S., Laws, R.J., Jamieson, I.G., 2011. Multimodel inference in 444
ecology and evolution: challenges and solutions. J. Evolution. Biol. 24, 699–711.
445
Grundel, R., Frohnapple, K.J., Jean, R.P., Pavlovic, N.B., 2011. Effectiveness of bowl 446
trapping and netting for inventory of a bee community. Environ. Entomol. 40, 374–380.
447
Holzschuh, A., Steffan-Dewenter, I., Tscharntke, T., 2010. How do landscape composition 448
and configuration, organic farming and fallow strips affect the diversity of bees, wasps 449
and their parasitoids? J. Anim. Ecol. 79, 491–500.
450
Inclán, D.J., Cerretti, P., Gabriel, D., Benton, T.G., Sait, S.M., Kunin, W.E., Gillespie, 451
M.A.K., Marini, L., 2015. Organic farming enhances parasitoid diversity at the local and 452
landscape scales. J. Appl. Ecol. 52, 1102–1109.
453
Kennedy, C.M., Lonsdorf, E., Neel, M.C., Williams, N.M., Ricketts, T.H., Winfree, R., 454
Bommarco, R., Brittain, C., Burley, A.L., Cariveau, D., Carvalheiro, L.G., Chacoff, N.P., 455
Cunningham, S.A., Danforth, B.N., Dudenhöffer, J.-H., Elle, E., Gaines, H.R., Garibaldi, 456
L.A., Gratton, C., Holzschuh, A., Isaacs, R., Javorek, S.K., Jha, S., Klein, A.M., 457
Krewenka, K., Mandelik, Y., Mayfield, M.M., Morandin, L., Neame, L.A., Otieno, M., 458
Park, M., Potts, S.G., Rundlöf, M., Saez, A., Steffan-Dewenter, I., Taki, H., Viana, B.F., 459
Westphal, C., Wilson, J.K., Greenleaf, S.S., Kremen, C., 2013. A global quantitative 460
synthesis of local and landscape effects on wild bee pollinators in agroecosystems. Ecol.
461
Lett. 16, 584–599.
462
Kleijn, D., Kohler, F., Báldi, A., Batáry, P., Concepción, E.D., Clough, Y., Díaz, M., Gabriel, 463
D., Holzschuh, A., Knop, E., Kovács, A., Marshall, E.J.P., Tscharntke, T., Verhulst, J., 464
2009. On the relationship between farmland biodiversity and land-use intensity in 465
Europe. Proc. Roy. Soc. B 276, 903–909.
466
Kleijn, D., Winfree, R., Bartomeus, I., Carvalheiro, L.G., Henry, M., Isaacs, R., Klein, A.-M., 467
Kremen, C., M’Gonigle, L.K., Rader, R., Ricketts, T.H., Williams, N.M., Lee Adamson, 468
N., Ascher, J.S., Báldi, A., Batáry, P., Benjamin, F., Biesmeijer, J.C., Blitzer, E.J., 469
Bommarco, R., Brand, M.R., Bretagnolle, V., Button, L., Cariveau, D.P., Chifflet, R., 470
Colville, J.F., Danforth, B.N., Elle, E., Garratt, M.P.D., Herzog, F., Holzschuh, A., 471
Howlett, B.G., Jauker, F., Jha, S., Knop, E., Krewenka, K.M., Le Féon, V., Mandelik, 472
Y., May, E.A., Park, M.G., Pisanty, G., Reemer, M., Riedinger, V., Rollin, O., Rundlöf, 473
M., Sardiñas, H.S., Scheper, J., Sciligo, A.R., Smith, H.G., Steffan-Dewenter, I., Thorp, 474
R., Tscharntke, T., Verhulst, J., Viana, B.F., Vaissière, B.E., Veldtman, R., Westphal, C., 475
Potts, S.G., 2015. Delivery of crop pollination services is an insufficient argument for 476
wild pollinator conservation. Nature Communications, 6, 7414.
477
Klein, A.-M., Vaissière, B.E., Cane, J.H., Steffan-Dewenter, I., Cunningham, S.A., Kremen, 478
C., Tscharntke, T., 2007. Importance of pollinators in changing landscapes for world 479
crops. Proc. Roy. Soc. B 274, 303–313.
480
Klotz, F., Kühn, I., Durka,W., 2002. BiolFlor – Eine Datenbank mit biologisch-ökologischen 481
Merkmalen zur Flora von Deutschland. Bundesamt für Naturschutz, Bonn.
482
Koester, U., 1999. The evolving farm structure in East Germany. Second World Bank EU 483
Accession Workshop in the Rural Sector, pp. 1–21. Warsaw, Poland.
484
Konvicka, M., Benes, J., Polakova, S., 2016. Smaller fields support more butterflies:
485
comparing two neighbouring European countries with different socioeconomic heritage.
486
J. Insect Conserv. 20, 1113–1118.
487
Kremen, C., Williams, N.M., Thorp, R.W., 2002. Crop pollination from native bees at risk 488
from agricultural intensification. P. Natl. Acad. Sci. USA 99, 16812–16816.
489
Marshall, E.J.P., West, T.M., Kleijn, D., 2006. Impacts of an agri-environment field margin 490
prescription on the flora and fauna of arable farmland in different landscapes. Agric.
491
Ecosyst. Environ. 113, 36–44.
492
Morandin, L.A., Kremen, C., 2013. Hedgerow restoration promotes pollinator populations 493
and exports native bees to adjacent fields. Ecol. Appl. 23, 829–839.
494
Morandin, L.A., Long, R.F., Kremen, C., 2016. Pest control and pollination cost–benefit 495
analysis of hedgerow restoration in a simplified agricultural landscape. J. Econ. Entomol.
496
109, 1020–1027.
497
Pereira-Peixoto, M.H., Pufal, G., Martins, C.F., Klein, A.M., 2014. Spillover of trap-nesting 498
bees and wasps in an urban–rural interface. Journal of Insect Conservation, 18, 815–826.
499
Pereira-Peixoto, M.H., Pufal, G., Staab, M., Feitosa Martins, C., Klein, A.M., 2016. Diversity 500
and specificity of host-natural enemy interactions in an urban-rural interface. Ecol.
501
Entomol. 41, 241–252.
502
Perović, D.J., Gámez-Virués, S., Landis, D.A., Wäckers, F., Gurr, G.M., Wratten, S.D., You, 503
M.S., Desneux, N., 2017. Managing biological control services through multi-trophic 504
trait interactions: review and guidelines for implementation at local and landscape scales.
505
Biol. Rev. in press, doi: 10.1111/brv.12346.
506
R Core Team, 2016. R: a language and environment for statistical computing. R version 3.3.2.
507
R Foundation for Statistical Computing, Vienna.
508
Reganold, J.P., Wachter, J.M., 2016. Organic agriculture in the twenty-first century. Nature 509
Plants 2, 1–8.
510
Robinson, R.A., Sutherland, W.J., 2002. Post-war changes in arable farming and biodiversity 511
in Great Britain. J. Appl. Ecol. 39, 157–176.
512
Roschewitz, I., Gabriel, D., Tcharntke, T., Thies, C., 2005. The effects of landscape 513
complexity on arable weed species diversity in organic and conventional farming. J.
514
Appl. Ecol. 42, 873–882.
515
Rundlöf, M., Bengtsson, J., Smith, H.G., 2007. Local and landscape effects of organic 516
farming on butterfly species richness and abundance. J. Appl. Ecol. 45, 813–820.
517
Rundlöf, M., Edlund, M., Smith, H.G., 2009. Organic farming at local and landscape scales 518
benefits plant diversity. Ecography 33, 514–522.
519
Rundlöf, M., Nilsson, H., Smith, H.G., 2008. Interacting effects of farming practice and 520
landscape context on bumble bees. Biol. Conserv. 141, 417–426.
521
Schmidt, M.H., Roschewitz, I., Thies, C., Tscharntke, T., 2005. Differential effects of 522
landscape and management on diversity and density of ground-dwelling farmland 523
spiders. J. Appl. Ecol. 42, 281–287.
524
Schneider, M.K., Lüscher, G., Jeanneret, P., Arndorfer, M., Ammari, Y., Bailey, D., Balázs, 525
K., Báldi, A., Choisis, J.-P., Dennis, P., Eiter, S., Fjellstad, W., Fraser, M.D., Frank, T., 526
Friedel, J.K., Garchi, S., Geijzendorffer, I.R., Gomiero, T., Gonzalez-Bornay, G., Hector, 527
A., Jerkovich, G., Jongman, R.H.G., Kakudidi, E., Kainz, M., Kovács-Hostyánszki, A., 528
Moreno, G., Nkwiine, C., Opio, J., Oschatz, M.-L., Paoletti, M.G., Pointereau, P., 529
Pulido, F.J., Sarthou, J.-P., Siebrecht, N., Sommaggio, D., Turnbull, L.A., Wolfrum, S., 530
Herzog, F., 2014. Gains to species diversity in organically farmed fields are not 531
propagated at the farm level. Nat. Comm. 5, 1–9.
532
Steckel, J., Westphal, C., Peters, M.K., Bellach, M., Rothenwoehrer, C., Erasmi, S., Scherber, 533
C., Tscharntke, T., Steffan-Dewenter, I., 2014. Landscape composition and configuration 534
differently affect trap-nesting bees, wasps and their antagonists. Biol. Conserv. 172, 56–
535
64.
536
Steffan-Dewenter, I., Münzenberg, U., Bürger, C., Thies, C., Tscharntke, T., 2002. Scale- 537
dependent effects of landscape context on three pollinator guilds. Ecology 83, 1421–
538
1432.
539
Steffan-Dewenter, I., Tscharntke, T., 1999. Effects of habitat isolation on pollinator 540
communities and seed set. Oecologia 121, 432–440.
541
Sutcliffe, L.M.E., Batáry, P., Kormann, U., Báldi, A., Dicks, L.V., Herzon, I., Kleijn, D., 542
Tryjanowski, P., Apostolova, I., Arlettaz, R., Aunins, A., Aviron, S., Baležentiene, L., 543
Fischer, C., Halada, L., Hartel, T., Helm, A., Hristov, I., Jelaska, S.D., Kaligarič, M., 544
Kamp, J., Klimek, S., Koorberg, P., Kostiuková, J., Kovács-Hostyánszki, A., 545
Kuemmerle, T., Leuschner, C., Lindborg, R., Loos, J., Maccherini, S., Marja, R., Máthé, 546
O., Paulini, I., Proença, V., Rey-Benayas, J., Sans, F.X., Seifert, C., Stalenga, J., 547
Timaeus, J., Török, P., van Swaay, C., Viik, E., Tscharntke, T., 2015. Harnessing the 548
biodiversity value of Central and Eastern European farmland. Divers. Distrib. 21, 722–
549
730.
550
Tscharntke, T., Klein, A.M., Kruess, A., Steffan-Dewenter, I., Thies, C., 2005. Landscape 551
perspectives on agricultural intensification and biodiversity – ecosystem service 552
management. Ecol. Lett. 8, 857–874.
553
Tscharntke, T., Tylianakis, J.M., Rand, T.A., Didham, R.K., Fahrig, L., Batáry, P., Bengtsson, 554
J., Clough, Y., Crist, T.O., Dormann, C.F., Ewers, R.M., Fründ, J., Holt, R.D., 555
Holzschuh, A., Klein, A.M., Kleijn, D., Kremen, C., Landis, D.A., Laurance, W., 556
Lindenmayer, D., Scherber, C., Sodhi, N., Steffan-Dewenter, I., Thies, C., van der 557
Putten, W.H., Westphal, C., 2012. Landscape moderation of biodiversity patterns and 558
processes – eight hypotheses. Biol. Rev. 87, 661–685.
559
Tuck, S.L., Winqvist, C., Mota, F., Ahnström, J., Turnbull, L.A., Bengtsson, J., 2014. Land- 560
use intensity and the effects of organic farming on biodiversity: a hierarchical meta- 561
analysis. J. Appl. Ecol. 51, 746–755.
562
Tylianakis, J.M., Tscharntke, T., Klein, A.-M., 2006. Diversity, ecosystem function, and 563
stability of parasitoid host interactions across a tropical habitat gradient. Ecology 87, 564
3047–3057.
565
Westphal, C., Steffan-Dewenter, I., Tscharntke, T., 2006. Bumblebees experience landscapes 566
at different spatial scales: possible implications for coexistence. Oecologia 149, 289–
567
300.
568
Figure captions 569
570
Fig. 1. Insect-pollinated forb species richness (a) and cover [%] (b) in boundaries of 571
conventionally and organically managed winter wheat fields in small-scale and large-scale 572
agricultural landscapes. Error bars represent SEM (n = 36).
573 574
Fig. 2. Bumble bee species richness (a) and abundance (c) and solitary bee species richness 575
(b) and abundance (d) in boundaries of conventionally and organically managed winter wheat 576
fields in small-scale and large-scale agricultural landscapes. Error bars represent SEM (n = 577
36).
578 579
Fig. 3. Genus richness (a) and cell number (b) of trap-nesting bees and number of parasitized 580
cells (c) in boundaries of conventionally and organically managed winter wheat fields in 581
small-scale and large-scale agricultural landscapes. Error bars represent SEM (n = 36).
582
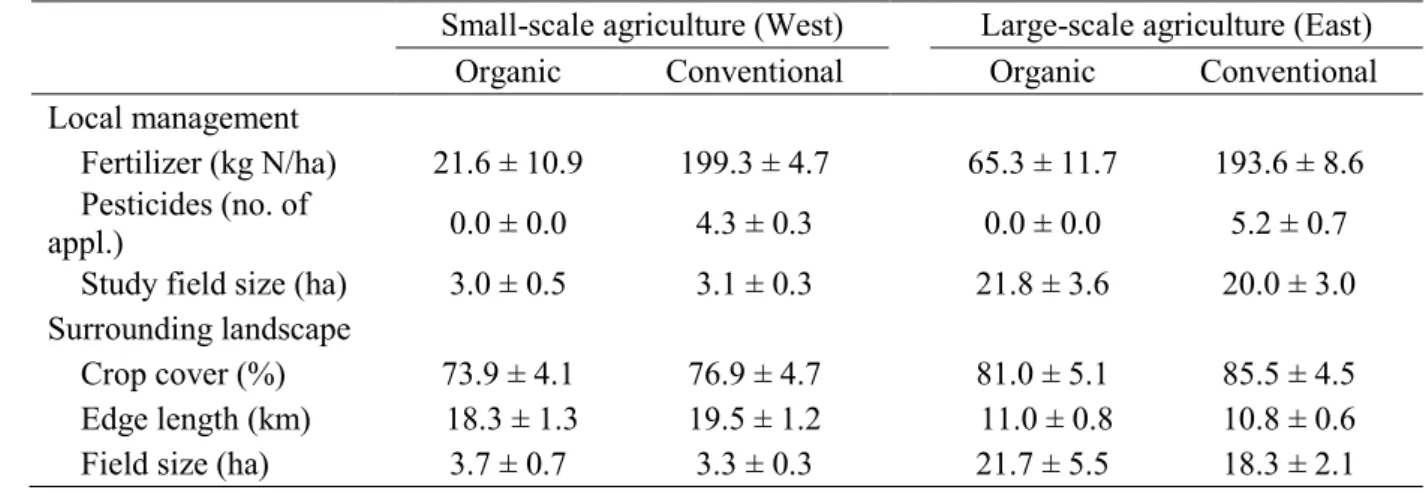
Table 1. Local management intensity and landscape structure (in 500 m buffer) around study 583
fields (n = 36 fields) in small (West) vs. large (East) scale agricultural systems with organic 584
vs. conventional management (mean ± SEM) during 2013 (based on Batáry et al. 2017) 585
Small-scale agriculture (West) Large-scale agriculture (East) Organic Conventional Organic Conventional Local management
Fertilizer (kg N/ha) 21.6 ± 10.9 199.3 ± 4.7 65.3 ± 11.7 193.6 ± 8.6 Pesticides (no. of
appl.) 0.0 ± 0.0 4.3 ± 0.3 0.0 ± 0.0 5.2 ± 0.7
Study field size (ha) 3.0 ± 0.5 3.1 ± 0.3 21.8 ± 3.6 20.0 ± 3.0 Surrounding landscape
Crop cover (%) 73.9 ± 4.1 76.9 ± 4.7 81.0 ± 5.1 85.5 ± 4.5
Edge length (km) 18.3 ± 1.3 19.5 ± 1.2 11.0 ± 0.8 10.8 ± 0.6 Field size (ha) 3.7 ± 0.7 3.3 ± 0.3 21.7 ± 5.5 18.3 ± 2.1 586
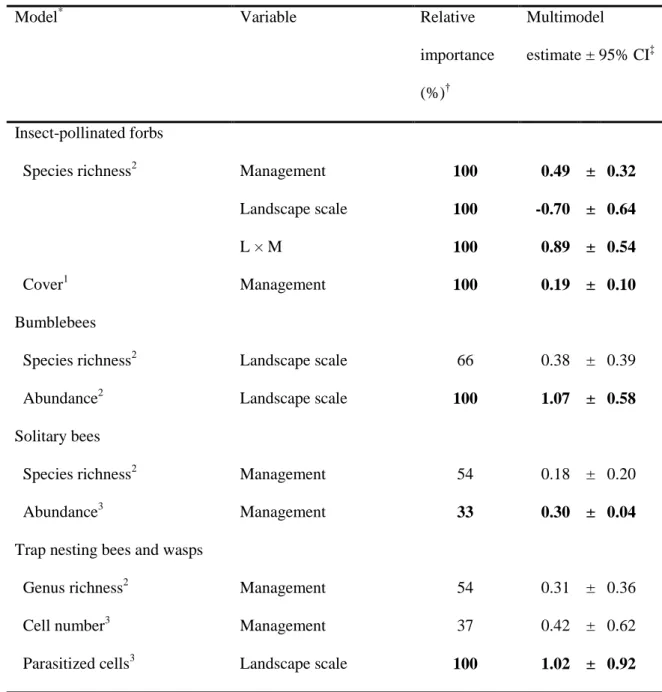
Table 2. Summary table for GLMM results after multimodel averaging of best candidate 587
models showing relative importance of each explanatory variable (Management (M): organic 588
vs. conventional; Landscape scale (L): large-scale vs. small-scale agriculture), its estimated 589
effect on the response ± 95% CI. Bold values indicate significant effect at P = 0.05 590
Model* Variable Relative
importance (%)†
Multimodel
estimate ± 95% CI‡
Insect-pollinated forbs
Species richness2 Management 100 0.49 ± 0.32
Landscape scale 100 -0.70 ± 0.64
L × M 100 0.89 ± 0.54
Cover1 Management 100 0.19 ± 0.10
Bumblebees
Species richness2 Landscape scale 66 0.38 ± 0.39
Abundance2 Landscape scale 100 1.07 ± 0.58
Solitary bees
Species richness2 Management 54 0.18 ± 0.20
Abundance3 Management 33 0.30 ± 0.04
Trap nesting bees and wasps
Genus richness2 Management 54 0.31 ± 0.36
Cell number3 Management 37 0.42 ± 0.62
Parasitized cells3 Landscape scale 100 1.02 ± 0.92
*Models were fitted with normal (1), Poisson (2), or negative binomial distribution (3).
†Each variable’s importance within the set of best candidate models (∆AICc < 2).
‡Estimates after multimodel averaging of the best candidate models (∆AICc < 2).
591 592
Fig. 1.
593
594 595
Fig. 2.
596
597 598
Fig. 3.
599
600 601