1
Carabid functional diversity is enhanced by conventional flowering fields, organic winter 1
cereals and edge habitats 2
Christoph Gayer1*, Gábor L. Lövei2, Tibor Magura3, Martin Dieterich4 & Péter Batáry5,6 3
4
1Institute of Landscape and Environment (ILU), University of Applied Science Nürtingen- 5
Geislingen, 72622 Nürtingen, Germany;
6
2Department of Agroecology, Flakkebjerg Research Center, Aarhus University, 4200 Slagelse, 7
Denmark;
8
3Department of Ecology, University of Debrecen, 4032 Debrecen, Hungary;
9
4Landscape Ecology and Vegetation Science, University of Hohenheim, 70599 Stuttgart, 10
Germany;
11
5Agroecology, University of Göttingen, 37077 Göttingen, Germany;
12
6MTA ÖK Lendület Landscape and Conservation Ecology Research Group, Vácrátót, Hungary.
13 14
*Corresponding author: Hechingerstr. 12, 72622 Nürtingen, Germany. Tel.: +49-07022- 15
201257. E-mail: christoph.gayer@hfwu.de (C. Gayer).
16
2 Abstract
17
The continued decline in farmland biodiversity in Europe despite substantial funding for agri- 18
environment schemes (AES) has prompted calls for more effective biodiversity conservation 19
measures. The current AES regime allows for both holistic measures, such as organic farming, 20
that broadly target the agricultural environment and biodiversity-specific measures, but little is 21
known of their relative efficacies. To address this gap, we studied carabids in 48 arable fields 22
that presented four crop types under different management practices along a gradient of 23
landscape complexity: (a) conventionally managed crop (winter wheat), (b) biodiversity- 24
specific AES under conventional management (sown flowering field), (c) organically managed 25
mono-crop (winter spelt) and (d) organically managed lentil-mixed crop (lentil intercropped 26
with cereal or camelina). For these four crop-use types we compared functional diversity of 27
carabid assemblages at the edge and center of the fields. Using pitfall traps, we collected more 28
than 55,000 carabids of 95 species over two years. We characterized diversity using community 29
weighted means and functional divergence of three ecological traits – body size, feeding type, 30
and flight ability. Conventional flowering fields and organic winter spelt, but not organic spring 31
sown lentil-mixed-crop, increased the proportion of plant feeding carabids; moreover, trait 32
characteristics and their divergences were most affected by field edges, with smaller, less 33
carnivorous and more flight-enabled species found there than in the center. Distribution of body 34
size and feeding type but not of flight ability was higher within carabid assemblages at the field 35
edges than centres. Surrounding landscape complexity did not affect carabid traits. We 36
conclude that future AES policy should avoid strict decisions between biodiversity specific- 37
and holistic measures. Instead, priority should be given to a diversity of different measures, 38
targeting the enhancement of edge habitats as well as productive and non-productive measures.
39 40
Keywords: Agri-environmental schemes, arable fields, field margins, herbivores, landscape 41
structure, traits, 42
3 1. Introduction
43
To halt the loss of farmland biodiversity in the European Union, agri-environment schemes 44
(AES) provide financial support to farmers who follow environmentally friendly practices 45
(Henle et al., 2008). Although the EU allocates a significant portion of its budget to AES (€ 2.5 46
billion y-1), biodiversity continues to decline (Flohre et al., 2011; Westerink et al., 2017). This 47
has led to repeated calls for more effective biodiversity conservation in agri-environment 48
schemes (Kleijn & Sutherland, 2003; Kleijn et al., 2011; Batáry et al., 2015). How to create 49
such schemes requires insight into the impact of specific agri-environment measures on 50
farmland biodiversity.
51
Recently, different types of AES have been implemented, targeting either the 52
establishment of non-productive areas (e.g. sown flowering field schemes) or the reduction of 53
farming intensity in productive areas (e.g. organic farming) (Mader et al., 2017). Sown 54
flowering fields have become an increasing out-of-production practice within arable farming 55
regions in Europe (e.g. England, Germany and Switzerland) targeting biodiversity conservation 56
as their main objective (Haaland et al., 2011; Batáry et al., 2015; Boetzl et al., 2018). Instead, 57
organic farming, which is supported under the AES regime in Europe , follows a more holistic 58
approach focusing on ecologically responsible low input agriculture (IFOAM, 2005). Hence, 59
biodiversity conservation is just one of several objectives of organic farming. Compared to 60
organic farming system, a history of shorter crop rotations as well as long term effects of 61
pesticide and mineral fertilizer applications in conventional farming systems (Bruggen et al., 62
2016) might lessen or even neutralize any beneficial effects on biodiversity from sown 63
flowering fields. The question remains could a more targeted biodiversity conservation AES 64
deliver greater results than measures that focus broadly on the overall agricultural 65
environment?
66
Despite high subsidies, direct comparisons of the biodiversity conservation effects of 67
different AES measures and organic farming are rare. Most studies focus on abundance, species 68
4
richness or community composition (Caro et al., 2016; Labruyere et al., 2016b; Mader et al., 69
2017). Meanwhile, the central question of how different AEMs affect functional diversity based 70
on species traits has received scant attention (Rusch et al., 2013; but see Boetzl et al., 2018).
71
Focusing on functional rather than taxonomic diversity can provide more insight into the 72
mechanisms by which changes in land use impact biodiversity (Rusch et al., 2013;Woodcock et 73
al., 2014; Gallé et al. 2018a). Functional diversity also provides a more sensitive determinant of 74
environmental changes and ecosystem processes (de Bello et al., 2010; Woodcock et al., 2014).
75
Hence, it is essential to understand the effects of different AEMs and farming types on 76
functional diversity in order to increase the effectiveness of future AES regimes.
77
As study organisms, we chose ground beetles (Coleoptera: Carabidae) because they are 78
highly sensitive towards habitat change and agricultural practices such as tillage or pesticide 79
use (Lövei & Sunderland 1996), and they can respond to the degree of extensiveness of farming 80
practice (Caro et al., 2016). Establishing flowering fields or organic farming can alter carabid 81
assemblages and their trait composition, but effects vary depending on which traits and AES 82
measures are considered. For instance, Mader et al. (2017) observed no significant differences 83
in body size distribution of carabids between organically farmed cereals and sown flowering 84
fields, but Boetzl et al. (2018) found significant effects of flowering fields on body size as well 85
as feeding type distribution of carabid assemblages. Flight ability also responds to different 86
farming practices (e.g. Ribera et al., 2001; Caprio et al., 2015).
87
Irrespective of local habitat management, carabids within arable fields might also be 88
affected by edge effects from bordering non-cultivated habitats such as grassy field margins 89
that provide shelter, overwintering habitat and other resources (Schirmel et al., 2016; Gallé et 90
al., 2018b). Due to spillover effects, grassy field margins can shape trait characteristics of 91
arthropod assemblages in arable fields as they provide different ecological niches by a 92
contrasting disturbance regime, microclimate, vegetation structure and –composition compared 93
to arable fields (Rouabah et al., 2015; Labruyere et al., 2016b; Schirmel et al., 2016).
94
5
Consequently, functional diversity might differ considerably between the edges and the center 95
of arable fields. The complexity of the surrounding landscape can be a further important factor 96
in shaping both carabid assemblages and functional composition (e.g. Purtauf et al., 2005a). For 97
example, simple landscapes support smaller carabids than do complex ones (Gallé et al., 98
2018b), and carnivorous species show stronger response to landscape structure than do 99
herbivorous ones (Woodcock et al., 2010).
100
Here we aimed to study functional diversity of carabid assemblages in response to three 101
agri-environmental measures: a biodiversity specific AES under conventional management 102
(sown flowering fields) and mono-, as well as a mixed-crop under organic management.
103
Conventionally managed winter wheat fields served as control. For these four crop-use types, 104
we assessed the distribution and divergence of three ecological traits of the resident carabid 105
assemblages: body size, feeding type, and flight ability. Specifically, we posed the following 106
questions: (1) whether functional diversity of carabid assemblages differs between the four 107
crop-use types, (2) whether there are differences between the edge and the centre of arable 108
fields irrespective of crop-use type, (3) how the functional diversity of carabid assemblages is 109
shaped by the complexity of the surrounding landscape.
110 111
2. Materials and methods 112
2.1. Study area and study design 113
We studied carabid assemblages under four crop-use types: (a) conventionally managed winter 114
wheat (Triticum aestivum L.), (b) conventionally managed sown flowering fields, (c) 115
organically managed winter spelt (Triticum aestivum subsp. spelta L) and (d) organically 116
managed lentil with supporting crop (Lens culinaris Medic. intercropped with 117
cereal or camelina, Camelina sativa L.). Each crop-use type was sampled in 12 sites over two 118
years (2016 and 2017) with a sample size of six in each of the two study years (ntotal = 12). In 119
each study year we chose different study fields for each crop-use type due to crop rotation.
120
6
We selected 48 study fields (4 crop-use types × 6 sites × 2 years) in the Central Swabian 121
Jurassic mountains in south-western Germany (Appendix A1 in supplementary material). All 122
sites are located within the UNESCO Biosphere Reserve Swabian Alb. The Swabian Alb is a 123
low mountainous area situated in the center of the state of Baden-Württemberg, Germany. Due 124
to a history of small-scale land use, the region is characterized by small field sizes. Terrain 125
elevation of the Swabian Alb ranges between 460 and 860 m a.s.l. (Egorov et al., 2017). Soils 126
were shallow and poor luvisols or cambisols with a bedrock of White Jurassic limestone (IUSS 127
WG WRB, 2015).
128
We sampled carabids along two transects per study field (n = 96 transects). One transect 129
was placed at the field edge within the first crop row adjacent to a grassy margin (permanent 130
meadow strip) as a standardized neighboring habitat, mostly accompanied by field paths. When 131
no bordering grassy field margin was available, we chose a fertilized grassland as bordering 132
habitat (4 cases). The central transect was placed orthogonally to the edge transect within the 133
study field forming a “T” shape (Fig. S1); this was necessary due to the small width of some 134
study fields (minimum width 24 m). The minimum distance between the edge and the center 135
transects was standardized to 12 m in 2016 and 15 m in 2017 for all study fields. This 136
minimum distance (smallest possible distance between edge and center) was always determined 137
according to the smallest study field. The mean field size was 2.2 hectares (ha) (SE: 0.2 ha) 138
with similar field sizes between crop-use types (winter wheat: 2.3 ± 0.5 ha; flowering field: 2.3 139
± 0.6 ha; winter spelt: 2.0 ± 0.3 ha; lentil-mixed-crop: 2.1 ± 0.6 ha) and varied between study 140
sites from 1.4 ± 0.3 ha to 3.4 ± 1.5 ha.
141
To study the impact of landscape complexity, crop-use type and transect position (field 142
edge vs. center) on functional diversity, we applied a fully cross-nested design, spatially nesting 143
crop-use types per study site (Fig. S1). Each study site spatially blocked the four crop-use 144
types. We selected twelve study sites (six per study year) in order to standardize the effects of 145
landscape context and local site conditions (soil and climate) across crop-use types. The mean 146
7
minimum distance between study fields in the same site was much smaller (0.63 ± 0.1 km) than 147
the minimum distance between study fields of different study sites (4.7 ± 0.9 km). Within each 148
study site, the two conventional crop-use types (winter wheat, flowering field) as well as the 149
two organic crop-use types (winter spelt, lentil-mixed-crop) were farmed by the same farmer 150
(conventional or organic). The pairwise nesting of study fields within each study site 151
minimized the potential impact of variable farming practices by different farmers. Besides this 152
double nesting, crop-use types were also crossed over management type (conventional vs.
153
organic), as each management type always had one flowering (flowering field, lentil-mixed- 154
crop) and one cereal (winter wheat, winter spelt) crop associated with it. The result was a cross- 155
nested study design.
156 157
2.2. Farming characteristics of study fields 158
Data on the farming practice used on each study field were collected via personal interviews 159
with the farmers (n = 24) using a standardized questionnaire. Annual nitrogen supply (kgNha-1) 160
was calculated by summing the amount of applied mineral and/or organic fertilizers. While 161
farmers gave precise information about the amount of mineral fertilizers used, information 162
about organic fertilizer was less accurate and therefore recorded by type (liquid manure or 163
dung) and quantity (m³ of liquid manure, kg of dung). To calculate the amount of applied 164
nitrogen by organic substrates, we multiplied the quantity of the used substrate with standard 165
values for nitrogen content: 4.0 kg N (m³)-1 for liquid manure and 5 kg N t-1 for dung (Fritsch, 166
2012). We characterized pesticide use by the number of applications of herbicide, fungicide or 167
insecticide.
168
Flowering fields were annual set-asides sown with a standard seed mixture of 15 to 18 169
flowering plant species, predominantly non-native but nonetheless traditionally cultivated in 170
German horti- or agriculture (see Table S1 for a species list). Nine flowering fields were sown 171
with seeding mixture M2 and three fields were sown with the mixture M1 (Table S1). AES 172
8
regulations (MLR, 2016) do not allow management measures on flowering fields (no pesticide, 173
no fertilizer, no tillage after sowing) for one year after their establishment.
174
The two organic crops were subsidized through standard AES support for organic 175
farming. In contrast to conventional flowering fields, they are not a specific AES type within 176
the AES regime of the study area (Baden-Württemberg). The lentil crop was a flowering 177
legume sown with a row spacing of approximately 13.5-15 cm (Gruber et al., 2012). It was 178
sparsely intercropped (same row spacing) with camelina (three sites), barley (Hordeum 179
vulgare; three sites) or oats (Avena sativa; six sites) in order to stabilize the lentil plants (Table 180
S2, Fig. S2, for details about lentil mixed-cropping systems see Wang et al., 2012).
181
The four crop-use types differed in sowing time (autumn vs. spring sown crop), crop type 182
(cereal vs. flowering plant) and management type (conventional vs. organic farming) (Table 1, 183
Table S2). Cereal crops (winter wheat and winter spelt) were always sown in the autumn of the 184
preceding year, while flowering crops (flowering field and lentil-mixed-crop) were sown in the 185
spring. Herbicides, fungicides, insecticides and mineral fertilizers were only applied to winter 186
wheat; mechanical weed control was only used in winter spelt. Compared to the conventional 187
crop-use types, organic crop-use types had a more diverse crop rotation, more perennial crops 188
(mainly clover-mixtures), and more plow-free soil tillage before sowing (Table 1, Table S2).
189
Organic farming practices followed the European standards (The Council of the European 190
Union, 2005), and all organic farmers were certified by the Bioland Association, with the 191
exception of one, who was certified by the Demeter Association. Yields as well as subsidies 192
under AES differed between the crop-use types (Table 1).
193 194
2.3. Landscape analysis 195
To take into account potential landscape effects, we analyzed landscape complexity within a 196
radius of 500 m around the midpoint of each study transect (n = 96). Arable land was the most 197
abundant land cover type with 56.7 ± 1.8 % of total cover (mean ± SEM) showing a distinct 198
9
gradient between study fields ranging from 15.1% to 83.0% of arable land cover. Arable land 199
cover was independent of crop-use types (χ2 = 5.4, df = 3, p = 0.15) or transect position (χ2 <
200
0.01, df = 1, p = 0.99). Arable land cover was significantly negatively correlated with land use 201
diversity (Shannon index; r94 = - 0.83, p < 0.001) and forest cover (r94 = - 0.68, p < 0.001). This 202
allowed us to use arable land cover as a simple predictor of landscape complexity. The 203
Shannon index was calculated from the percentage cover of arable land, intensively managed 204
grassland (e.g. fertile meadow), extensive grassland (e.g. calcareous grassland), copses (hedges, 205
shrubs, single trees), forest, wetland (including water bodies) and urban elements. Landscape 206
data were obtained from the project ,,Flächendeckende Biotop und Nutzungstypenkartierung im 207
Biosphärengebiet Schwäbische Alb mittels Fernerkundungsdaten als Basis für ein 208
Landschaftsmonitoring“, which provided an area-wide classification of habitat complexes of 209
the Biosphere Reserve Swabian Alb based on multisensoral remote sensing and environmental 210
geodatasets (for details see Schlager et al., 2013). Landscape analysis was conducted using the 211
Geographical Information System ArcGIS 10.2.2 (1999-2014 ESRI Inc.).
212 213
2.4. Carabid and plant survey 214
We sampled carabids by pitfall traps consisting of a polyvinychlorid (PVC) tube (diameter 7.2 215
cm, height 10 cm) into which a fitting 200 ml polyethylene beaker was inserted and filled with 216
approx. 100 ml of a 30% ethylene glycol solution. A drop of non-scented detergent was added 217
to reduce surface tension. To prevent vertebrate bycatch, a wire netting (20 mm mesh size) was 218
installed approx. 3 cm beneath the opening. To prevent flooding, we placed a coated pressboard 219
roof (approx. 15 cm × 15 cm) supported by a pair of 10 cm long iron nails. Traps were arranged 220
along transects in the field edge and the field center. In each study field, we placed five traps at 221
the edge and another five in the center, yielding 10 traps per study field, for a total of 240 traps 222
per year. Distance between traps within each transect was standardized to 10 m to minimize 223
spatial autocorrelation. During sampling collection, trap contents were pooled within each 224
10
transect. A sampling round lasted for 10 consecutive days. Between each sampling round, traps 225
were kept closed for 10 days before the next sampling round started.
226
In the first study year, we conducted carabid trapping in three sampling rounds between 227
15 June and 3 August 2016, while in the second year, we used two sampling rounds between 15 228
June and 16 July 2017. In both years, we finished trapping immediately before crops were 229
harvested or plowed. The overall sampling represented 12,000 trap days (240 traps × 50 230
trapping days). All trapped carabids were preserved in 70% ethanol and later further identified 231
to species level.
232
As vegetation structure and composition can strongly influence habitat conditions for 233
carabids (Rouabah et al., 2015), we surveyed plant cover and species richness in order to 234
examine differences between crop-use types. For details see the supplementary material 235
(Appendix A2, Table S3).
236
During the sampling period, mean temperature and rainfall was 14.7 °C with 195.9 mm 237
rain in June and 17.0 °C with 83.7 mm rain in July 2016. In 2017, the means were 17.2 °C and 238
96.9 mm in June and 16.5 °C and 199.9 mm in July (dates from nearest meteorological station 239
Münsingen-Apfelstetten, URL: https://cdc.dwd.de/, accessed 15.08.2015). For further analysis, 240
we pooled data of all sampling occasions per transect per year.
241 242
2.5. Carabid trait analysis 243
To assess the functional diversity of carabids, we collected three functional trait values – body 244
size, feeding type and flight ability – for each species according to the literature (Table S4.).
245
Body size was calculated as the geometric mean of minimum and maximum values in 246
Homburg et al. (2014), followed by standardization to a range between 0 and 1 to decrease the 247
effect of high values from large species (Gallé et al. 2018a). Feeding type was classified as 248
herbivorous (including spermophagous), omnivorous or carnivorous based on the literature 249
(Larochelle, 1990; Ribera et al., 2001; Purtauf et al., 2005a). Flight ability was categorized 250
11
using wing morphology as fully winged, dimorphic or short winged/wingless using data from 251
Hurka (1996).
252
We used community weighted means (CWM) of trait values to determine if specific trait 253
characteristics of carabid assemblages were shaped by landscape complexity, crop-use type or 254
transect position (Lavorel et al., 2008; Ricotta and Moretti, 2011). Further, we calculated 255
functional divergence (FDvar) as a measure of functional trait distribution within carabid 256
assemblages. FDvar values are higher when the abundance is higher towards either one or both 257
margins of the trait distribution, and lower when abundance is concentrated towards the 258
average trait value (Pla et al., 2012). We calculated FDvar indices according to Leps et al.
259
(2006) and used the R package ‘FD’ to calculate CWM values (Laliberté et al., 2014).
260 261
2.6. Statistical analysis 262
We used linear mixed-effects models to statistically test for differences in farming practices 263
between crop-use types and study years using the ‘lme4’ package (Bates et al., 2015) in the R 264
program environment (R Development Core Team, 2017). To take into account the cross- 265
nested design, we included the factors ‘site’, ‘farmer’ and ‘crop type’(cereal vs. flowering crop) 266
as nested random effects and ‘crop-use type’ and ‘year’ as fixed effects in the models by using 267
the following R-syntax:
268
“lmer(y ~ Crop-use type+ Year + (1|Site/Farmer) + (1|Site/Crop type)”.
269
We performed model diagnostics to test for normal distribution of model residuals by 270
investigating normal quantile-quantile plots and plotting model residuals against fitted values to 271
visualize error distribution and check for heteroscedasticity. We applied the same approach to 272
testing for differences in vegetation characteristics between years, crop-use types and transects.
273
We used the above R-syntax for testing differences in arable land cover over a 500 m 274
radius around study fields with ‘crop-use type’ and ‘transect’ (edge and center) as single and 275
interacting fixed effects in the model using the R package ‘car’ (Fox et al., 2012) to perform a 276
12
type-II Wald Chi-squared test to assess significant differences between crop-use types and 277
transects. Habitat diversity was characterized by the Shannon index, calculated using the 278
‘vegan’ package in R (Oksanen et al., 2015). Pearson’s product-moment correlation was 279
calculated for testing correlations between arable land cover and habitat diversity as well as 280
forest cover.
281
Linear mixed-effects models and model averaging methods were applied to test for 282
significant effects of landscape complexity, crop-use type, transect position and their 283
interactions on carabid functional diversity (CWM, FDvar). Species richness and activity 284
density of carabids did not differ significantly between study years, therefore ‘year’ was used 285
as an additional random factor. We included the factors ‘year’, ‘farmer’, ‘site’ and ‘crop type’
286
as nested random effects as well as ‘landscape complexity’, ‘crop-use type’ and ‘year’ as fixed 287
effects in the model according to the R syntax:
288
“lmer(y ~ (Landscape Complexity+Crop-use type+Transect)3 + (1|Year/Site/Farmer) + (1|Year/Site/Crop
289
type)”.
290
We generated a set of all possible linear combinations of predictor variables for the above 291
model using the function ‘dredge’ of the ‘MuMIn’ package in R (Barton, 2017), which ranks 292
candidate models according to Akaike’s Information Criteria corrected for small sample sizes 293
(AICc). The models with < 2 ΔAICc of the best model (i.e. the model with the lowest AICc) 294
were selected for model averaging using the function ‘model.avg’ of the ‘MuMIn’ package. If 295
only one model was left after model selection, we calculated a linear mixed-model with just 296
one explanatory factor (the one from the remaining model) without model selection or 297
averaging.
298 299
3. Results 300
In total, we collected 55,165 carabids individuals of 95 species (listed in Table S3). The four 301
most abundant species Pterostichus melanarius (39.1%), Poecilus cupreus (20.1%), Harphalus 302
13
rufipes (11.3%), and Anchomenus dorsalis (9.8%) accounted for 80.2 % of the samples. We 303
collected 8,894 carabids representing 62 species from conventional winter wheat fields, 13,327 304
carabids from 72 species from conventional flowering fields, 17,563 carabids from 76 species 305
from organic winter spelt fields and 15,381 carabids from 67 species from organic lentil-mixed- 306
crop fields.
307
Crop-use type had high importance on feeding type but not body size or flight ability of 308
the carabid assemblages (Table 2 and Fig. 2). Conventional flowering- and organic winter spelt 309
fields, but not spring sown organic lentil mixed-crop fields, had a higher proportion of plant- 310
feeding (omnivorous and herbivorous) carabids than that found in winter wheat fields. Feeding 311
type distribution was not considerable different in organically managed winter spelt compared 312
to lentil-mixed-crop fields, but more plant-feeding carabids were found in flowering fields 313
compared to lentil mixed-crops. Landscape complexity did not affect any trait characteristic or 314
its variance (FDvar) (Table 2).
315
Transect position had strong effects on all traits studied (Table 2). Compared with those 316
in field centers, carabid assemblages at the field edges were on average smaller, had more 317
plant-feeding carabids and showed increased flight ability. These mean differences were 318
independent of landscape complexity or crop-use type. The variance of body size and feeding 319
type distribution (FDvar) was higher within carabid assemblages at the field edges than centres 320
(Table 2, Fig. S3a,b). No such difference was found in flight ability (Fig. S3c). The edge effects 321
on feeding type, flight ability and variance in feeding type were most pronounced in winter 322
wheat fields, showing a stronger increase in carnivorous species (Fig. 2a), and a stronger 323
decrease in variance of feeding types (Fig. S3a) as well as in flight ability (Fig. 2c) than 324
elsewhere, although interactions between transect position and crop-use type were not included 325
in the averaged models.
326 327
4. Discussion 328
14
Our study revealed that conventional flowering fields and organic winter spelt, but not spring 329
sown organic lentil mixed-crops, altered the distribution of feeding traits of carabid 330
assemblages by increasing the proportion of plant-feeding carabids over that found in 331
conventional winter wheat fields. Further, trait characteristics and their divergence were most 332
influenced by a distinct difference between field edges and centres with smaller, less 333
carnivorous and more flight-enabled assemblages at the field edges. The complexity of the 334
surrounding landscape did not influence the functional diversity of carabids within crop fields.
335
These results underline the importance of local farming practices and edge habitats to 336
maintaining the functional diversity of carabid assemblages in arable fields.
337 338
4.1. Effects of crop-use type 339
Although biodiversity specific (flowering fields) and both holistic (organic farming) agri- 340
environmental measures led to considerably higher wild plant cover and species richness than 341
did conventionally farmed winter wheat (Table S3), only flowering fields and organic winter 342
spelt increased the proportion of plant feeding carabids within the ground beetle assemblages.
343
The effectiveness of flowering fields in promoting plant-feeding carabids might be associated 344
with the highest total plant species richness, mainly because they were sown with a diverse 345
seed mixture of 15/18 forb species (Table S1), whereas other crop-use types were sown with 346
just one (wheat or spelt) or two (lentil-mixed-crop) plant species. In addition, the species of 347
forb used in the flowering seed mixture varied strongly in origin (many non-native species from 348
different areas) and traits (e.g. size, growth rate, taxonomic distinctness). The overall 349
vegetation structure in flowering fields thus was probably more heterogeneous than elsewhere.
350
Vegetation heterogeneity as well as higher plant species richness can promote plant feeding 351
carabids, as they prefer diverse food resources (Harvey et al., 2008; Woodcock et al., 2009;
352
Rouabah et al., 2015).
353
Higher wild plant cover and species richness might also explain the positive effects of 354
15
organic winter spelt crops compared to conventional winter wheat. However, winter spelt crops 355
had lower wild plant cover and species richness than lentil mixed-crops (Table S3), but only the 356
former had higher proportion of plant-feeding carabids compared to conventional farming 357
systems (conventional winter wheat). This might be explained by the different sowing time of 358
the two crop-use types. Winter spelt were autumn sown, whereas lentil mixed-crops were 359
spring sown (Table 1). Hence, ripened wild plant seeds, which are an important food resource 360
for plant-feeding carabids (Kulkarni et al., 2015), were present earlier and for a longer period in 361
winter spelt compared to lentil mixed-crops. The majority of plant-feeding species in our study 362
(e.g. Amara, Pterostichus, Poecilus, Harpalus) are primarily spermophagous (Kulkarni et al., 363
2015), which might explain our findings. Herbivorous carabids are more sensitive to 364
agricultural management than carnivores (Purtauf et al., 2005b; Woodcock et al., 2009), 365
because the latter can still find abundant prey even in intensively farmed fields as they are able 366
to feed on soil-living prey (Haddad et al., 2000). In contrast, herbivores are more dependent on 367
the above-ground resources like a diversity of weeds, leading to constrained food resources 368
under intensive farming. Our study confirmed these findings, revealing the lowest proportion of 369
herbivorous carabids in the most intensively farmed crop-use type (winter wheat), which had 370
by far the lowest wild plant cover and species richness. The positive effects of flowering fields 371
for promoting plant-feeding carabids are confirmed by recent studies (Mader et al., 2017;
372
Baulechner et al., 2019). Other studies confirm the positive effects of organic compared to 373
conventional winter cereals on carabid functional diversity as well as on plant-feeding carabid 374
abundance and richness (Batáry et al., 2012; Gallé et al. 2018a). But direct comparisons 375
between flowering fields and organic crops in relation to conventional crops are currently 376
missing. Our results point to similar effects between conventional flowering fields and organic 377
winter cereals, but through different mechanisms. Spring sown flowering fields most likely 378
increased proportion of plant-feeding carabids by higher vegetation heterogeneity, whereas the 379
earlier sowing time of winter compared to spring crops might be the determining factor in 380
16
organic farming. Effects of flowering fields may appear quickly (Boetzl et al., 2018), are easier 381
to implement than conversion from conventional to organic farming, and are often preferred by 382
farmers as they allow higher flexibility and a higher level of weed control due to regular 383
plowing. On the other hand, farmers of non-productive measures such as flowering fields 384
cannot gain crop yield, therefore the subsidy costs under the AES are much higher compared to 385
productive measures such as organic farming (in our study area more than three times higher, 386
Table 1). As both showed positive effects for plant-feeding carabids, case specific balancing 387
between costs and implementability of different agri-environmental measures might be most 388
suitable in order to increase herbivorous carabid numbers in arable fields.
389
390
4.2 Edge and landscape effects 391
Trait characteristics varied strongly between the edge and the center of arable fields, consistent 392
with other studies (Birkhofer et al., 2014; Molina et al., 2014; Rouabah et al., 2015). This was 393
most likely caused by spillover effects between the bordering grassy field margin and the crop 394
field. Grassy field margins are permanent grassland strips that provide season-long food 395
resources and shelter, as they remain relatively undisturbed by agricultural activities. They are 396
important habitats for carabids, that often (but not always, Mansion-Vaquié et al., 2017) 397
disperse into arable fields with a distance-decay effect (Boetzl et al., 2018; Gallé et al., 398
2018a,b). Compared to crop fields, grassy margins have higher vegetation density, more 399
complex structure and higher diversity, a more temperate microclimate and lower soil 400
disturbance (Schirmel et al., 2016). This in turn can affect carabid assemblages (Rouabah et al., 401
2015; Labruyere et al., 2016b). The proximity of undisturbed grassy field margins, which 402
benefits herbivorous carabids (Birkhofer et al., 2014), as well as higher plant species richness at 403
the field edges explains the higher share of plant feeding carabids as well as higher feeding trait 404
diversity at field edges than in the centers.
405
Higher vegetation heterogeneity and density at the field edge may also have caused 406
17
distinct differences in carabid body size distributions. The activity density of large carabids 407
positively correlates with homogenous vegetation and low vegetation density, whereas small 408
carabids prefer high plant functional diversity and heterogeneous vegetation (Rouabah et al., 409
2015). In addition, larger carabids are more mobile than small ones (Homburg et al., 2013), and 410
therefore can disperse further into the crop fields from bordering habitats (Boetzl et al., 2018).
411
These findings can explain our findings of smaller carabids with more diverse size distribution 412
at field edges than centers.
413
We also found the flight ability of the carabid assemblage higher at the edges than 414
centers, which might be influenced by an interaction of trait characteristics. Brachypterous 415
carabids in Europe are in general medium to large carnivores, whereas macropterous species 416
are often small (Den Boer, 1970; Ribera et al., 2001). As we found larger and more carnivorous 417
species, which are often wingless or wing-dimorphic (such as the most abundant species 418
Pterostichus melanarius or the Carabus spp.), in the field centers, the observed differences in 419
flight ability could be explained by an interaction with other traits. However, as we studied 420
single ecological traits, we were unable to assess possible interactions between traits, although 421
that would make a fertile research question for future studies.
422
The most pronounced edge effect for feeding type distribution was found in the most 423
intensively farmed crop-use type – winter wheat. Within the field center, the high crop density 424
paired with extreme shortage of other plants reduced the available plant resources, thereby 425
creating suboptimal conditions for herbivorous species. The presence of pest species able to 426
cope with intensive agricultural management such as aphids or soil-living species might still 427
provide suitable food resources for carnivorous carabids (Collins et al., 2002; Rouabah et al., 428
2015). Our results suggest that such habitat conditions might be still sufficient for larger, 429
mobile, carnivorous carabids, but not for species belonging to other functional groups, which 430
may disperse to a lesser extent from the field edges into the centres.
431
Finally, local effects (crop-use type, transect position) had stronger effects on carabid trait 432
18
distribution than landscape effects, consistent with other studies analysing species richness and 433
abundance (Tuck et al., 2014; Caro et al., 2016; but see Concepción et al., 2012; Purtauf et al., 434
2005a). Several studies revealed effects of the surrounding landscape on carnivorous and seed 435
eating carabids (Labruyere et al., 2016a) or body sizes (Gallé et al., 2018b), but others failed to 436
detect significant landscape effects on carabid traits (Mader et al., 2017). Within our study 437
region, the biosphere reserve Swabian Alb, soils are poor and stony, therefore land use might 438
be less intensive compared to regions with rich soils. Possibly, the differences in landscape 439
complexity within our study area were too limited to affect carabid traits more strongly (Caro et 440
al., 2016).
441 442
5. Conclusion 443
This study highlights the importance of edge habitats, i.e., grassy field margins, for promoting 444
the functional diversity of carabids in crop fields. Furthermore, we showed that conventional 445
flowering fields and organic winter cereals are equally effective for enhancing the amount of 446
plant-feeding carabids, which might increase essential ecosystem services in arable fields, such 447
as weed seed control. Because non-productive flowering fields are easier to implement but 448
require higher amount of subsidy payments compared to organic farming, a strict decision 449
between biodiversity specific non-productive measures and productive measures might be of 450
little benefit for the successful implementation of more effective AES for biodiversity 451
conservation. Instead, future AES policy should aim at a diversity of different measures, 452
targeting the enhancement of edge habitats as well as productive and non-productive measures 453
with proven biodiversity benefits, such as flowering fields and organic winter cereals.
454 455 456
Acknowledgements 457
We thank the farmers for their participation; Nils Engelmann, Caroline Fischer, Miriam 458
19
Harper, Moritz Mayer and Nina Stork for supporting the plant survey, and Theresa Faessler, 459
Frederik Schuettler and Tobias Weiß for the sampling and identification of carabids. Data 460
collection in 2017 was funded by the Stiftung Naturschutzfonds Baden Württemberg (73- 461
8831.21/54691-1703GL). PB was supported by the Economic Development and Innovation 462
Operational Programme of Hungary (GINOP–2.3.2–15–2016–00019).
463
20 References
464
Barton, K., 2017. MuMIn: Multi-Model Inference. R package version 1.40.0. https://CRAN.R- 465
project.org/package=MuMIn.
466
Batáry, P., Holzschuh, A., Orci, K.M., Samu, F., Tscharntke, T. Responses of plant, insect and 467
spider biodiversity to local and landscape scale management intensity in cereal crops and 468
grasslands. Agric. Ecosyst. Environ. 146, 130–136.
469
Batáry, P., Dicks, L.V., Kleijn, D., Sutherland, W.J., 2015. The role of agri-environment 470
schemes in conservation and environmental management. Conserv. Biol. 29, 1006–
471
1016.
472
Bates, D., Maechler, M., Bolker, B., Walker, S., 2015. Fitting linear mixed-effects models 473
using lme4. J. Stat. Softw. 67, 1-48.
474
Baulechner, D., Diekötter, T., Wolters, V., Jauker, F. 2019. Converting arable land into 475
flowering fields change functional and phylogenetic community structure in ground 476
beetles. Biol. Conserv. 231, 51-58.
477
de Bello, F., Lavorel, S., Díaz, S., Harrington, R., Cornelissen, J.H.C., Bardgett, R.D., Berg, 478
M.P., Cipriotti, P., Feld, C.K., Hering, D., Silva, P.M. da, Potts, S.G., Sandin, L., Sousa, 479
J.P., Storkey, J., Wardle, D.A., Harrison, P.A., 2010. Towards an assessment of 480
multiple ecosystem processes and services via functional traits. Biodivers. Conserv. 19, 481
2873–2893.
482
Birkhofer, K., Wolters, V., Diekötter, T., 2014. Grassy margins along organically managed 483
cereal fields foster trait diversity and taxonomic distinctness of arthropod communities.
484
Insect Conserv. Divers. 7, 274–287.
485
Boetzl, F.A., Krimmer, E., Krauss, J., Steffan‐Dewenter, I., 2018. Agri-environmental schemes 486
promote ground-dwelling predators in adjacent oilseed rape fields: Diversity, species 487
traits and distance-decay functions. J. Appl. Ecol. https://doi.org/10.1111/1365- 488
2664.13162 489
21
Bruggen, A.H. van, Gamliel, A., Finckh, M.R., 2016. Plant disease management in organic 490
farming systems. Pest Manag. Sci. 72, 30–44.
491
Caprio, E., Nervo, B., Isaia, M., Allegro, G., Rolando, A., 2015. Organic versus conventional 492
systems in viticulture: Comparative effects on spiders and carabids in vineyards and 493
adjacent forests. Agric. Syst. 136, 61–69.
494
Caro, G., Marrec, R., Gauffre, B., Roncoroni, M., Augiron, S., Bretagnolle, V., 2016. Multi- 495
scale effects of agri-environment schemes on carabid beetles in intensive farmland.
496
Agric. Ecosyst. Environ. 229, 48–56.
497
Collins, K.L., Boatman, N.D., Wilcox, A., Holland, J.M., Chaney, K., 2002. Influence of beetle 498
banks on cereal aphid predation in winter wheat. Agric., Ecosyst. Environ. 93, 337–350.
499
Concepción, E.D., Díaz, M., Kleijn, D., Báldi, A., Batáry, P., Clough, Y., Gabriel, D., Herzog, 500
F., Holzschuh, A., Knop, E., Marshall, E.J.P., Tscharntke, T., Verhulst, J., 2012.
501
Interactive effects of landscape context constrain the effectiveness of local agri- 502
environmental management. J. Appl. Ecol. 49, 695–705.
503
Den Boer, P.J., 1970. On the significance of dispersal power for populations of carabid-beetles 504
(Coleoptera, Carabidae). Oecologia 4, 1–28.
505
Egorov, E., Gossner, M.M., Meyer, S.T., Weisser, W.W., Brändle, M., 2017. Does plant 506
phylogenetic diversity increase invertebrate herbivory in managed grasslands? Basic 507
Appl. Ecol. 20, 40–50.
508
Fischer, C., Thies, C., Tscharntke, T., 2011. Mixed effects of landscape complexity and 509
farming practice on weed seed removal. Perspect. Plant Ecol. Evol. Syst. 13, 297–303.
510
https://doi.org/10.1016/j.ppees.2011.08.001 511
Flohre, A., Fischer ,C., Aavik, T., Bengtsson, J., Berendse, F., Bommarco, R., Ceryngier, P., 512
Clement, L.W., Dennis, C., Eggers, S., Emmerson, M., Geiger, F., Guerrero, I., Hawro, 513
V., Inchausti, P., Liira, J., Morales, M.B., Onate, J.J., Pärt, T., Weisser, W.W., 514
Winquist, C., Thies, C., Tscharntke, T., 2011. Agricultural intensification and 515
22
biodiversity partitioning in European landscapes comparing plants, carabids, and birds.
516
Ecol. Appl. 21, 1772–1781.
517
Fritsch, F., 2012. Nährstoffgehalte in Düngemitteln und im Erntegut: für die Düngeplanung; für 518
Nährstoffvergleiche. Staatliche Pflanzenberatung Rheinhald-Pfalz, Germany.
519
Fox, J., Weisberg, S., Bates, D., Fox, M., 2012. Package “car”. Vienna: R Foundation for 520
Statistical Computing.
521
Gallé, R., Császár, P., Makra, T., Gallé-Szpisjak, N., Ladányi, Z., Torma, A., Ingle, K., 522
Szilassi, P., 2018b. Small-scale agricultural landscapes promote spider and ground 523
beetle densities by offering suitable overwintering sites. Landsc. Ecol. 33, 1435–1446.
524
Gallé, R., Happe, A.-K., Bosem Baillod, A., Tscharntke, T., Batáry, P., 2018a. Landscape 525
configuration, organic management and within-field position drive functional diversity 526
of spiders and carabids. J. Appl. Ecol. 56, 63-72..
527
Gruber S., Wahl E., Zikeli S., Claupein W., 2012. Perspektiven und Grenzen der 528
Unkrautregulierung bei Linsen (Lens culinaris) im Ökologischen Landbau –ein Review.
529
Perspectives and limitations of weed control in organic lentils (Lens culinaris): a 530
review. Journal für Kulturpflanzen, 64, 365-377.
531
Haaland, C., Naisbit, R.E., Bersier, L.-F., 2011. Sown wildflower strips for insect conservation:
532
a review. Insect Conserv. Divers. 4, 60–80.
533
Haddad, N.M., Haarstad, J., Tilman, D., 2000. The effects of long-term nitrogen loading on 534
grassland insect communities. Oecologia 124, 73–84.
535
Harvey, J.A., van der Putten, W.H., Turin, H., Wagenaar, R., Bezemer, T.M., 2008. Effects of 536
changes in plant species richness and community traits on carabid assemblages and 537
feeding guilds. Agric. Ecosyst. Environ. 127, 100–106.
538
Henle, K., Alard, D., Clitherow, J., Cobb, P., Firbank, L., Kull, T., McCracken, D., Moritz, 539
R.F.A., Niemelä, J., Rebane, M., Wascher, D., Watt, A., Young, J., 2008. Identifying 540
23
and managing the conflicts between agriculture and biodiversity conservation in 541
Europe–A review. Agric. Ecosyst. Environ. 124, 60–71.
542
Homburg, K., Homburg, N., Schäfer, F., Schuldt, A., Assmann, T., 2014. Carabids.org - a 543
dynamic online database of ground beetle species traits (Coleoptera, Carabidae). Insect 544
Conserv. Divers. 7, 195–205.
545
Homburg, K., Schuldt, A., Drees, C., Assmann, T., 2013. Broad-scale geographic patterns in 546
body size and hind wing development of western Palaearctic carabid beetles 547
(Coleoptera: Carabidae). Ecography 36, 166–177.
548
Hurka, K., 1996. Carabidae of the Czech and Slovak Republics. Ing. Vit Kabourek, Zlin, Czech 549
Republic.
550
IFOAM, 2005. Principles of organic agriculture, IFOAM International Federation of Organic 551
Agriculture Movements, Bonn, 4 p. available online at: http:// www.ifoam.org/.
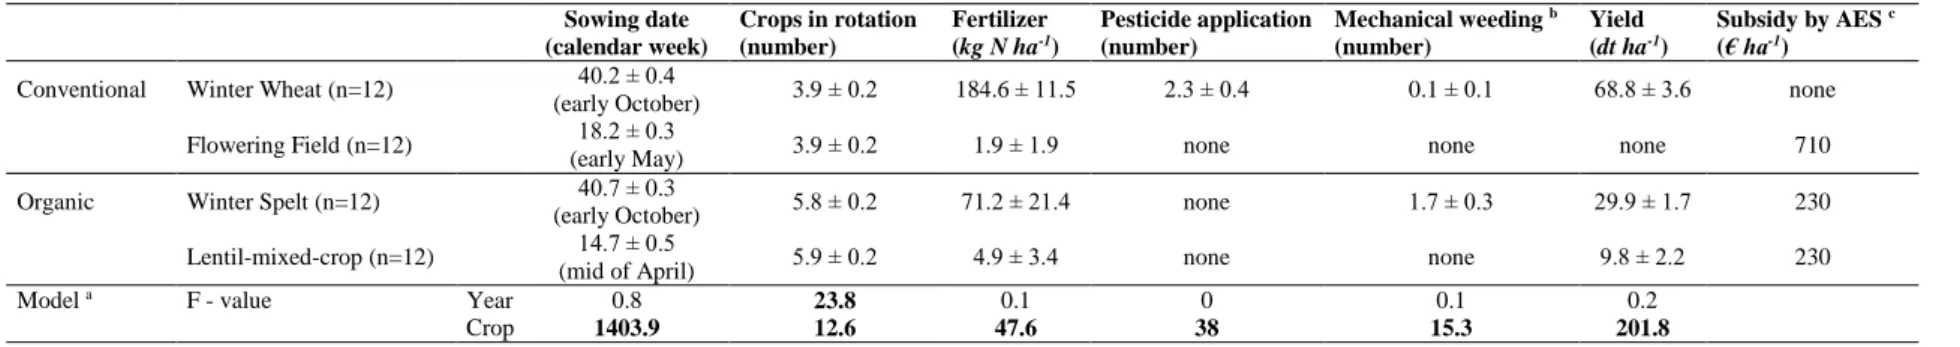
552
IUSS Working Group WRB, 2015. World reference base for soil resources 2014, update 2015, 553
international soil classification system for naming soils and creating legends for soil 554
maps. World Soil Resources Reports, 106, UN-FAO, Roma.
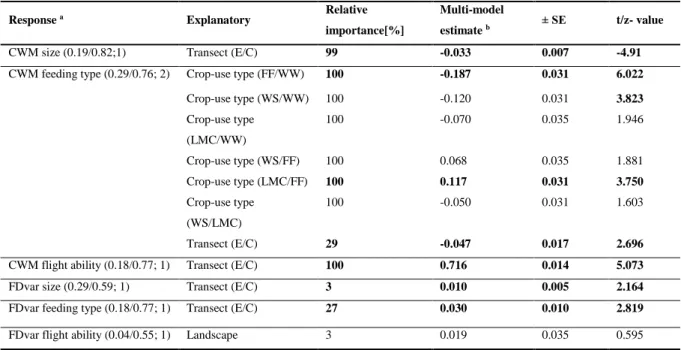
555
Kleijn, D., Rundlöf, M., Scheper, J., Smith, H.G., Tscharntke, T., 2011. Does conservation on 556
farmland contribute to halting the biodiversity decline? Trends Ecol. Evol. 26, 474–481.
557
Kleijn, D., Sutherland, W.J., 2003. How effective are European agri‐environment schemes in 558
conserving and promoting biodiversity? J. Appl. Ecol. 40, 947–969.
559
Kulkarni, S.S., Dosdall, M.S., Willenborg, J. C., 2015. The role of ground beetles (coleoptera:
560
carabidae) in weed seed consumption: a review. Weed Sci. 63, 355-376.
561
Labruyere, S., Bohan, D.A., Biju-Duval, L., Ricci, B., Petit, S., 2016a. Local, neighbor and 562
landscape effects on the abundance of weed seed-eating carabids in arable fields: A 563
nationwide analysis. Basic Appl. Ecol. 17, 230–239.
564
24
Labruyere, S., Ricci, B., Lubac, A., Petit, S., 2016b. Crop type, crop management and grass 565
margins affect the abundance and the nutritional state of seed-eating carabid species in 566
arable landscapes. Agric. Ecosyst. Environ. 231, 183–192.
567
Laliberté, E., Legendre, P., Shipley, B., 2014. Measuring functional diversity (FD) from 568
multiple traits, and other tools for functional ecology. R Foundation for Statistical 569
Computing, Vienna.
570
Larochelle, A., 1990. The Food of Carabid Beetles:(coleoptera: Carabidae, Including 571
Cicindelinae). Association des entomologistes amateurs du Québec, Fabreries 572
Supplement 5, 1-132.
573
Lavorel, S., Grigulis, K., McIntyre, S., Williams, N.S.G., Garden, D., Dorrough, J., Berman, S., 574
Quétier, F., Thébault, A., Bonis, A., 2008. Assessing functional diversity in the field – 575
methodology matters! Funct. Ecol. 22, 134–147.
576
Leps, J., De Bello, F., Lavorel, S., Berman, S., 2006. Quantifying and interpreting functional 577
diversity of natural communities: practical considerations matter. Preslia, 78, 481–501.
578
Lövei, G.L., Sunderland, K.D., 1996. Ecology and Behavior of Ground Beetles (Coleoptera:
579
Carabidae). Annu. Rev. Entomol. 41, 231–256.
580 581
Mader, V., Diehl, E., Fiedler, D., Thorn, S., Wolters, V., Birkhofer, K., 2017. Trade-offs in 582
arthropod conservation between productive and non-productive agri-environmental 583
schemes along a landscape complexity gradient. Insect Conserv. Divers. 10, 236–247.
584
Mansion‐Vaquié, A., Ferrante, M., Cook, S.M., Pell, J.K., Lövei, G.L., 2017. Manipulating 585
field margins to increase predation intensity in fields of winter wheat (Triticum 586
aestivum). J. Appl. Entomol. 141, 600–611. https://doi.org/10.1111/jen.12385 587
Ministerium für Ländlichen Raum und Verbraucherschutz (MLR), 2016. Verwaltungsvorschrift 588
des Ministeriums für Ländlichen Raum und Verbraucherschutz zum Förderprogramm 589
25
für Agrarumwelt, Klimaschutz und Tierwohl. Verwaltungsvorschrift vom 27.01.2016 590
(Az.: 25-8872.53).
591
Molina, G.A.R., Poggio, S.L., Ghersa, C.M., 2014. Epigeal arthropod communities in 592
intensively farmed landscapes: Effects of land use mosaics, neighbourhood 593
heterogeneity, and field position. Agric. Ecosyst. Environ. 192, 135–143.
594
Oksanen, J., Blanchet, F.G., Kindt, R., Legendre, P., Minchin, P.R., O’Hara, R.B., Simpson, 595
G.L., Solymos, P., Stevens, M.H.H., Wagner, H., 2015. Vegan: Community ecology 596
package, version 2.3-0. URL: https://cran.r-project.org/web/packages/vegan.
597
Pla, L., Casanoves, F., Di-Rienzo, J., 2012. Quantifying functional biodiversity. Series:
598
Springer Briefs in Environmental Science. Springer Editorial, Berlin.
599
https://doi.org/10.1007/978-94-007-2648-2.
600 601
Purtauf, T., Dauber, J., Wolters, V., 2005b. The response of carabids to landscape 602
simplification differs between trophic groups. Oecologia 142, 458–464.
603
Purtauf, T., Roschewitz, I., Dauber, J., Thies, C., Tscharntke, T., Wolters, V., 2005a.
604
Landscape context of organic and conventional farms: influences on carabid beetle 605
diversity. Agric. Ecosyst. Environ. 108, 165–174.
606
R Development Core Team, 2017. R: a language and environment for statistical computing. R 607
Version 3.4.2. R Foundation for Statistical Computing, Vienna.
608
Ribera, I., Dolédec, S., Downie, I.S., Foster, G.N., 2001. Effect of land disturbance and stress 609
on species traits of ground beetle assemblages. Ecology 82, 1112–1129.
610
Ricotta, C., Moretti, M., 2011. CWM and Rao’s quadratic diversity: a unified framework for 611
functional ecology. Oecologia 167, 181–188.
612
Rouabah, A., Villerd, J., Amiaud, B., Plantureux, S., Lasserre-Joulin, F., 2015. Response of 613
carabid beetles diversity and size distribution to the vegetation structure within 614
differently managed field margins. Agric. Ecosyst. Environ. 200, 21–32.
615
26
Rusch, A., Bommarco, R., Chiverton, P., Öberg, S., Wallin, H., Wiktelius, S., Ekbom, B., 2013.
616
Response of ground beetle (Coleoptera, Carabidae) communities to changes in 617
agricultural policies in Sweden over two decades. Agric. Ecosyst. Environ. 176, 63–69.
618
Schirmel, J., Thiele, J., Entling, M.H., Buchholz, S., 2016. Trait composition and functional 619
diversity of spiders and carabids in linear landscape elements. Agric. Ecosyst. Environ.
620
235, 318–328.
621
Schlager, P., Krismann, A., Wiedmann, K., Hiltscher, H., Hochschild, V., Schmieder, K., 2013.
622
Multisensoral, object- and GIS-based classification of grassland habitats in the Bio 623
sphere Reserve Schwäbische Alb. Photogrammetrie - Fernerkundung - Geoinformation 624
2013 (3), 163–172.
625
The Council of the European Union, 2005. Council Regulation (EC) No 1698/2005 of 20 626
September 2005 on Support for Rural Development by the European Agricultural Fund 627
for Rural Development (EAFRD).
628
Tuck, S.L., Winqvist, C., Mota, F., Ahnström, J., Turnbull, L.A., Bengtsson, J., 2014. Land-use 629
intensity and the effects of organic farming on biodiversity: a hierarchical meta- 630
analysis. J. Appl. Ecol. 51, 746–755.
631
Wang L., Gruber S., Claupein W., 2012. Optimizing lentil-based mixed cropping with different 632
companion crops and plant densities in terms of crop yield and weed control. Org. Agri., 633
2, 79-87.
634
Westerink, J., Jongeneel, R., Polman, N., Prager, K., Franks, J., Dupraz, P., Mettepenningen, 635
E., 2017. Collaborative governance arrangements to deliver spatially coordinated agri- 636
environmental management. Land Use Policy 69, 176–192.
637
Woodcock, B.A., Harrower, C., Redhead, J., Edwards, M., Vanbergen, A.J., Heard, M.S., Roy, 638
D.B., Pywell, R.F., 2014. National patterns of functional diversity and redundancy in 639
predatory ground beetles and bees associated with key UK arable crops. J. Appl. Ecol.
640
51, 142–151.
641
27
Woodcock, B.A., Potts, S.G., Tscheulin, T., Pilgrim, E., Ramsey, A.J., Harrison‐Cripps, J., 642
Brown, V.K., Tallowin, J.R., 2009. Responses of invertebrate trophic level, feeding 643
guild and body size to the management of improved grassland field margins. J. Appl.
644
Ecol. 46, 920–929.
645
Woodcock, B.A., Redhead, J., Vanbergen, A.J., Hulmes, L., Hulmes, S., Peyton, J., 646
Nowakowski, M., Pywell, R.F., Heard, M.S., 2010. Impact of habitat type and 647
landscape structure on biomass, species richness and functional diversity of ground 648
beetles. Agric. Ecosyst. Environ. 139, 181–186.
649 650
28 Figure captions
651 652
Fig. 1. Location of study fields (center transect) according to crop-use type and study year 653
(unfilled symbols: 2016, symbols with black dot: 2017) in southwest Germany. All fields were 654
located near the city of Münsingen in the administrative districts (solid lines) Alb-Donau-Kreis, 655
Esslingen or Reutlingen within the Biosphere Reserve Swabian Alb (grey area).
656 657
Fig. 2. Effect of crop-use type (winter wheat (WW), flowering field (FF), winter spelt (WD), 658
lentil-mixed-crop (LMC)) and transect position (edge, center) on community weighted mean 659
(CWM) of feeding type (a), body size (b) and flight ability (c). Bars are means ± SE.
660 661
29
Table 1. Farming practice characteristics, achieved yield and subsidy amount of studied crop-use types sampled in 2016 and 2017 (mean ± SE;
662
n=48). Results (F-value of ANOVA table) of linear mixed-effects models are given to test for significant differences between crop-use types. Bold 663
values indicate significant effect at P = 0.05.
664
Sowing date
(calendar week)
Crops in rotation (number)
Fertilizer (kg N ha-1)
Pesticide application (number)
Mechanical weeding b (number)
Yield (dt ha-1)
Subsidy by AES c (€ ha-1) Conventional Winter Wheat (n=12) 40.2 ± 0.4
(early October) 3.9 ± 0.2 184.6 ± 11.5 2.3 ± 0.4 0.1 ± 0.1 68.8 ± 3.6 none
Flowering Field (n=12) 18.2 ± 0.3
(early May) 3.9 ± 0.2 1.9 ± 1.9 none none none 710
Organic Winter Spelt (n=12) 40.7 ± 0.3
(early October) 5.8 ± 0.2 71.2 ± 21.4 none 1.7 ± 0.3 29.9 ± 1.7 230
Lentil-mixed-crop (n=12) 14.7 ± 0.5
(mid of April) 5.9 ± 0.2 4.9 ± 3.4 none none 9.8 ± 2.2 230
Model a F - value Year 0.8 23.8 0.1 0 0.1 0.2
Crop 1403.9 12.6 47.6 38 15.3 201.8
a All models were fitted with normal distribution.
b Only weeding between sowing and harvest counted.
c Fixed amount according to the agri-environmental scheme (AES) of the federal state Baden-Württemberg named FAKT (MLR, 2016).
665
30
Table 2. Effects of landscape (% of arable cover), crop-use type (winter wheat (WW) vs.
666
flowering field (FF) vs. winter spelt (WS) vs. lentil-mixed-crop (LMC)) and transect position 667
(edge (E) vs. center (C)) on community weighted mean (CWM) and functional divergence 668
(FDvar) of carabid traits (body size, food-type, flight ability). Results were calculated by multi- 669
model averaging of linear mixed-effects models. Importance of predictor variables, parameter 670
estimates with standard error (SE) and t/z-values. Only models with < 2 Δ AICc of the best 671
model are shown. Bold values indicate significant effect at P = 0.05.
672
Response a Explanatory Relative
importance[%]
Multi-model
estimate b ± SE t/z- value
CWM size (0.19/0.82;1) Transect (E/C) 99 -0.033 0.007 -4.91
CWM feeding type (0.29/0.76; 2) Crop-use type (FF/WW) 100 -0.187 0.031 6.022
Crop-use type (WS/WW) 100 -0.120 0.031 3.823
Crop-use type (LMC/WW)
100 -0.070 0.035 1.946
Crop-use type (WS/FF) 100 0.068 0.035 1.881
Crop-use type (LMC/FF) 100 0.117 0.031 3.750
Crop-use type (WS/LMC)
100 -0.050 0.031 1.603
Transect (E/C) 29 -0.047 0.017 2.696
CWM flight ability (0.18/0.77; 1) Transect (E/C) 100 0.716 0.014 5.073
FDvar size (0.29/0.59; 1) Transect (E/C) 3 0.010 0.005 2.164
FDvar feeding type (0.18/0.77; 1) Transect (E/C) 27 0.030 0.010 2.819
FDvar flight ability (0.04/0.55; 1) Landscape 3 0.019 0.035 0.595
a Allmodels were fitted with normal distribution (marginal/conditionalR² value of full model; number of candidate models, Δ AIC < 2).
b Negative estimates indicate lower number e.g. lower CWM size in edge vs. center.
673 674
31 Fig. 1.
675
676 677
32 Fig. 2
678
679