1
NO Releasing and Anticancer Properties of Octahedral Ruthenium- Nitrosyl Complexes with Equatorial 1H-indazole Ligands
Evelina Orlowska,† Maria V. Babak,‡ Orsolya Dömötör, Eva A. Enyedy, Peter Rapta,‖ Michal Zalibera,‖ Lukáš Bučinský,‖ Michal Malček,‖,○ Chinju Govind,≠ Venugopal Karunakaran,≠ Yusuf Chouthury Shaik Farid,⌂ Tara McDonnell,□ Dominique Luneau,◊ Dominik Schaniel, Wee Han Ang, ‡ Vladimir B. Arion†,*
†Institute of Inorganic Chemistry, Faculty of Chemistry, University of Vienna, Währinger Strasse 42, A-1090 Vienna, Austria
‡Department of Chemistry, National University of Singapore, 3 Science Drive 2, 117543 Singapore
Department of Inorganic and Analytical Chemistry, University of Szeged, Dom ter 7, H- 6720 Szeged, Hungary
‖Slovak University of Technology, Institute of Physical Chemistry and Chemical Physics, Radlinského 9, SK-81237 Bratislava, Slovakia
○LAQV@REQUIMTE, Department of Chemistry and Biochemistry, Faculty of Sciences, University of Porto, Rua do Campo Alegre s/n, 4169-007 Porto, Portugal
≠Photosciences and Photonics section, Chemical Sciences and Technology Division, CSIR- National Institute for Interdisciplinary Science and Technology, Thiruvananthapuram 695019 Kerala, India
⌂School of Chemistry and Life Sciences, Nanyang Polytechnic, 180 Ang Moh Kio Ave 8, 569830, Singapore
□School of Biotechnology and Biomolecular Sciences, the University of New South Wales, Kensington, Sydney, NSW 2052, Australia
◊Laboratoire des Multimatériaux et Interfaces (UMR5615), Université Claude Bernard Lyon 1, Campus de la Doua, 69622 Villeurbanne, Cedex, France
Université de Lorraine, CNRS, CRM2, 54506 Nancy, France
*Corresponding author: E-mail: vladimir.arion@univie.ac.at
2 Abstract. With the aim of enhancing the biological activity of ruthenium-nitrosyl complexes, new complexes with four equatorially bound indazole ligands, namely trans- [RuCl(Hind)4(NO)]Cl2·H2O ([3]Cl2·H2O) and trans-[RuOH(Hind)4(NO)]Cl2·H2O ([4]Cl2·H2O) have been prepared from trans-[Ru(NO2)2(Hind)4] ([2]). When the pH- dependent solution behavior of [3]Cl2·H2O and [4]Cl2·H2O was studied, two new complexes with deprotonated indazole ligands were isolated, namely [RuCl(ind)2(Hind)2(NO)] ([5]) and [RuOH(ind)2(Hind)2(NO)] ([6]). All prepared compounds were comprehensively characterized by spectroscopic (IR, UV‒vis, 1H NMR) techniques. Compound [2], as well as [3]Cl2·2(CH3)2CO, [4]Cl2·2(CH3)2CO and [5]·0.8CH2Cl2, the latter three obtained by re- crystallization of the first isolated compounds (hydrates or anhydrous species) from acetone and dichlorometane, respectively, were studied by X-ray diffraction methods. The release of NO in complexes [3]Cl2 and [4]Cl2 triggered by one-electron reduction was investigated by cyclic voltammetry and resulting paramagnetic NO species were detected by EPR spectroscopy. The release of NO upon irradiation with blue light was investigated by IR, UV- vis and EPR spectroscopy and kinetics of NO release was discussed. The quantum yields of NO release were calculated and found to be low (3-6%), which could be explained by NO dissociation and recombination dynamics, assessed by femtosecond pump-probe spectroscopy. The geometry and electronic parameters of Ru species formed upon NO release were identified by DFT calculations. The complexes [3]Cl2 and [4]Cl2 showed considerable antiproliferative activity in human cancer cell lines with IC50 values in low micromolar or submicromolar concentration range are suitable for further development as potential anticancer drugs. p53-dependence of Ru-NO complexes [3]Cl2 and [4]Cl2 was studied and p53-independent mode of action has been confirmed. The effects of NO release on the cytotoxicity of the complexes with or without light irradiation were investigated using NO scavenger carboxy-PTIO.
3 Introduction
Nitric oxide (NO) is known both as an air pollutant1 as well as a physiological regulator2 essential for neurotransmission, blood pressure control, antioxidant action and immunological responses.3 In cells NO is mainly produced by conversion of L-arginine to L- citrulline in the presence of nitric oxide synthase (NOS). The down-regulation of NO synthesis in a variety of normal cells and in tumor cells is mediated by intracellular transforming growth factor-1 (TGF-1).4 The control of cellular NO concentration, either by inhibitingits production or by targeted delivery can be achieved by using suitable metal complexes, and consequently, NO-scavenging and NO-releasing metal complexes are of great therapeutic interest.5 NO as a ligand readily binds to transition metals, such as iron or ruthenium, forming stable M-NO adducts. Recently, it was reported that the anticancer effects of Ru(III)-based clinical lead candidates, KP1019/NKP1339 and NAMI-A, were at least in part due to their NO-scavenging properties, stemming from high affinity of ruthenium(III) to NO.6,7 Scavenging of endogenous NO produced from NOS depletes its local concentration, thereby diminishing subsequent interactions with cellular targets.
Since the role of NO in tumor development can also be inhibitory, NO-donating compounds which release free NO hold great promises as anticancer agents. For example, high NO levels (>500 nM) induce apoptosis as a result of p53 activation and therefore, the exogenous delivery of cytotoxic levels of NO by NO-releasing drugs might be beneficial for the induction of apoptosis via p53 pathway.8 Some NO-releasing compounds display spontaneous release of NO, while other compounds require external stimuli, such as enzymatic, photo-, thermal activation or redox events.9 Ruthenium-nitrosyl complexes are excellent candidates for the delivery of exogenous NO, since the efficacy of NO release can be fine-tuned by modifying the structure of Ru complexes. Ruthenium exists in several oxidation states, whereas NO acts as a non-innocent ligand either as NO+, NO or NO‒, availing a series of alternative oxidation state combinations.10 Furthemore, NO-release in ruthenium-nitrosyl complexes is dependent on the redox potential of the complex and trans- effect of the ligand in trans- position to NO,11 and NO release can be triggered by one- electron reduction12 or by photolysis.13
Previously, we have already reported the preparation and biological properties of Ru- NO complexes with various aminoacids coordinated in bidentate fashion.14 All compounds demonstrated only moderate cytotoxicity in a micromolar concentration range against human ovarian carcinoma cells (CH1), which was presumably related to their low lipophilicity and
4 insufficient intracellular accumulation. In a different series, aminoacids were replaced by more lipophilic azole ligands in trans- and cis-positions to NO ligand, yielding compounds with the general formula (cation)[cis-RuCl4(Hazole)(NO)] and (cation)[trans- RuCl4(Hazole)(NO)].15 The cytotoxicity of the complexes against CH1 cells varied greatly from submicromolar to high micromolar range. The differences in the cytotoxicity were defined by the azole heterocycle and the most active Ru-NO compounds contained indazole ligands. The contribution of NO in the antiproliferative activity of mono-indazole Ru-NO complexes was not confirmed. However, no external stimuli was applied; therefore, the release of NO in the studied conditions was unlikely.
Inspired by the elevated cytotoxicity of Ru-NO complexes upon the inclusion of indazole ligands into the structure of the complexes, we hypothesized that incorporation of several indazole ligands would result in the augmented intracellular accumulation of Ru-NO complexes and further increase of antiproliferative activity. Since correlation between the number of indazole ligands and the cytotoxicity of the complexes with the general formula [RuIIICl(6-n)(indazole)n](3-n)- was noticed,16 higher azole-to-chloride ratio could lead to stabilization of lower ruthenium oxidation states, improved cellular uptake and enhancement of antiproliferative activity.
Herein we report on the synthesis of compounds trans-[RuII(NO2)2(Hind)4] ([2]), trans-[RuCl(Hind)4(NO)]Cl2 ([3]Cl2), trans-[RuOH(Hind)4(NO)]Cl2 ([4]Cl2), (Scheme 1), their characterization by spectroscopic methods and single crystal X-ray diffraction. Upon characterization of aqueous solution behavior of these complexes, new inner-sphere Ru-NO complexes [RuCl(ind)2(Hind)2(NO)] (5) and [RuOH(ind)2(Hind)2(NO)] (6) were isolated and characterized. The redox properties were investigated as well and supporting DFT calculations were performed to assess the IR, UV‒vis and EPR behavior of [3]Cl2. The ability of the target complexes [3]Cl2 and [4]Cl2 to release NO upon one-electron reduction or blue light irradiation has been studied by various methods. The contribution of NO to the anticancer properties and p53 induction of novel Ru-NO complexes with or without irradiation has been evaluated.
5 L
Ru L
L NO HO
L
[4]2+
L Ru
L L Cl Cl
L
L Ru
L L NO2 O2N
L
L Ru
L L´
NO Cl
L´
L Ru
L L´
NO HO
L´
N N- L
Ru L
L NO Cl
L
N
(i) NH
[1] [2] [3]2+
(iv) (ii)
(iii)
[5]
L =
L´ =
[6]
(vi)
(v)
Scheme 1. Synthesis of complexes. Reagents and conditions: (i) NaNO2, acetone/DCM/H2O reflux, 12 h; (ii) 12M HCl, MeOH; (iii) 3M HCl, MeOH; (iv) 12M HCl, MeOH; (v) and (vi) pH 6‒9 in 50%
ethanol/water.
Experimental
Chemicals and Materials. Solvents and reagents were obtained from commercial sources and used as received. [RuIICl2(Hind)4] ([1]) was prepared as reported previously.16 Ultrapure water was obtained by using a Milli-Q UV purification system (Sartorius Stedim Biotech SA).
Gibco Trypsin/EDTA solution and 10% sodium dodecyl sulfate (SDS) solution was purchased from Life Technologies. Glycine, HyCloneTM Trypsin Protease 2.5% (10X) solution, RPMI 1640, DMEM medium, Fetal bovine serum (FBS), PierceTM Protease, Phosphatase Inhibitor Mini Tablets and carboxy-PTIO were purchased from Thermo Fisher Scientific. HyCloneTM Dulbecco's Phosphate-Buffered Saline (10 times diluted) was purchased from Ge Healthcare Life Sciences. Biorad Protein Assay Dye Reagent Concentrate, 40% Acrylamide/Bis solution, 10X Tris/glycine buffer, TEMED, Nitrocellulose Membrane 0.2 and 0.45 μm were purchased from Biorad Laboratories. LuminataTM Classico, Crescendo and Forte Western HRP Substrate were purchased from Merck Millipore Corporation.
Oxaliplatin was purchased from Merlin Chemicals Ltd (Liphook, UK). Clinical-grade cisplatin (1 mg/ml) was purchased from Hospira Pty Ltd (Melbourne, Australia). All solvents for solution equilibrium studies were of analytical grade and used without further purification.
KCl, HCl, HNO3, KOH, dimethylsulfoxide (DMSO) and other chemicals used were purchased from Sigma-Aldrich in puriss quality.
6 Synthesis of complexes
trans-[Ru(NO2)2(Hind)4]] ([2]). A solution of NaNO2 (0.2 g, 2.6 mmol) in H2O (8 mL) was added to the mixture of [RuCl2(Hind)4] (0.6 g, 0.93 mmol) in acetone/dichloromethane (DCM) 1:1 (100 mL). The solution was refluxed under stirring for 12 h, and cooled to room temperature. The organic phase was separated in a separatory funnel and washed with water (3 30 mL). The volume of the separated organic phase was reduced to ca. 20 ml. After 2 h the precipitated yellow crystals were filtered off, washed with acetone (5 mL) and dried in air.
Yield: 0.28 g, 46.0%. X-ray diffraction quality single crystals were grown in DCM/hexane (solvent/vapor diffusion). 1H NMR in DMSO-d6: 13.32 (s, 4NH), 8.09 (s, 4H), 7.73 (d, 4H, J
= 8.5 Hz), 7.61 (d, 4H, J = 8.5 Hz), 7.34 (t, 4H, J = 7.5 Hz), 7.13 (t, 4H , J = 7.5 Hz). Elem.
Anal. Calcd for C28H24N10O4Ru (Mr = 665.62), %: C, 50.52; H, 3.63; N, 21.04; O, 9.61.
Found, %: C, 50.61; H, 3.39; N, 21.12; O, 9.52. ESI-MS in MeOH (negative): m/z 665 [Ru(NO2)2(Hind)4]‒, 647, 556 541. IR, ν̃, cm−1: 3303, 3117, 1517, 1469, 1403, 1349, 1257, 1122, 1046, 1026, 755, 602. UV−vis (DCM), λmax, nm (ε, M−1 cm−1): 231 (18108), 293 (17513), 325 (21281), 382 (1108).
trans-[RuCl(Hind)4NO]Cl2∙H2O ([3]Cl2·H2O). To a suspension of [2] (0.17 g, 0.25 mmol) in MeOH (20 mL) a 12M HCl (2.5 mL) was added. The mixture was refluxed under argon for 1 h, and cooled to room temperature. Then the dark-orange solution was filtered and the volume was reduced to ca. 3‒5 mL. A small amount of precipitate was removed by filtration and washed with about 10 mL of water. The mother liquor was allowed to crystallize in air at room temperature. Next day the dark-red crystals were filtered off, washed with diethyl ether (10 mL) and dried in vacuo at room temperature (r.t.). Yield: 0.097 g, 52%. Elem. Anal.
Calcd for C28H24Cl3N9ORu∙4H2O (Mr = 782.04), %: C, 43.00; H, 4.12; N, 16.12. Found, %:
C, 43.08; H, 3.93; N, 15.91. ESI-MS in MeOH (positive): m/z 638 [RuCl(Hind)4(NO)]+. 1H NMR in DMSO-d6: 14.47 (s), 8,48 (s), 7,92 (d), 7,67 (dd); 7,61 (m), 7,34 (t). IR, ν̃, cm−1: 2658, 1925 (NO), 1629, 1515, 1476, 1439, 1359, 1288, 1239, 1146, 1088, 999, 966, 902, 840, 783, 737, 614. UV−vis (H2O), λmax, nm (ε, M−1 cm−1): 257 (99175), 365 (53287), 482 (22994). X-ray diffraction quality single crystals were grown in acetone. The monohydrate was obtained by drying the compound in vacuo at room temperature for 8 h.
trans-[Ru(OH)(Hind)4(NO)]Cl2·H2O ([4]Cl2·H2O). To a suspension of [2] (0.17 g, 0.25 mmol) in MeOH (20 mL) a 3M HCl (2.5 mL) was added. The mixture was refluxed under argon for 40 min, and cooled to room temperature. Then the dark-orange solution was filtered and the filtrate concentrated under the reduced pressure to ca. 3 mL. The precipitate was
7 filtered off and washed with water (10 mL). The product was recrystallized from acetone (40 mL), washed with diethyl ether (10 mL) and dried in vacuo at r.t. Yield: 0.11 g, 62%. Elem.
Anal. Calcd for C28H25Cl2N9O2Ru·H2O (Mr = 704.53), %: C, 47.40; H, 3.83; N, 17.77; O, 6.76; Found, %: C, 47.07; H, 3.62; N, 17.57; O, 6.25. ESI-MS in MeOH (positive): m/z 620 [Ru(NO)(OH)(Hind)4]+, 484 [Ru(Hind)3]+, 310 [Ru(NO)(OH)(Hind)4]2+. 1H NMR in DMSO- d6: 14.27 (br.s, 4NH), 8.56 (s, 4H), 7.89 (d, 4H, J = 8.5 Hz), 7.66 (d, 4H, J = 8.5 Hz), 7.56 (t, 4H, J = 7.5 Hz), 7.29 (t, 4H, J = 7.5 Hz). IR, ν̃, cm−1: 3354, 1879 (NO), 1657, 1585, 1512, 1474, 1441, 1378, 1358, 1334, 1272, 1242, 1151, 1126, 1081, 1003, 964, 830, 784, 746, 656, 619. UV−vis (H2O), λmax, nm (ε, M−1 cm−1): 257 (99175), 365 (53287), 482 (22994). X-ray diffraction quality single crystals were grown in acetone.
trans,cis,cis-[RuCl(ind)2(Hind)2(NO)] [5] and [RuOH(ind)2(Hind)2(NO)] [6]. To a solution of 20 mg of [3]Cl2∙4H2O or [4]Cl2·H2O in 8 mL 50% (v/v) ethanol/water 0.1 M KOH solution was added until the measured pH was between 6 and 9. The formed fine-grained precipitate was centrifuged and washed with 50% (v/v) ethanol/water (4 4 mL). The product was dried in air. Yield: 50 and 52%, respectively. X-ray diffraction quality single crystals of [5]·0.8CH2Cl2 were grown in DCM. 1H NMR in CDCl3: [RuCl(ind)2(Hind)2(NO)] [5]:
8.04(s), 7,84 (d), 7,69 (d); 7,43 (dd), 7,14 (dd). [Ru(OH)(ind)2(Hind)2(NO)] [6]: 7.86(s), 7,78 (d), 7,64 (d); 7,39 (dd), 7,11 (dd); ESI-MS in MeOH (positive): [RuCl(ind)2(Hind)2(NO)]
([5]): m/z 638 [M+H]+; [RuOH(ind)2(Hind)2(NO)] ([6]): m/z 620 [M+H]+. IR, ν̃, cm−1 [5]:
1871, 1722, 1624, 1509, 1448, 1365, 1095, 733; [6]: 1850, 1624, 1583, 1358, 1313, 1075, 783, 747.
Physical Measurements. Elemental analyses were performed by the Microanalytical Service of the Faculty of Chemistry of the University of Vienna with a PerkinElmer 2400 CHN Elemental Analyzer. 1H NMR (500.10 MHz) spectra were measured on a Bruker Avance III instrument at 25 °C. Chemical shifts for 1H were referenced to residual protons present in DMSO-d6. IR spectra were obtained by using an ATR unit with a Perkin-Elmer 370 FTIR 2000 instrument (4000‒400 cm‒1). Electrospray ionization mass spectrometry was carried out with a Bruker Esquire3000 instrument (Bruker Daltonics, Bremen, Germany) by using methanol as solvent. Infrared spectroscopy measurements with irradiation were performed using a Nicolet 5700 FT-IR spectrometer with a resolution of 2 cm‒1 in the range 350‒4000 cm‒1. The sample was grinded, mixed with KBr, and pressed into pellets. KBr pellets were bonded by silver paste on the cold finger of a closed cycle cryostat (Oxford Optistat V01), and
8 irradiated through KBr windows with light of different wavelengths in the range 365‒660 nm.
The cryostat allows controlling the temperature in the range of 9‒320 K.
X-ray crystallography. X-ray diffraction measurements were performed on a Bruker X8 APEXII CCD and Bruker D8 Venture diffractometers. Single crystals were positioned at 35, 40 35 and 28 mm from the detector, and 767, 1872, 1904 and 2500 frames were measured, each for 30, 2, 7.2 and 48 s over 1, 0.25, 0.4 and 0.5° scan width for [2], [3]Cl2·2(CH3)2CO, [4]Cl2·2(CH3)2CO and [5]∙0.8CH2Cl2, respectively. The data were processed using SAINT software.47 Crystal data, data collection parameters, and structure refinement details are given in Table S1. The structure was solved by direct methods and refined by full-matrix least- squares techniques. Non-hydrogen atoms were refined with anisotropic displacement parameters. Hydrogen atoms were inserted in calculated positions and refined with a riding model. The following computer programs and hardware were used: structure solution, SHELXS-97 and refinement, SHELXL-97;48 molecular diagrams, ORTEP;49 computer, Intel CoreDuo. Disorder observed for the nitro group in [2] and two indazole, NO and OH ligands in [3]2+ was resolved by using SADI and EADP restraints and DFIX constraints implemented in SHELXL. Crystallographic data for these complexes have been deposited with the Cambridge Crystallographic Data Center as supplementary publications no. CCDC-1835290 ([2]), -1835292 ([3]Cl2∙2(CH3)2CO), -1835291 ([4]Cl2∙2(CH3)2CO), and -1835289 ([5]∙0.8CH2Cl2). Copy of the data can be obtained free of charge on application to The Director, CCDC, 12 Union Road, Cambridge CB2 1EZ, UK (email:
deposit@ccdc.cam.ac.uk).
Solution equilibrium studies. Aqueous stability and proton dissociation processes of complexes [3]Cl2 and [4]Cl2 were investigated in detail. Due to the photosensibility of the complexes their solutions were kept in dark. A Hewlett Packard 8452A diode array spectrophotometer was used to record the UV‒vis spectra in the interval 200–800 nm. The path length was 0.2, 0.5, 1 or 4 cm. Spectrophotometric measurements were performed in water, 50% (v/v) ethanol/water or 30% (v/v) DMSO/water solvent mixtures at 25.0±0.1 °C and the concentration of the complexes was 4‒5 or 100 M. The ionic strength was 0.1 M (KCl). Measurements in chloride ion free media were carried out as well in the presence of HNO3 (pH ~ 3) without additional background electrolyte. pH dependent titrations were performed between pH 2.0 and 11.5 and an Orion710A pH-meter equipped with a Metrohm combined electrode (type 6.0234.100) was used for the titrations. The electrode system was calibrated in aqueous solution to the pH = –log[H+] scale according to the method suggested
9 by Irving et al.17 1H NMR studies were carried out on a Bruker Ultrashield 500 Plus instrument. 1H NMR spectra of samples containing water were recorded with the WATERGATE water suppression pulse scheme using 4,4-dimethyl-4-silapentane-1-sulfonic acid (DSS) internal standard. Complexes were dissolved in 50% (v/v) CD3OD/H2O mixture to yield a concentration of 0.5 mM and were titrated at 25 °C, in the absence of KCl in the pH range 2.0 to 11.1. 1H NMR spectra were recorded on samples containing [4]Cl2 (0.5 mM) and increasing amount of KCl (0.0, 0.44, 0.68 M) after 2 h of incubation. Fluorescence spectra were recorded on a Hitachi-F4500 fluorometer in 1 cm quartz cell at λEX = 290 nm, λEM = 300‒500 nm and at 25.0 ± 0.1 °C. Solutions were prepared in pure water at 5 M complex concentration. Ionic strength was 0.1 M (KCl), and samples were titrated between pH 2.0 and 11.5.
Electrochemistry and Spectroelectrochemistry. The cyclic voltammetric studies were performed using a platinum wire as working and auxiliary electrodes, and silver wire as pseudoreference electrode with a Heka PG310USB (Lambrecht, Germany) potentiostat.
Ferrocene served as the internal potential standard. In situ spectroelectrochemical measurements were performed on Avantes, Model AvaSpec-2048x14-USB2 spectrometer under an argon atmosphere with the Pt-microstructured honeycomb working electrode, purchased from Pine Research Instrumentation (spectroelectrochemical cell kit AKSTCKIT3).
IR spectroelectrochemistry was performed in the optically transparent thin layer electrochemical (OTTLE) cell (UF-SEC, LabOmak, Italy) with CaF2 windows and Pt mesh working electrode. Spectra were recorded at room temperature in the 400–4000 cm–1 with 4 cm–1 resolution using Nicolet NEXUS 470 FT-IR spectrometer. Further details are provided in the SI.
EPR spectroscopy. X-band (9.4 GHz) and Q-band (34 GHz) EPR spectra were recorded with the EMX line EPR spectrometers (Bruker, Germany) equipped with the ER 4102ST and ER 5106 QT resonators, respectively and with the ER 4141 VT variable temperature unit. The simulated spectra were calculated with EasySpin, the Matlab toolbox 18. Further details are provided in the SI.
Solution photochemistry in minutes time scale. NO scavenging EPR experiments were performed with 33 M solution of [3]Cl2 and an equimolar concentration of carboxy-2- phenyl-4,4,5,5-tetramethyl-imidazoline-1-oxyl-3-oxide (cPTIO) nitronyl nitroxide in Ar saturated MeCN. The solution was filled in an EPR flat cell and irradiated in situ in the resonator of the EPR spectrometer described above at room temperature with a vis light
10 source (lmax = 400 nm; Bluepoint LED, Hönle UV Technology). The photolysis of 30–35 M stirred complex solutions was additionally followed by UV–vis spectroscopy in situ in the LED photoreactor equipped with two lmax = 365 or 405 nm LED arrays (KEVA Brno, Czech Republic), in a perpendicular arrangement using 1 cm×1 cm quartz cuvette (1 cm optical irradiation path). The UV‒vis Avantes spectrometer described above was used to record the spectra. The light intensity provided by the LED arrays (irradiance value) was determined using ferrioxalate actinometry under identical conditions (yielding 7.81×10⁻⁴ einstein s–1 dm–3 and 1.18×10⁻⁴ einstein s–1 dm–3 at 365 nm and 405 nm, respectively).19 The spectra were corrected for the irradiation light artefacts, by subtracting a record obtained with the pure solvent. The molar absorption coefficient of the photo generated products and the photochemical quantum yields were determined by kinetic modeling. The Global Analysis of the spectral series recorded in the photolysis experiment was performed using the Ultrafast Spectroscopy Modelling Toolbox,20 by employing a first order kinetic model. The rate constants and concentration profiles obtained were then used to evaluate the quantum yield as described in the text.
Femtosecond Pump-Probe Spectroscopy. The experimental details for the femtosecond transient absorption measurements have already been described elsewhere.21 Briefly it is a Ti:Sapphire laser (Mai Tai HP, Spectra Physics, USA) centered at 800 nm having pulse width of < 110 fs with 80 MHz repetition rate. The amplified laser was split into two beams in the ratio of 75:25%. The high energy beam was used to convert to the required wavelength (470 nm) for exciting the sample by using TOPAZ (Prime, Light Conversion). The white light continuum (340‒1000 nm) was generated by focusing the part of amplified beam (200 mW) on a 1 mm thick CaF2 plate which split into two beams (sample and reference probe beams).
The sample cell (0.4 mm path length) was refreshed by rotating in a constant speed. Finally, the white light continuum was focused into a 100 μm optical fiber coupled to imaging spectrometer after passing through the sample cell. The pump probe spectrophotometer (ExciPro) setup was purchased from CDP Systems Corp, Russia. Normally transient absorption spectra were obtained by averaging about 2000 excitation pulses for each spectral delay. All the measurements were carried out at the magic angle (54.7°). The time resolution of the pump-probe spectrometer is found to be about 120 fs.
Computational details. Geometry optimizations of all studied species of [3]2+ (i.e [RuCl(Hind)4(NO)]2+, its reduced form ,2[RuCl(Hind)4]2+ form after NO release, etc.) have been performed at the B3LYP22,23,24,25
level of theory employing SVP and/or TZVP basis
11 sets26 with SDD pseudopotential for the Ru atom.27 The energy-based criterion of the SCF convergence was set to 10–8 Hartree in all systems. Vibrational analysis was employed to confirm that the optimal geometries correspond to energy minima (no imaginary frequencies).
Time-dependent density functional theory (TD DFT) has been utilized for calculations of electron excitation energies and oscillator strengths at the same levels of theory as mentioned above. Herein, the forty lowest electron excitations have been taken into account. All these calculations were carried out in Gaussian09 program package.28 The single point calculations of EPR parameters of the optimized structures were performed at the B3LYP22,23,24,25
/UDZ29 level of theory in ORCA 3.0.2 program package,30,31,32 where UDZ stands for uncontracted double zeta basis set. The EPR calculations employed a scalar quasirelativistic Douglas-Kroll- Hess Hamiltonian30,33,34,35,36
with the unrestricted Kohn-Sham formalism and using the point charge nucleus model. Picture change error37 correction of the g-tensor and hyperfine coupling constant of N3 atom was accounted for as implemented in the ORCA 3.0.2 program package. Visualization of the optimal structures and molecular orbitals as well as spin densities was performed in Molekel38 software suite.
Cell lines and culture conditions. Human colorectal carcinoma HCT116 and HCT116 p53-/- cell lines were gifts from Professor Shen Han-ming (NUS). Human ovarian carcinoma cells A2780 and human embryonic kidney cells HEK293 were obtained from ATCC. A2780 cells were cultured in RPMI 1640 medium containing 10% fetal bovine serum (FBS). HCT116 and HEK293 were cultured in DMEM medium containing 10% FBS. Adherent cells were grown in tissue culture 25 cm2 flasks (BD Biosciences, Singapore). All cell lines were grown at 37
°C in a humidified atmosphere of 95% air and 5% CO2. Experiments were performed on cells within 30 passages. All drug stock solutions were prepared in DMSO and the final concentration of DMSO in medium did not exceed 1% (v/v) at which cell viability was not inhibited. The amount of actual Ru concentration in the stock solutions was determined by ICP-OES.
Inhibition of cell viability assay. The cytotoxicity of the compounds was determined by colorimetric microculture assay (MTT assay). The cells were harvested from culture flasks by trypsinization and seeded into Cellstar 96-well microculture plates (Greiner Bio-One) at the seeding density of 6×10³ cells per well. After the cells were allowed to resume exponential growth for 24 h, they were exposed to drugs at different concentrations in media for 72 h. The drugs were diluted in complete medium at the desired concentration and 100 μL of the drug solution was added to each well and serially diluted to other wells. After exposure for 72 h,
12 drug solutions were replaced with 100 μL of MTT in media (5 mg mL−1) and incubated for additional 45 min. Subsequently, the medium was aspirated and the purple formazan crystals formed in viable cells were dissolved in 100 μL of DMSO per well. Optical densities were measured at 570 nm with a microplate reader. For cell viability assays involving inhibitors, the cells were pre-incubated with pifithrin-α (10 μM) or carboxy-PTIO (2.5 or 10 μM) for 30 min and then co-incubated with drugs for 72 h. Cell viability in the absence and presence of inhibitor was normalized against untreated control. For the irradiation experiments, drug stock solutions were prepared in MeCN and their concentrations were independently verified by ICP-OES. The concentration of MeCN in medium did not exceed 1% (v/v) at which cell viability was not inhibited. Drug stock solutions were irradiated by 18 W blue LED strips (maximum emission at around 470 nm) for 5 min and quickly diluted in complete medium at the desired concentration and MTT assay was carried out as described. The irradiation of drug solutions was characterized by the appearance of blue color. The quantity of viable cells was expressed in terms of treated/control (T/C) values by comparison to untreated control cells, and 50% inhibitory concentrations (IC50) were calculated from concentration-effect curves by interpolation. Evaluation was based on means from at least three independent experiments, each comprising six replicates per concentration level.
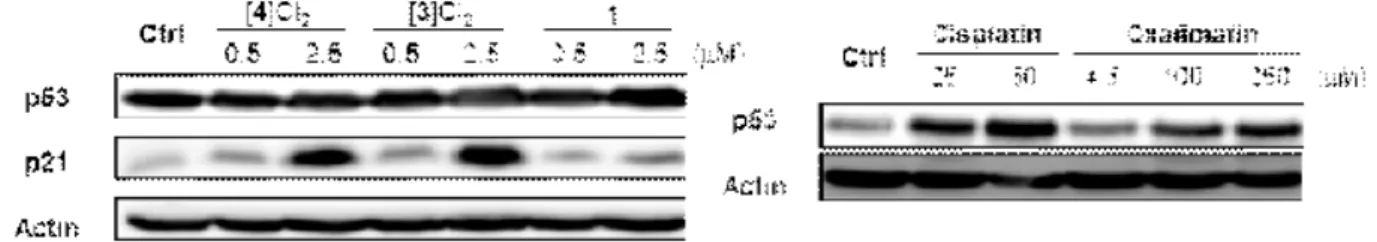
Western blot analysis. A2780 cells were seeded into Cellstar 6-well plates (Greiner Bio- One) at a density of 6×10⁵ cells per well. After the cells were allowed to resume exponential growth for 24 h, they were exposed to [1], [3]Cl2, [4]Cl2, cisplatin and oxaliplatin at different concentrations for 24 h. The cells were washed twice with 1 mL of PBS and lysed with lysis buffer [100 μL, 1% IGEPAL CA-630, 150 mM NaCl, 50 mM Tris-HCl (pH 8.0), protease inhibitor] for 5–10 min at 4 °C. The cell lysates were scraped from the wells and transferred to separate 1.5 mL microtubes. The supernatant was then collected after centrifugation (13000 rpm, 4 °C for 15 min) and total protein content of each sample was quantified via Bradford’s assay. Equal quantities of protein (50 μg) were reconstituted in loading buffer [5% DDT, 5×
Laemmli Buffer] and heated at 105 °C for 10 min. Subsequently, the protein mixtures were resolved on a 10% SDS-PAGE gel by electrophoresis (90 V for 30 min followed by 120 V for 60 min) and transferred onto a nitrocellulose membrane (200 mA for 2 h). The protein bands were visualized with Ponceau S stain solution and the nitrocellulose membranes were cut into strips based on the protein ladder. The membranes were washed with a wash buffer (0.1%
Tween-20 in 1× DPBS) three times for 5 min. Subsequently, they were blocked in 5% (w/v) non-fat milk in wash buffer (actin and p53 antibodies) or 5% BSA (w/v) in wash buffer (p21
13 antibody) for 1 h and subsequently incubated with the appropriate primary antibodies in 2%
(w/v) non-fat milk in wash buffer (actin and p53 antibodies) or 5% BSA (w/v) in wash buffer (p21 antibody) at 4 °C overnight. The membranes were washed with a wash buffer 3 times for 7 min. After incubation with horseradish peroxidase-conjugated secondary antibodies (r.t., 1.5 h), the membranes were washed with a wash buffer 4 times for 5 min. Immune complexes were detected with Luminata HRP substrates and analyzed using enhanced chemiluminescence imaging (PXi, Syngene). Actin was used as a loading control. The following antibodies were used: p53 (FL-393) (sc-6243) and p21 (F-5) (sc-6246) from Santa Cruz Biotechnologies, β-Actin (ab75186) from Abcam, ECL.
Results and Discussion
Synthesis of complexes. The complexes trans-[RuCl(Hind)4(NO)]Cl2·H2O ([3]Cl2·H2O), trans-[RuOH(Hind)4(NO)]Cl2·H2O ([4]Cl2·H2O), [RuCl(ind)2(Hind)2(NO)] ([5]) and [RuOH(ind)2(Hind)2(NO)] ([6]) were synthesized as shown in Scheme 1. Metathesis reaction of trans-[RuCl2(Hind)4] ([1]) with a 50% molar excess of NaNO2 afforded the complex trans- [Ru(NO2)2(Hind)4] ([2]) in 46% yield. Treatment of the latter with 12M and 3M HCl in methanol resulted in formation of [3]Cl2·H2O and [4]Cl2·H2O in 52 and 62%, respectively.
These two compounds were found to deprotonate at pH 6‒9 (vide infra) with formation of [5]
and [6], in ca 50% yield. By reacting [4]Cl2 with 12M HCl a conversion into [3]Cl2 was observed, even though it was not complete. The composition and structure proposed for all new compounds reported in this work have been proposed from elemental analyses, 1H NMR, IR and UV‒vis spectra, ESI mass spectrometry (see Experimental Section) and confirmed by single crystal X-ray diffraction measurements (vide infra). It should, however, be noted that the compounds used in all investigations described below are anhydrous or hydrated compounds (see Experimental section), while those characterized by single crystal X-ray diffraction are either anhydrous or contain co-crystallized solvent used for crystal growth.
X-ray Crystallography. The results of X-ray diffraction studies of complexes [2], [3]Cl2·2(CH3)2CO), [4]Cl2·2(CH3)2CO) and 5∙0.8CH2Cl2 are shown in Figure S1 and Figure 1, details of data collection and refinement are given in Table S1, while selected bond lengths (Å) and angles (deg) are quoted in the legends to Figures S1 and 1. Complex [2] crystallized in the tetragonal space group I41/a, while the other three compounds in monoclinic space group P21/n (or P21/c) (Table S1). All four complexes adopt a distorted octahedral coordination geometry with four indazole ligands coordinated to ruthenium in equatorial
14 plane and two nitrito groups ([2]), NO and chlorido ([3]Cl2) and [5] or NO and hydroxido ([4]Cl2) as axial ligands. Interestingly, in [5] two adjacent indazole ligands are deprotonated at N6 and N8 acting as proton acceptors in intramolecular hydrogen bonds N4‒H···N6 [N4···N6 2.800(2) Å, N4‒H···N6 170°] and N2‒H···N8 [N2···N8 2.800(2) Å, N2‒H···N8 170°] (Figure 1C).
Figure 1. A) ORTEP view of the cation [RuCl(NO)(Hind)4]2+ in the crystal structure of [3]Cl2·2(CH3)2CO) with atom labeling scheme and thermal ellipsoids at 50% probability level;
only the major components of the disordered over two positions Cl‒ and NO are shown.
Counterions and solvent molecules in the crystal structure are omitted for clarity. Selected bond distances (Å) and angles (deg): Ru‒N1 2.080(6), Ru‒N4 2.085(7), Ru‒Cl1i 2.214(7), Ru‒N3 1.806(19), N3‒O1 1.174(19), Ru‒N3‒O1 168.9(17), Cl1i‒Ru‒N3 174.5(6); B) ORTEP view of the cation [Ru(OH)(NO)(Hind)4]2+ in the crystal structure of [4]Cl2·2(CH3)2CO) with atom labeling scheme and thermal ellipsoids at 50% probability level;
only the major components of the disordered over two positions OH‒, NO and two indazole ligands are shown. Counterions and solvent molecules in the crystal structure are omitted for clarity. Selected bond distances (Å) and angles (deg): Ru‒N1 2.078(3), Ru‒N4 2.078(3), Ru‒O2i 1.996(9), Ru‒N3 1.702(11), Ru‒N3‒O1 171.0(9), N3‒Ru‒O2i 178.1(6); C) ORTEP view of the neutral complex [RuCl(ind)2(Hind)2(NO)] [5] with atom labeling scheme and thermal ellipsoids at 50% probability level. Co-crystallized solvent is omitted for clarity.
Selected bond distances (Å) and angles (deg): Ru‒N1 2.090(4), Ru‒N3 2.094(4), Ru‒N5 2.081(4), Ru‒N7 2.073(4), Ru‒Cl1 2.2959(13), Ru‒N9 1.774(5), N9‒O1 1.127(6), Ru‒N9‒O1 168.7(5), N9‒Ru‒Cl1 174.68(15).
Note that X-ray diffraction structures of complexes with deprotonated indazole are rare in the literature. Two examples can be mentioned, namely the platinum complex [PtCl(N- indazolato)(PPh3)2]39 and the osmium-arene complex [(6-p-cymene)Os(oxine)(ind)].40 The Ru‒NO moiety is almost linear with the corresponding angle varying from 168.7(5)° to 171.0(9)°. In addition to X-ray diffraction data the linear geometry of Ru‒NO unit in [3]Cl2,
15 [4]Cl2, [5] and [6] was also obvious from IR spectra, where strong absorption bands with NO at 1925, 1879, 1871 and 1850 cm‒1 were measured. Therefore, the photoreactivity of this moiety in the solid state was first investigated.
Solid state photochemistry. In metal nitrosyl complexes sometimes a competition between NO release and the generation of photoinduced NO linkage isomers (PLI) exists. These PLI were first discovered in Na2[Fe(CN)5(NO)],41,42 and termed long-lived metastable states (MS).
Since then a number of ruthenium complexes have been prepared with similar photophysical behavior.43,44,45,46,47
In order to evaluate the ability of the reported herein complexes to form PLI and/or release NO we performed a systematic analysis by infrared spectroscopy as a function of temperature, which are detailed in Supporting Information material (Figures S2‒S4). In summary, upon light irradiation solid [3]Cl2·H2O did not exhibit significant metastable isomer population, but considerable NO release at room temperature. In contrast, for [4]Cl2·H2O and [5] we observed both phenomena NO release at room temperature and linkage isomerism at low temperature, which in case of [5] is reversible.
Solution chemistry of complexes [3]Cl2 and [4]Cl2 in aqueous media. Structural and spectroscopic characterization of compounds is usually performed in the solid state or in organic solvents. However, for the drug development it is important to collect the information about the stability and reactivity of the drug candidates in aqueous media, especially at physiological pH. It is known that pH in solid tumors is usually lower than in normal tissues and acidosis in cancer cells is mediated by glycolysis, induced by limited oxygen supply.48 Typical extracellular pH ranges are 6.5‒6.9 in tumors and 7.0‒7.5 in normal tissues; however, in some tumors pH values of 6.0 or even lower were detected.49 Therefore, the behavior of drug candidates should also be assessed at acidic conditions. Complexes [3]Cl2 and [4]Cl2
may participate in several interactions in aqueous media. Besides the (partial) decomposition of the complexes (i.e. loss of NO or Hind ligands, Cl–/OH– exchange), protonation of the coordinated OH– in [4]Cl2 or stepwise deprotonation of Hind ligands in both complexes [3]Cl2 and [4]Cl2 may take place in aqueous solution by varying the pH as it is shown in Scheme 2 for [4]2+.
16
components (Ru2+, proligands) [Ru(OH)(Hind)4(NO)]2 +
[Ru(H2O)(Hind)4(NO)]3+
[Ru(OH)(ind)i(Hind)4‒i(NO)](2 ‒i)+
[RuCl(Hind)4(NO)]2+
interconversion
aquation
dissociation Ka(Hind)i Ka(H2O)
Scheme 2. Possible transformation processes of [Ru(OH)(Hind)4(NO)]2+ ([4]2+) including interconversion to [RuCl(Hind)4(NO)]2+ ([3]2+) and aquation of the latter as well. The same protonation and dissociation equilibria are valid for [3]2+.
Chlorido ligand often behaves as a leaving group, especially in the case of platinum-group metal complexes.50,51,52 Correct interpretation of the actual form of a compound at physiological conditions requires detailed investigations under variation of different parameters (pH, ionic strength etc.) in aqueous media.
The aqueous solubility of complexes [3]Cl2 and [4]Cl2 at pH 7.4 was extremely poor and precipitate formation was observed even at 5 µM complex concentration, thereby hindering their detailed investigation in neat water at this pH due to the concentration requirements of the chosen experimental methods. The aqueous solubility increased under acidic conditions (pH 2‒4) but was still limited (~100 µM). Due to the low solubility of [3]Cl2 and [4]Cl2 in water, their solution chemistry was investigated in 30% (v/v) DMSO/water or 50% (v/v) ethanol/water solvent mixtures. First, the interconversion between the two complexes was investigated. UV‒vis spectra recorded in 50% (v/v) ethanol/water or 30% (v/v) DMSO/water mixture showed different spectral shapes at pH 2.3 (Figure S5) and spectra remained unaltered over 1 h. 1H NMR spectra measured for [4]Cl2 at various KCl concentrations (0‒0.68 M) in 50% (v/v) CD3OD/water at pH = 4.9 provide further evidence that no Cl–/H2O or Cl–/OH– exchange occurred after incubation for 2 h (Figure S6). The same conclusion can be drawn from ESI-MS measurements: mass spectra of [3]Cl2 and [4]Cl2 showed the exclusive presence of the original complexes in the samples even after 8 days incubation in diluted nitric acid (pH ~ 3), accordingly no aquation of [3]Cl2, no interconversion and no decomposition of the complexes occur in aqueous media. Next, we studied the behavior of complexes [3]Cl2 and [4]Cl2 upon pH increase from 2 to 11 in 50%
ethanol/water by UV‒vis. As shown in Figure 2A considerable changes in charge transfer bands occur in UV‒vis spectra of [4]Cl2 at pH 2.2‒5.3, while practically no measurable changes were observed for the chlorido complex [3]Cl2 in this pH range (see Figure S7). This
17 may be explained by the protonation of OH‒ in [4]Cl2 at more acidic conditions resulting in the formation of the aqua complex [Ru(H2O)(Hind)4(NO)]3+.
0.0 0.3 0.6 0.9
300 400 500 600
Absorbance
l/ nm
(A)
2.27 6.51 5.34
Absorbance
l,nm
0.0 0.3 0.6 0.9
230 280 330 380
Absorbance
l/ nm 2.27 (B)
5.32
8.86 6.37
Absorbance
l,nm
Figure 2. Visible (A) and UV (B) spectra of [4]Cl2 recorded at various pH values in 50% (v/v) ethanol/water. Dashed spectra indicate precipitate formation, pH values are indicated in the figure. {ccomplex = 102 M (A), 5.1 M (B); l = 4 cm, I = 0.1 M KCl}
At pH above 5.3 intraligand bands of [4]Cl2 in Figure 2B show significant spectral changes indicating the involvement of Hind ligands into a pH dependent process. To assess if the incubation of complexes [3]Cl2 and [4]Cl2 at different pH was associated with the release of indazole ligands, 1H NMR spectra at different pH in 50% CD3OD/water were recorded. [4]Cl2 demonstrated high field shifts of proton signals at pH above 5 in Figure 3, but no free indazole could be detected at any pH ruling out the release of indazole from the complex.
7.1 7.5 7.9 8.3
2 4 6
d/ ppm
pH
10 12
8.4 8.1 7.8 7.5 7.2 d/ ppm
#
#
# pH 11.15 6.56 5.96 5.60 5.28 4.98 4.48 4.37 3.32 2.46 2.20
//
(A) (B)
▲ ▲
■ ♦
▲
▲
■
♦ ♥
▲ ▲
■ ♦
▲ ▲
■♦
pH
d,ppm
d,ppm
pH
18 Figure 3. 1H NMR spectra of [4]Cl2 recorded at various pH values (A) and chemical shift values (δ) of [3]Cl2 (empty symbols) and [4]Cl2 (full symbols) plotted against the pH. {ccomplex
= 0.5 mM; 50% (v/v) CD3OD/water} #: magnified spectral intensities.
This assumption was supported by spectrofluorimetric experiments, which indicated high stability of Ru-Hind bond (Figure S8). The proton shifts of coordinated indazole signals in 1H NMR upon pH changes were associated with indazole deprotonation. Increase of pH above 6.5 was accompanied by precipitation of both complexes with partial redissolution at pH 11.
Complexes [3]Cl2 and [4]Cl2 were found to deprotonate with the formation of [RuCl(ind)2(Hind)2(NO)] ([5]) and [RuOH(ind)2(Hind)2(NO)] ([6]), respectively. The solid- state structure of [5] was confirmed by X-ray diffraction analysis (Figure 1C, vide supra). To conclude, solution studies revealed the high aqueous stability (or kinetic inertness) of both complexes. Thus, Hind ligands underwent stepwise deprotonation in [3]Cl2 and [4]Cl2
resulting in the charge neutral complexes [5] and [6], respectively at physiological pH.
However, the low solubility of these species at physiological pH hindered further investigation of their aqueous behavior and biological activity.
Electrochemical and spectroscopic studies. Redox properties of the ruthenium nitrosyl complexes have been characterized in organic solvents since, these media provide a considerably larger potential windows for electrochemical investigations, compared to aqueous environment. The first reduction step for trans-[RuCl(Hind)4(NO)]2+ ([3]2+) in a 0.2 M nBu4NPF6/MeCN is electrochemically reversible with E1/2 = –0.11 V vs Fc+/Fc (Figure S9A) and is followed by the less reversible one at E1/2 = –0.80 V vs Fc+/Fc. Notably, a very similar behavior was reported for a number of other ruthenium nitrosyl complexes suggesting that redox events mainly involve the NO ligand, namely the reduction of formal RuII-NO+ to RuII-NO• in the first step and the RuII-NO• transformation to the RuII-NO– in the next step.53 Cyclic voltammogram of trans-[Ru(OH)(Hind)4(NO)]2+ ([4]2+) in a 0.2 M nBu4NPF6/MeCN shows the first reduction peak at Epc = –0.47 V vs Fc+/Fc at scan rate of 100 mV s–1 and a strongly shifted reoxidation peak at Epa = –0.08 V vs Fc+/Fc. The second electron transfer occurs at Epc = –0.8 V vs Fc+/Fc (Figure S9B). Similar redox behavior for [4]2+ was observed also in dichloromethane (DCM) and ethanol solutions (Figure S10). The one-electron reduction for [3]2+ was confirmed by coulometric measurements and is in line with the reduction of either trans-[RuIIICl(Hind)4(NO0)]2+ or trans-[RuIICl(Hind)4(NO+)]2+ to the corresponding monocation, which can be formulated as trans-[RuIICl(Hind)4(NO0)]+ ([3]+).
19 The latter is a paramagnetic species of {Ru(NO)}7 type according to the Enemark-Feltham notation.54 The formation of paramagnetic {Ru(NO)}7 species upon one-electron reduction was also confirmed for deprotonated analogues [5] and [6] by EPR spectroscopy, even though the first cathodic step is less electrochemically reversible (Figure S11).
The parent [3]Cl2 and [4]Cl2, were found to be EPR silent both in the solid state, as well as in the frozen solutions at 100 K. For both electrochemically generated [3]+ and [4]+ cations a characteristic {Ru(NO)}7 EPR signal, featuring a rhombic g tensor (g1 > 2, g2 ≈ 2.0, g3 < 2) and a well-resolved nitrogen hyperfine splitting in the g2 range (A2 ≈ 92 MHz or 3.3 mT), was observed (Figure S12A).55,56 Annealing of the [4]+ sample up to 220 K resulted in a progressive line broadening, and collapse of the resolved features into a single broad singlet (Figure S12B). These results are in line with the formulation of a closed shell {Ru(NO)}6 state containing RuII (S = 0) bonded to NO+ (S = 0) for the parent complexes [3]2+ or [4]2+. The reduction of the complexes then results in {Ru(NO)}7 (S = ½) species, which bears an unpaired electron and shows EPR activity.57 The rather positive value of the first reduction potential of [3]2+ offers an alternative method for convenient generation of the paramagnetic one-electron reduced species [3]+ by using decamethyl ferrocene (Fc*) as reductant. The X- and Q-band EPR spectra of frozen solutions of [3]+, prepared in this manner, are shown in Figure S13A,B, respectively. The EPR spectra obtained by chemical reduction in MeCN/nBu4NPF6 solutions (black lines in Figure S13A,B) perfectly matched the records of electro-generated [3]+. The X-band EPR signal of [3]+ resembles well the spectra of several {Ru(NO)}7 systems known from the literature, e.g., the extensively studied porphyrin complexes [Ru(OEP)(NO)(THF)],58 [Ru(OEP)(NO)(py)]59 or [(TPP)Ru(NO)(py)].60 The reduction with Fc* was also successfully used to generate the one electron reduced {Ru(NO)}7 species from [4]2+, [5]0 and [6]0. Their EPR spectra are summarized in Figures S13‒S20 and the estimated Spin Hamiltonian parameters are listed in Table S2. By simulation of the corresponding EPR spectra two components were taken into account (see discussion in SI, Figures S15‒S17 and Table S2). The major component can be clearly assigned to the authentic species [3]+ and [4]+. Detailed analysis of the minor component is beyond the scope of this paper and further detailed experimental and theoretical studies are currently underway in one of our laboratories.
The reversibility and redox mechanism in the region of the first reduction peak for [3]2+ and [4]2+ were investigated by the in situ spectroelectrochemical UV‒vis cyclic voltammetric experiments in MeCN/nBu4NPF6. Upon the in situ reduction of [3]2+ at a scan
20 rate of 10 mV s–1, in the region from +0.15 to –0.51 V vs Fc+/Fc, the UV‒vis absorption bands at 260 nm (strong absorption) and 460 (weak absorption) decreased, and, simultaneously, a new optical band at 360 nm emerged (Figure 4A). Fully reversible spectroelectrochemical behavior confirmed the high stability of cathodically generated monocation [3]+ (see response for the two consecutive CV scans in Figure 4B). Difference optical spectra (taking the initial sample solution spectrum as the reference) are shown for clarity since the transformations of the low intensity bands are easier to follow in this case (absolute spectra are shown in Figure S21). Similar spectroelectrochemical response was observed for [4]2+ (Figure S22). The potential dependence of UV–vis spectra measured for the two consecutive cyclic voltammetric scans in thin layer cell is shown in Figure S22B. Upon the in situ reduction of [4]2+ in MeCN at a scan rate of 10 mV s–1 in the region from +0.3 to – 0.6 V vs Fc+/Fc, the UV‒vis absorption band at 264 nm decreased, while a new optical bands at 284 and ca. 360 nm via an isosbestic point at 272 nm appeared (Figure S22C). The isosbestic points in the forward and the reverse voltammetric scans (Figure S22C,D) indicate the chemical reversibility of the first reduction step and the stability of the paramagnetic reduced species [4]+.
The IR spectra recorded upon the one electron reduction of [3]2+ showed a decrease of the N‒O stretching band of the parent complex at 1920 cm–1 accompanied by an increase of the monocation [3]+ NO band at 1630 cm–1 (Figure 4C). The N–O vibrational frequency of [3]2+ falls well within the range considered for NO+ state of the ligand, thus implying a 2+
oxidation state of ruthenium.55,61 On the other hand, a marked 290 cm–1 drop of the ῦNO upon reduction agrees well with the transformation of the linear RuII-NO+ {Ru(NO)}6 moiety in [3]2+ to the bent RuII-NO• {Ru(NO)}7 unit in [3]+, supporting the redox mechanism proposed above.62 A prolonged reduction of the sample, still in the range of the first electron transfer, resulted in a slow evolution of an additional band at about 1890 cm–1. It is unlikely that this band would correspond to the double reduced RuII-NO–, {Ru(NO)}8 type, [3]0 species. A similar behavior was recently reported for a porphyrin complex [Ru(OEP)(NO)Cl].58
21 Figure 4. In situ UV‒vis spectroelectrochemistry for [3]2+ in 0.2 M nBuN4PF6/MeCN (scan rate 10 mV s−1): (A) Difference UV‒vis spectra observed upon reduction of [3]2+ going to the first reduction peak. Inset: the corresponding cyclic voltammogram (two consecutive scans) with selected potentials marked with colored circles corresponding to the identically colored optical spectra; (B) Difference UV‒vis spectra detected simultaneously upon the reduction of [3]2+ in the region of the first cathodic peak (from +0.15 to –0.51 V vs Fc+/Fc) upon two consecutive cyclic voltammetric scans; (C) In situ IR spectroelectrochemistry of [3]2+ in 0.2 M nBuN4PF6/MeCN performed in an OTTLE cell; difference spectra recorded before (red line), upon (dotted lines) and after 30 s reduction at constant potential of –0.5 V vs Fc+/Fc (blue line). The N‒O stretching band of the generated [3]+ at 1630 cm–1 overlaps with the scissor vibration band of H2O in MeCN, thus producing an artifact apparent splitting.
Femtosecond Pump-Probe Spectroscopy. In order to understand the excited state relaxation and NO liberation and recombination dynamics of [3]Cl2 and [4]Cl2 complexes in solution,
22 the femtosecond time-resolved transient absorption spectra were measured by exciting at 470 nm in acetonitrile at room temperature. The transient absorption spectra of [3]Cl2 at various time delays are shown in Figure 5. At early time scale of 250 fs, a broad transient absorption maximum at around 650 nm is observed. The intensity of the absorption is decreased with increase of delay time and attaining to equilibrium within 30 ps. Similarly transient absorption of [4]Cl2 in MeCN were measured (the data is not shown) and signal intensity is weak due to the poor solubility. In order to compare the effect of the trans ligand in the excited state dynamics of the compounds, the kinetic decays of [3]Cl2 and [4]Cl2 at probing wavelength of 612 nm obtained by exciting at 470 nm are shown in Figure S23. It is observed that the kinetic profiles of both the complexes are similar. The analysis of the femtosecond transient absorption spectra consisting of a three-dimensional data set (wavelength, time, and change in absorbance) was performed with the global analysis program GLOTARAN).63 Three exponential components, 120 ± 20 fs (1), 570 ± 50 fs (2) and 6.21 ± 0.05 ps (3) were optimally obtained to fully describe the relaxation dynamics of complexes in MeCN.
The excitation of the MLCT band in the ground state absorption spectra using 470 nm generate the highest singlet charge transfer state by transferring the charge from the metal to the ligand and followed by the internal conversion leading to the lowest vibrational state of first singlet state 1MLCT. This leads to the formation of 3MLCT by intersystem crossing. The time constant of these processes could be around or less than the 1 which is within the instrumentation limit. The decay of the triplet state (3MLCT) is attributed to the time constants of 2. Here it is to be noted that though 3MLCT of [Ru(bpy)3]2+ in MeCN solution formed within 100 fs with conversion efficiency of nearly 100% having lifetime of ~ 1 s,64 few Ru complexes with short lived or absence of triplet state have been already reported.65 It is observed that the lifetime of triplet state depends on the Ru‒N distance and strength of ligand field.65a In addition the contribution of 3LMCT transitions from the unreduced ligand to formerly oxidized Ru(III) center cannot be ruled out.66 Based on the theoretical studies,67 it is proposed that the Ru-NO dissociates in the triplet state and the dynamics of NO rebinding occurring with the time constant of 3.
![Figure 1. A) ORTEP view of the cation [RuCl(NO)(Hind) 4 ] 2+ in the crystal structure of [3]Cl 2 ·2(CH 3 ) 2 CO) with atom labeling scheme and thermal ellipsoids at 50% probability level;](https://thumb-eu.123doks.com/thumbv2/9dokorg/1292114.103687/14.892.112.792.265.489/figure-ortep-crystal-structure-labeling-thermal-ellipsoids-probability.webp)
![Figure 2. Visible (A) and UV (B) spectra of [4]Cl 2 recorded at various pH values in 50% (v/v) ethanol/water](https://thumb-eu.123doks.com/thumbv2/9dokorg/1292114.103687/17.892.307.590.167.553/figure-visible-spectra-recorded-various-values-ethanol-water.webp)
![Figure 5. Femtosecond time-resolved transient absorption spectra of [3]Cl 2 in MeCN upon excitation at 470 nm measured at different time delays](https://thumb-eu.123doks.com/thumbv2/9dokorg/1292114.103687/23.892.267.629.100.384/figure-femtosecond-resolved-transient-absorption-excitation-measured-different.webp)
![Figure 7. B3LYP/SVP(SDD) spin densities of [3] +(1) lower in energy (A) and of [3'] 2+ (B), isovalue ±0.005](https://thumb-eu.123doks.com/thumbv2/9dokorg/1292114.103687/27.892.114.786.401.596/figure-lyp-svp-sdd-densities-lower-energy-isovalue.webp)
![Table 4. Cytotoxicities of complexes [1], [3]Cl 2, [4]Cl 2, cisplatin and KP1019](https://thumb-eu.123doks.com/thumbv2/9dokorg/1292114.103687/28.892.173.713.418.608/table-cytotoxicities-complexes-cl-cl-cisplatin-kp.webp)
![Table 5. Cytotoxicities of complexes 1, [3]Cl 2, [4]Cl 2, cisplatin and oxaliplatin](https://thumb-eu.123doks.com/thumbv2/9dokorg/1292114.103687/30.892.93.770.323.571/table-cytotoxicities-complexes-cl-cl-cisplatin-oxaliplatin.webp)
![Highly Antiproliferative Latonduine and Indolo[2,3‑c]quinoline Derivatives: Complex Formation with Copper(II) Markedly Changes the Kinase Inhibitory Profile](data:image/gif;base64,R0lGODlhAQABAIAAAP///wAAACH5BAEAAAAALAAAAAABAAEAAAICRAEAOw==)