www.nature.com/scientificreports
ca (2 + ) n it Be Measured? Detection of extramitochondrial calcium
Movement With High-Resolution fluoRespirometry
Anna nászai, emil terhes, József Kaszaki, Mihály Boros & László Juhász
*our aim was to develop a method to detect extramitochondrial ca2+ movement and o2 fluxes simultaneously. Using High-Resolution fluoRespirometry, we also tested whether mitochondrial permeability transition pore (mPTP) inhibition or anoxia affects the mitochondrial Ca2+ flux. Ca2+
movement evoked by cacl2 or anoxia was assessed with CaGreen-5N dye using Blue-Fluorescence- Sensor in isolated liver mitochondria, liver homogenates and duodenal biopsies. exogenous cacl2
(50 µM) resulted in an abrupt elevation in CaGreen-5N fluorescence followed by a decrease (Ca2+ uptake) with simultaneous elevation in o2 consumption in liver preparations. this was followed by a rapid increase in the fluorescence signal, reaching a higher intensity (Ca2+ efflux) than that of the initial CaCl2- induced elevation. chelation of ca2+ with EGTA completely abolished the fluorescence of the indicator.
After pre-incubation with cyclosporin A, a marked delay in ca2+ movement was observed, not only in isolated liver mitochondria, but also in tissue homogenates. in all samples, the transition to anoxia resulted in immediate increase in the level of extramitochondrial ca2+. the results demonstrate that the CaGreen-5N method is suitable to monitor simultaneous O2 and ca2+ fluxes, and the opening of mPTP in various biological samples. in this system the duration of stimulated ca2+ fluxes may provide a novel parameter to evaluate the efficacy of mPTP blocker compounds.
Mitochondria are main controller units of calcium (Ca2+) homeostasis of the eukaryotic cell1. Various channels, transmembrane proteins and receptors have been identified in the regulation of mitochondrial Ca2+ influx, efflux and storage, and the net result of these processes fundamentally influences the activity of intracellular regulatory systems. Low micromolar concentration range (~0.1–10 µM) of Ca2+ activates various enzymes (e.g. piruvate dehydrogenase, isocitrate dehydrogenase and alpha-ketoglutarate dehydrogenase) in the mitochondrial matrix2, stimulates the outer mitochondrial membrane-bound monoamine oxidase A (MAO-A), the enzyme responsi- ble for the degradation of biogenic amines3, and influences the action of the mitochondrial antioxidant system through the regulation of manganese superoxide dismutase (MnSOD) activity4. In this range, Ca2+ fine-tunes oxidative phosphorylation and ATP synthesis, and the electron transport system (ETS) can be either stimulated or depressed2,5–7. Higher concentrations (~50 µM) may, however, lead to the opening of the mitochondrial perme- ability transition pore (mPTP), with non-selective Ca2+ efflux, collapse of mitochondrial membrane potential and apoptosis-mediated cell death8,9. The multiple roles of Ca2+ in cellular and mitochondrial function and the mech- anism of mPTP activation in various hypoxia-associated pathologies are in the focus of intense research interest and laboratory investigation10. However, despite its importance, current technical and analytic options have pre- vented the collection of essential data on simultaneous Ca2+ and O2 fluxes in cells or mitochondria11,12. Therefore, our aim was to design a method, where the respiratory chain activity and mPTP opening can be detected together with extramitochondrial Ca2+ concentrations. More directly, our aim was to examine the Ca2+-activated mPTP opening and mPTP-mediated Ca2+ release, in association with O2 consumption changes in isolated mitochon- dria, tissue homogenates and tissue biopsy samples. Since detailed protocols and technical information on the subject were not available, the effect of mPTP inhibition was also tested together with anoxia-induced changes in Ca2+ flux when the function of ETS was inhibited.
University of Szeged, Faculty of Medicine, Institute of Surgical Research, Szeged, Hungary. *email: juhasz.laszlo.1@
med.u-szeged.hu
open
www.nature.com/scientificreports www.nature.com/scientificreports/
For this in-depth study, High-Resolution FluoRespirometry was used for the combined detection of Ca2+
and O2 fluxes, and Calcium Green-5N (CaGreen-5N), a single wavelength fluorescent dye, was employed to measure extramitochondrial Ca2+. It has been shown that this probe has a low affinity for Ca2+, making it suitable for evaluating relatively high Ca2+ concentrations (KD 14000 nM, 0.5–50 µM) and insensitive to Mg2+
(Supplementary Fig. S1), which increases its selectivity13. Another advantage is that the Ca2+ signal remains stable for a longer period (at least for 120 min) with negligible bleaching and without shifting its excitation or emission wavelengths14.
Materials and Methods
Animals.
Male Sprague–Dawley rats (330–360 g) and SKH-1 hairless mice (20–30 g) were used. The ani- mals were housed in plastic cages (21–23 °C) with a 12/12 h dark-light cycle and ad libitum access to standard rodent chow and water. The experiments were performed in accordance with National Institutes of Health guide- lines on the handling and care of experimental animals and EU Directive 2010/63 for the protection of animals used for scientific purposes. All animal experimental protocols were reviewed by the National Scientific Ethical Committee on Animal Experimentation (National Competent Authority of Hungary) and was approved by the Animal Welfare Committee of the University of Szeged (approval number V/175/2018). Tissue samples of liver and duodenum were taken after ketamine and xylazine (rats: 50 and 10 mg kg−1, mice: 80 and 24 mg kg−1 ip, respectively) anaesthesia.Reagents.
CaGreen-5N (Hexapotassium Salt, cell impermeant) was purchased from Thermo Fisher Scientific (Waltham, Mass., USA). All other reagents, including respiratory substrates and inhibitors, were purchased from Sigma Aldrich (St. Louis, Mo., USA). Manual titration of these substances for 2 mL volume was carried out with Hamilton syringes. (Details on exact volumes and concentrations can be found at http://wiki.oroboros.at/imag- es/f/fc/Gnaiger_2014_Mitochondr_Physiol_Network_MitoPathways.pdf).composition of respiration media.
In pilot experiments using liver samples and multicomponent MiR05 medium with or without EGTA (0.5 mM), Ca2+ fluxes were not detected. This could be attributed to the lactobi- onic acid, taurine and bovine serum albumin components of MiR05 that are suggested to bind/chelate Ca2+. For this reason, we used a mannitol- and sucrose-based respiration buffer9 in which Ca2+ fluxes were readily distin- guished from addition of Ca2+ (Supplementary Fig. S2).preparation of ca
2+indicator.
CaGreen-5N, a single wavelength fluorescent dye, was used to measure extramitochondrial Ca2+. This probe has a low affinity for Ca2+13, making it suitable for evaluating relative high Ca2+ concentrations (KD 14000 nM, 0.5–50 µM). CaGreen-5N was dissolved through magnetic stirring in anhy- drous dimethyl sulfoxide (DMSO), and 2 mM stock solution were prepared according to manufacture’s instruc- tions. Stock solution was aliquoted (20 µL) in sterile Eppendorf vials, covered with strips of aluminium foil and stored at −20 °C until further use.The effect of respiratory substrates and inhibitors on CaGreen-5N fluorescence. Signal stability of CaGreen-5N was verified in 2 mL volume of respiration media after titration of substrates (10 mM glutamate, 2 mM malate, 10 mM succinate and 2.5 mM ADP) and inhibitors (0.5 µM rotenone, 2.5 µM antimycin A, 100 mM sodium azide and 1 µM cyclosporin A; Supplementary Fig. S3). Among these compounds, only the complex IV inhibitor sodium azide (NaN3) affected fluorescence markedly; here, a nearly 50% decrease in signal intensity was observed (Supplementary Fig. S3). This led us to avoid the use of NaN3 in optical measurements. Apart from the NaN3 effect, a chamber opening (removal of stopper) with a steep increase in the CaGreen-5N signal resulted in a fluorescent artefact as well (Supplementary Fig. 3).
calibration and measurements using High-Resolution fluoRespirometry.
All mitochon- drial measurements were performed using High-Resolution FluoRespirometry (O2k, Oroboros Instruments, Innsbruck, Austria). On the day of the experiment, a 40 min stabilization period was allowed for air calibration and temperature equilibration of the incubation medium, visualized as stabilization of the Peltier power (http://wiki.oroboros.at/images/7/77/MiPNet06.03_POS-Calibration-SOP.pdf). After 40 min, the O2 signals were stable with the O2 slope (uncorrected) close to zero (at gain 1 for sensor and 800 mV polarization voltage). Noise of the O2 slope was within ± 2 pmol s−1 mL−1 at a data recording interval of 2 sec and 40 data points selected for calcula- tion of the slope. Calibration and measurements were performed during continuous stirring (750 rpm) at 37 °C in a 2 mL respiration medium9 containing 210 mM mannitol, 70 mM sucrose, 0.2 mM KH2PO4 and 5 mM Tris-HCl adjusted to pH 7.4. The DatLab software (Oroboros Instruments, Innsbruck, Austria) was used for online display, FluoRespirometry data acquisition and analysis. Blue Fluorescence-Sensor (excitation 465 nm; gain for sensor:
1000 and polarization voltage: 500 mV) was connected15 to the windows on the glass chambers and the instru- ment (Oroboros Instruments, Innsbruck, Austria) to measure flourescence. Ca2+-related changes were expressed as the rate of changes in fluorescent signal and average resting fluorescence using the following formula: ∆Ca2+
= ∆F/F = (F − Frest)/Frest, where F is the indicator fluorescence at any given time during the experiments and Frest
is the average fluorescence signal before treatment (e.g. exogenous Ca2+) or before the start of in vitro anoxia in the respiration chamber.
Mptp-mediated ca
2+release in isolated mitochondria.
A modified method described by Sumbalova et al. (2016) was used for mitochondria isolation (See http://wiki.oroboros.at/images/d/dc/MiPNet20.08_IsolationRatLiver-mt.pdf). The liver tissue was dissected and placed in ice-cold phosphate buffered saline (PBS;
pH 7.4), and wet weight was measured (1.5 g of liver tissue was used for isolation). Liver samples were cut into small pieces with a sharp scissors, suspended in 10 volumes of ice-cold isolation medium (225 mM mannitol,
www.nature.com/scientificreports www.nature.com/scientificreports/
5 mM sucrose and 0.2 mM EDTA adjusted pH to 7.4) and transferred to a pre-cooled Potter-Elvehjem. After homogenization (10 strokes), samples were centrifuged at 1000 g for 10 min at 4 °C (Fig. 1a). Then 1.2 mL super- natant was transferred to 1.5 mL Eppendorf tubes and centrifuged at 6200 g for 10 min at 4 °C. After the sec- ond centrifugation, the supernatant was discarded, and sediment containing mitochondria was resuspended in 600 µL isolation medium each. Samples in 1.2 mL (2 resuspended Eppendorf tubes) isolation medium were centrifuged again at 6200 g for 10 min at 4 °C. Finally, the supernatant was discarded, mitochondria was resus- pended in 100 µL isolation medium and stored on ice for no more than 3 h until measurement. Protein content was determined with the Biuret method from fresh mitochondrial samples, and 0.15 mg mL−1 concentration was used for the FluoRespirometric measurements. Thirty min after isolation, the succinate pathway control state (http://www.bioblast.at/index.php/Succinate_pathway_control_state) was activated with complex II substrate (S;
10 mM succinate). To prevent accumulation of oxaloacetate (a known endogenous inhibor of succinate dehy- drogenase), complex I was blocked with 0.5 µM rotenone (Rot) prior to succinate administration. Stimulation of oxidative phosphorylation (OXPHOS) with adenosine diphosphate (ADP) was omitted from the protocol due to its inhibitory effect on mPTP opening16. After stable respiration, Ca2+ movement was assessed with CaGreen-5N fluorescent dye (2 µM; excitation: 506 nm; emission: 532 nm). Mitochondrial Ca2+ influx and sub- sequent mPTP-mediated Ca2+ efflux were stimulated with the addition of 50 µM calcium chloride (CaCl2). When maximum fluorescence was reached, 1 mM EGTA was used for Ca2+ removal. ETS-independent respiration (or residual O2 consumption; ROX) was determined after complex III inhibition with antimycin A (AmA; 2.5 µM).
Duration of Ca2+ fluxes (t1 influx and t2 efflux) was expressed in seconds (s), whereas volume-specific O2 flux (JV,O2) was expressed in pmol sec−1 mL−1.
Mptp-mediated ca
2+release in tissue homogenate.
The experiments were expanded to deter- mine the simultaneous Ca2+ flux and O2 consumption in homogenate samples (Fig. 1b). A modified fluorescent method developed by Elustondo et al. in isolated liver mitochondria9 was used to measure homogenate Ca2+ flux.In brief, tissue biopsies were obtained from the left lateral liver lobe (~300 mg), cut into small (<20 mg) pieces, washed five times with PBS (pH 7.4) and then homogenized (with a Potter-Elvehjem, 1:10% w V−1) in isolation media containing 225 mM mannitol, 5 mM sucrose and 0.2 mM EDTA (pH 7.4). All the mitochondrial samples were energized with complex II substrate (10 mM succinate) after complex I blockade with rotenone (0.5 µM).
Stimulation with ADP was omitted from the protocol due to its inhibitory effect on mPTP opening16. After reach- ing a stable respiration, Ca2+ movement was assessed with 2 µM CaGreen-5N fluorophore. Ca2+-induced Ca2+
flux was stimulated with the addition of 50 µM CaCl2. At the end of mPTP-mediated Ca2+ release, 1 mM EGTA was used to chelate Ca2+. ROX was determined after complex III inhibition with antimycin A (2.5 µM). Duration of Ca2+ signals (t1 and t2) was expressed in seconds (s), whereas volume specific O2 flux (JV,O2) was expressed in pmol sec−1 mL−1 normalized to 8 mg wet weight per chamber.
ca
2+movement in isolated mitochondria under anoxia.
To elucidate the mechanism of transition from hypoxia to anoxia (anoxia was defined as ~0 nmol mL−1 O2 concentration in O2k chambers at 37 °C), sam- ples were allowed to consume dissolved O2 available in respiration media. Thus, the chambers were kept closed Figure 1. Preparation of isolated liver mitochondria and liver homogenate. The whole liver was harvested to prepare isolated mitochondrial fraction (a) or the left lateral liver lobe (b) was used for homogenate preparation.After differential centrifugation or homogenization, a High-Resolution FluoRespirometer equipped with Fluorescence Sensor Blue was used for functional measurements.
www.nature.com/scientificreports www.nature.com/scientificreports/
throughout the experiments (to avoid any contact with air under anoxia), and oxygenation (e.g. O2 generation by catalase from hydrogen peroxide) or addition of O2 (e.g. O2 gas mixture injected through a needle) was avoided through the central capillary17. Black cover-slips were placed on top of stoppers to prevent light penetrating the capillary and avoid disruption of the fluorescence signal. The preparation protocol, instrument set-up and respiration media were identical to those for mitochondria exposed to CaCl2, as described above. Samples were treated with 0.5 µM rotenone, 10 mM succinate, 2.5 mM ADP and 2 µM CaGreen-5N before anoxia. After anoxia, responsiveness of fluorescent dye was monitored by exogenous 15 µM CaCl2. The Ca2+ signal was abolished with the addition of 1 mM EGTA.
ca
2+movement in homogenate under in vitro anoxia.
Anoxic Ca2+ release was assessed in liver homogenate as well. Preparation of homogenate and anoxia induction were identical as described above.Homogenate samples were treated with 0.5 µM rotenone, 10 mM succinate, 2.5 mM ADP and 2 µM CaGreen-5N.
After anoxia, sensitivity of fluorophore was tested with 15 µM CaCl2. Ca2+ in the respiration medium was chelated with 1 mM EGTA.
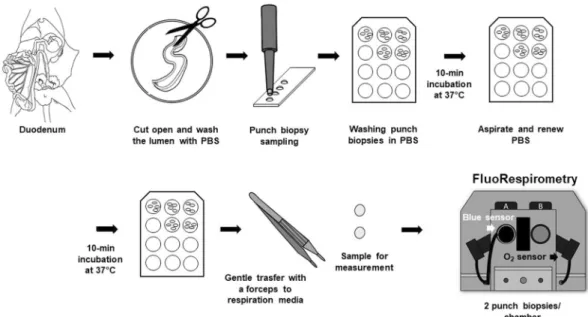
Monitoring ca
2+ fluxes in intestinal biopsy samples. Mouse doudenal samples were used to detect Ca2+ movement in tissue biopsies. Previous data have shown that samples from this site exhibit stable ROUTINE respiration (i.e. “respiration without external substrate and ADP”) and that they are responsive to ATP synthase inhibitor (2.5 µM oligomycin), as compared to other intestinal segments (Supplementary Fig. S4). In brief, an approximately 3 cm-long duodenal segment was removed (Fig. 2) and immediately placed in PBS (pH 7.4). The luminal content was rinsed three times with PBS solution using a 1 mL syringe. The empty duodenum was cut open, gently placed in a covered glass Petri dish kept on ice with ophthalmic forceps. The intestinal samples were covered with a Foliodrape drape sheet and PBS solution to prevent drying. A 4 mm diameter disposable punch biopsy knife (Integra Miltex) was used, and the biopsies were immediately transferred to a 12-well plate (Costar) washed with 400 µL PBS for 10 min at 37 °C. Measurements were performed in 2 mL of mannitol- and sucrose-based medium at 37 °C. Two punch biopsies per respiratory chamber were energized with succinate (S;10 mM in the presence of rotenone; exogenous Ca2+) or with succinate and 2.5 mM ADP (Rotenone + S + ADP;
estimation of endogenous Ca2+) and used for analysis. Exogenous CaCl2-induced and anoxia-induced Ca2+
fluxes were determined from these samples in the presence of 2 µM CaGreen-5N using Fluorescence-Sensor Blue. Finally, 1 mM EGTA was injected into the chambers for the chelation of Ca2+. The instrumental set-up, including excitation, gain and polarization voltage, was identical with the set-up used for isolated mitochondria and homogenate.
Modulation of ca
2+ fluxes through mPTP inhibition. We used isolated mitochondria and homogenate for the pharmacological modulation of extramitochondrial Ca2+ flux. In the experiment setting, non-specific Ca2+ release through mPTP was inhibited by 1 µM cyclosporin A. The inhibitor was pipetted to energized mito- chondria (rotenone + succinate), and then samples were incubated for 3 min at 37 °C. After chamber closure, Ca2+ movement was stimulated with 50 µM CaCl2, and Ca2+ signal was abolished with 1 mM EGTA, according to the previously described protocol.Figure 2. Preparation of punch biopsies. An intestinal section was harvested from mouse duodenum. After the lumen was opened, faeces was removed with a PBS flush. Punch biopsy (4 mm Stiefel) was used to cut tissue disks from the intestines. The circular biopsies were put into cell culture plates (4/well) containing 400 µL PBS and incubated at 37 °C for 2 × 10 mins. Two punch biopsies were transferred gently into respiration media and used for FluoRespirometric measurements.
www.nature.com/scientificreports www.nature.com/scientificreports/
Statistical analysis.
All data were expressed as mean ± SD; differences between means were compared using Student’s t test and ANOVA for repeated measures using Fisher’s LSD post hoc test, as appropriate. Data analysis was performed with a statistical software package (SigmaStat for Windows, Jandel Scientific, Erkrath, Germany).A value of P < 0.05 was considered statistically significant.
Results
exogenous ca
2+-induced ca
2+flux and the effect of anoxia in isolated liver mitochondria.
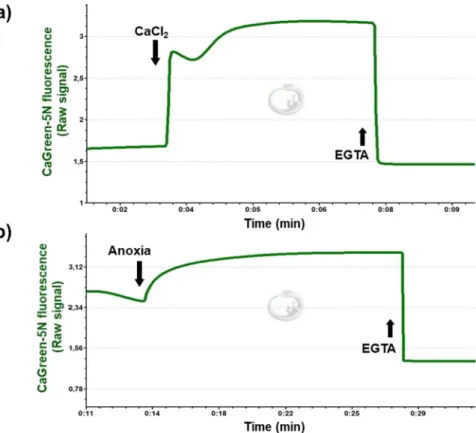
Representative Ca2+ fluxes registered in isolated rat mitochondria are shown in Fig. 3. After a stable fluorescent signal, the mitochondrial Ca2+ flux was stimulated with 50 µM exogenous CaCl2 (Fig. 3a), resulting in an immedi- ate elevation in fluorescent intensity. A few seconds later, a decline in the CaGreen-5N signal and a simultaneous increase in O2 consumption were observed, indicating the uptake of external Ca2+ (Fig. 4a–d). When mini- mal fluorescence was reached, mitochondria started to remove Ca2+ and fluorescent intensity increased again, reaching a higher value than that of the initial baseline fluorescence. This increase was most probably due to the non-selective Ca2+ efflux through mPTP9. Figure 3b shows the effect of anoxia on CaGreen-5N fluorescence. The transition to anoxia in isolated mitochondria itself provoked an immediate increase in Ca2+ efflux (Fig. 3b). A common property of fluxes is that the Ca2+ chelator EGTA completely abolishes the signal within 3 seconds, no matter whether Ca2+ flux was stimulated exogenously or mediated endogenously during anoxia.
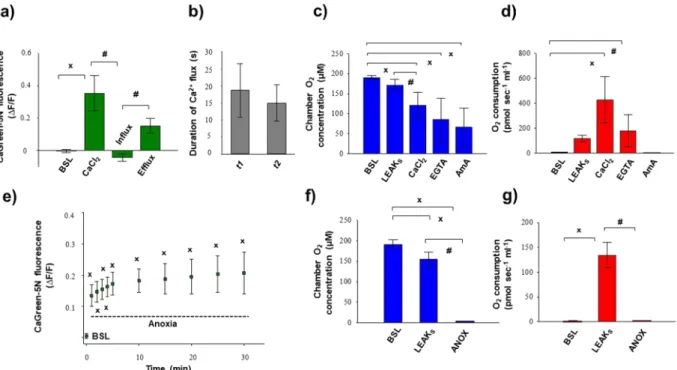
Figure 4a–d summarises the changes in Ca2+ flux, O2 flux and O2 concentration in mitochondria induced by the addition of exogenous Ca2+. The duration of Ca2+ fluxes (influx and efflux) was similar, not exceeding 30 seconds. Simultaneously with these fluxes, a marked elevation in O2 consumption was found after addition of Ca2+. Non-electron transport system-derived respiration was negligible in our preparations, since residual O2 consumption was close to zero (tested with AmA; Fig. 4d). A continuous decrease in chamber O2 concentration was obvious, but there was no limitation (it remained above 40 µM), particularly during stimulation with exog- enous Ca2+.
Figure 4e illustrates the anoxia-induced changes in the levels of Ca2+ that were evaluated at zero O2 flux and O2 consumption (Fig. 4f,g). The transition to anoxia immediately increased Ca2+ efflux, which became statistically significant 1 min after complete O2 restriction and remained elevated during the experiments.
exogenous ca
2+-induced ca
2+ flux and the effect of anoxia in liver homogenate. Representative registration of Ca2+ and O2 flux acquired by O2k-FluoRespirometer is shown in Fig. 5. The CaGreen-5N indicator was injected after activation of the succinate pathway control state. After the stabilization of respiration and the fluorescent signal, mitochondrial Ca2+ flux was stimulated with the addition of 50 µM CaCl2 (Fig. 5a), resulting in an immediate increase in fluorescence. Then a few seconds later, a decline in the CaGreen-5N signal and a Figure 3. Addition of exogenous Ca2+ and anoxia-mediated changes in Ca2+ flux. Mitochondrial Ca2+ fluxes were induced by a single administration of 50 µM CaCl2 (a) or released endogenously (b) during anoxia. Signals were abolished with 1 mM EGTA.www.nature.com/scientificreports www.nature.com/scientificreports/
simultaneous increase in O2 consumption were observed, indicating an uptake of external Ca2+. Soon after min- imal fluorescence was reached, mitochondria pumped Ca2+ out and fluorescent intensity started to elevate again, reaching a higher value than the initial baseline intensity. A decline in respiration (I) and completion of fluxes (II) are indicators of mPTP activation.
Figure 6 shows the external Ca2+-evoked quantitative changes in Ca2+ flux, O2 consumption and O2 con- centration in rat liver homogenate. In each sample, the duration of both Ca2+ influx and efflux was fast, with a maximum value of ~40 s (Fig. 6b). A prompt increase in mitochondrial O2 consumption was detected after the addition of Ca2+, which started to decline soon after the Ca2+-induced O2 peak. EGTA chelated extramitochon- drial Ca2+ and a similar O2 flux to succinate supported respiration (LEAKS) were recorded (Fig. 6d). The complex III inhibitor antimycin A almost completely abolished the electron transport system-dependent respiration (or ROX). The O2 concentration in the chamber remained above 50–100 µM after Ca2+ injection; thus, there was no limitation of O2 for CaCl2-induced respiratory stimulation (Fig. 6c).
Anoxia was confirmed by measuring zero O2 flux and O2 consumption in respiration chambers, which are illustrated in Figs. 5b, 6f,g. Prior to anoxia (Fig. 6e, BSL), fluorescence was not changed markedly, but transition from normoxia to anoxia elevated the CaGreen-5N signal. Ca2+ release became statistically significant 5 min after the commencement of anoxia and remained elevated for a 30 min period (Fig. 6e). As with the addition of exogenous CaCl2, 1 mM EGTA blocked release of endogenous Ca2+ under anoxia and completely abolished the Ca2+ signal.
fluoRespirometry with duodenal punch biopsies.
Figure 7 shows the simultaneous changes in Ca2+flux, O2 concentration and O2 consumption measured in duodenal samples. Punch biopsies consumed all dis- solved O2 in the respiration medium, resulting in zero chamber O2 concentration and O2 flux (Fig. 7c,d). Our FluoRespirometric registration indicates (Fig. 7a) that in mannitol- and sucrose-based media, the previously found high capacity of oxidative phosporylation (which was assessed in a Mir05 medium) was absent, with only a small increase in O2 flux having been found. Also, the exogenous Ca2+-induced elevation in O2 consumption was not detected (data not shown). However, the inhibitory effect of rotenone and stimulatory effect of succi- nate were manifested on these duodenal segments. The CaGreen-5N signal was stabilized before anoxia; how- ever, anoxic transition immediately increased its fluorescence, and this increase remained continuous more than 30 min throughout the measurement (Fig. 7a,b). The dye exhibited changes to a low micromolar Ca2+ (15 µM) and EGTA (1 mM) under anoxia (Fig. 7a) as well.
The effect of mPTP inhibition on Ca2+
-induced ca
2+ fluxes. DatLab registrations in Fig. 8 illustrate simultaneous measurement of mitochondrial Ca2+ and O2 flux in the absence (Fig. 8a) and presence (Fig. 8b) of CsA. Pre-incubation with the inhibitordelayed Ca2+ flux, particularly the duration of Ca2+ efflux (t2), was indi- cated by slow elevation of fluorescence after the maximum Ca2+ uptake. Secondly, Ca2+ influx was also increased, Figure 4. Exogenous Ca2+- (a–d) and anoxia- (e–g) induced changes in Ca2+ flux, O2 flux and O2 concentration in isolated liver mitochondria. An immediate increase in Ca2+ fluorescence was found both after the injection of CaCl2 and commencement of anoxia. Bars (a–g) show means ± SD, n = 4 independent rats measured in duplicate (a–d) and n = 5 independent rats (e–g). XP < 0.05 vs before anoxia or Ca2+ stimulus (BSL) and#P < 0.05 vs Ca2+ influx, anoxia and LEAKs.
www.nature.com/scientificreports www.nature.com/scientificreports/
since a more pronounced decrease in CaGreen-5N signal was found after stimulation. Third, the Ca2+-induced respiratory stimulation occurred in a different manner. In contrast with the vehicle-treated mitochondria, where a single injection of CaCl2 resulted in a single peak in O2 consumption, CsA pretreatment resulted in two well-distinguishable O2 peaks or a delayed peak in maximum O2 consumption. Figure 9 summarises the fluores- cent changes and the duration of Ca2+ fluxes in rat isolated mitochondria and liver homogenate. The duration of Ca2+ uptake and that of subsequent Ca2+ release were very similar (t1: 19 ± 8 and t2: 15 ± 5 in isolated mitochon- dria; t1: 32 ± 9 and t2: 30 ± 10 in homogenate) without CsA, whereas in the presence of CsA, a delayed Ca2+ efflux and distinct t1/t2 rate were observed (t1: 53 ± 14 and t2: 506 ± 250 in isolated mitochondria and t1: 66 ± 17 and t2: 402 ± 259 in homogenate) both in rat isolated mitochondria and homogenate (Fig. 9c,d). This delayed effect was associated with a more pronounced decrease in fluorescence after 50 µM of CaCl2 injection. Similar results were obtained from SKH-1 mice (Supplementary Fig. S5).
Discussion
Our study describes a novel method to detect simultaneous Ca2+ and O2 fluxes in various biological sam- ples, together with exogenous Ca2+-induced mPTP opening and anoxia-induced changes in Ca2+ level. We employed High-Resolution FluoRespirometry, an established method for the simultaneous evaluation of mito- chondrial functional indices and respiration15,18,19, and we combined the O2 and Ca2+ flux measurements using CaGreen-5N, a probe that reversibly binds to Ca2+12.
In the first set of experiments, liver mitochondrial preparations and intestinal biopsies were kept under nor- moxic conditions (O2 concentration was above ~150 µM before the addition of higher concentrations of CaCl2), and external Ca2+ was added to activate mPTPs and also to promote non-selective Ca2+ release through these channels. Both isolated mitochondria and tissue homogenate were responsive to a higher exogenous Ca2+
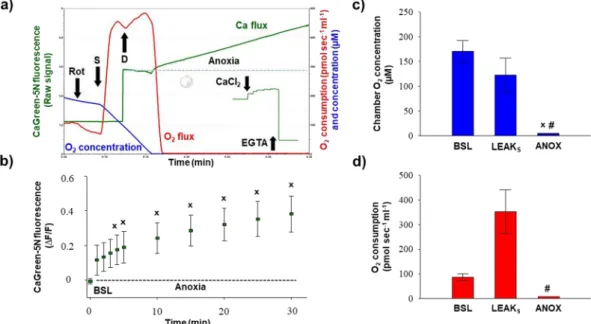
(50 µM), whereas the duodenal biopsies did not exhibit marked changes in CaGreen-5N fluorescence and increase of O2 consumption after the same insult. The reason behind the tissue-specific differences may stem from the more complex cellular milieu of intestinal punch biopsies. Duodenal segments contain various type of cells Figure 5. Simultaneous measurement of Ca2+ and O2 flux after exogenous Ca2+ administration (a) and during anoxia (b). Superimposed lines illustrate extramitochondrial Ca2+ flux (green), mitochondrial O2 consumption (O2 flux; red) and O2 concentration (blue). Mitochondrial Ca2+ fluxes were induced by a single administration of 50 µM CaCl2 (a). Sensitivity of fluorophore during anoxia was tested by repeated addition of 15 µM CaCl2 (b).
www.nature.com/scientificreports www.nature.com/scientificreports/
from all layers of bowel. It may well be that a higher external Ca2+ concentration should be used for the induction of Ca2+ fluxes. Secondly, we have no information on the magnitude of cellular Ca2+ influx (whether Ca2+ uptake actually occurs) and circumstances that may potentially contribute to elimination of Ca2+ (binding of Ca2+ by membrane proteins, lipids and other endogenous chelators) or modulate Ca2+ homeostasis (ER-mediated Ca2+
release in duodenal muscle layers).
Figure 6. Exogenous Ca2+- (a–d) and anoxia- (e–g) induced changes in Ca2+ flux, O2 flux and O2 concentration in liver homogenate. An immediate increase in Ca2+ fluorescence was found both after the injection of CaCl2
and anoxia. Bars (a–g) show means ± SD, n = 8 independent rats. XP < 0.05 vs before anoxia or Ca2+ stimulus (BSL) and #P < 0.05 vs Ca2+ influx and anoxia.
Figure 7. Anoxic transition in duodenal punch biopsies. Anoxia (ANOX) resulted in an immediate increase in Ca2+ fluorescence. Responsivness of fluorophore under anoxia was checked by adding CaCl2 (15 µM) and 1 mM EGTA. Superimposed lines in (a) illustrate Ca2+ flux (green), O2 consumption (O2 flux; red) and O2 concentration (blue) in the respiration chamber. Bars (b–d) show means ± SD, n = 4 independent mice measured in duplicate. XP < 0.05 vs before anoxia (BSL) and #P < 0.05 vs LEAKS.
www.nature.com/scientificreports www.nature.com/scientificreports/
Stimulated fluxes in liver-isolated mitochondria and homogenate, however, exhibited similar Ca2+ signals.
Shortly after CaCl2 administration, a reduction of CaGreen-5N signal and a simultaneous increase in O2 con- sumption were observed, indicating an uptake of external Ca2+. Elevated O2 flux was also detected in these preparations when mitochondria started to pump Ca2+ out and therefore the fluorescence signal increased again.
Another common point is that fluorescent intensity reached a higher value than that of the initial maximum Ca2+
peak after a single addition of CaCl2, indicating a massive Ca2+ efflux through mPTPs. Furthermore, the opening of these channels (reaching the fluorescence maximum) was accompanied by a decline in respiration. Of note, EGTA abolished the signal within 3 sec independently of the type of sample. The duration and rate of Ca2+ influx and subsequent Ca2+ efflux were also very similar in isolated mitochondria and homogenate in the absence of the mPTP inhibitor. When the samples were treated with CsA, the duration of stimulated Ca2+ fluxes, in particular Ca2+ efflux (t2), was prolonged, the Ca2+ influx was elevated (indicated by an abrupt decline in fluorescence), and dyscoupled respiration was delayed, indicated either by two O2 peaks or a single, delayed peak in maximum O2 consumption. The prolonged duration of mitochondrial dyscoupling (indicated by an increase in JV,O2 after 50 µM CaCl2) may be associated with a delayed inner membrane depolarization and inhibiton of membrane potential disruption.
To our best knowledge, these are the first results to describe and characterize simultaneous changes in Ca2+
and O2 flux mediated by mPTP inhibition, both in isolated mitochondria and tissue homogenate. In fact, fluores- cent techniques are available to determine mPTP opening, including spectrofluorimetric determination of Ca2+
retention capacity in isolated mitochondria (CRC11,12), fluorescence microscopy protocols in living cells using the calcein-cobalt technique or mitochondrial membrane potential changes (TMRM) and ionomycin-induced swell- ing and mitochondrial network fragmentation assay with mitochondrially-targeted GFP20. However, all these Figure 8. Simultaneous measurement of mitochondrial Ca2+ and O2 flux in the presence and absence of cyclosporin A. Inhibition of mPTPs with cyclosporin A (CsA) elevated Ca2+ uptake and delayed Ca2+ efflux after stimulation with exogenous Ca2+ (b). Superimposed lines illustrate extramitochondrial Ca2+ flux (green), mitochondrial O2 consumption (O2 flux; red) and O2 concentration (blue). Black lines illustrate the duration of Ca2+ fluxes (t), and the component influx (t1) and efflux (t2).
www.nature.com/scientificreports www.nature.com/scientificreports/
methods focus on immediate changes in a single mitochondrial parameter. In addition, the function of ETS is critically dependent on the O2 concentration dissolved in a medium and the O2 availability at the surface of the sample. The limitation of O2 is a significant shortcoming of all in in vitro studies with mitochondrial preparations or cells because the insufficient O2 decreases the maximum capacity of OXPHOS and decreases the uncoupler- or Ca2+-triggered respiratory stimulation as well.
FluoRespirometric measurements with CaGreen-5N have previously been reported9, but several challeng- ing questions have remained unanswered. In this respect, our most important technical modifications were as follows: 37 °C was used instead of 25 °C, the succinate pathway control state was activated instead of the NADH electron transfer pathway state, the composition of the medium used for isolation was improved, and the fluoro- phore tracer concentration was increased (from 1 µM to 2 µM). In pilot studies, we ascertained that these changes will make the detection of exogenous Ca2+-triggered Ca2+ fluxes possible. Based on these findings, it appears that the composition of the respiration buffer is perhaps the most critical factor in Ca2+ flux detection. In the multicomponent respiration medium (MiR05), Ca2+ fluxes were undetectable, even in the absence of a chelator, but a mannitol- and sucrose-based respiration buffer (without chelator) made the Ca2+ fluxes readily distin- guishable from the addition of CaCl2. It may well be that some components of MiR05, such as lactobionic acid, taurine or bovine serum albumin, bind Ca2+ directly, or they make mitochondria resistant to external Ca2+ stress through membrane stabilization (antioxidant or inhibition of fatty acid oxidation) rendering Ca2+ flux detection impossible.
Measuring the duration of stimulated Ca2+ influx or efflux after single Ca2+ injections instead of multiple additions of relatively low concentrations of Ca2+ (as in the case of the CRC method) may be an alternative option to reducing the interval between individual additions, thereby minimizing differences originating from multiple Ca2+ exposure. These differences include distinct alterations in the depolarization of the inner mitochondrial membrane that may occur before mPTP opening. Not only can duration of fluxes be detected after a single Ca2+ injection, but also changes in fluorescence; thus, two parameters, time (t, t1 and t2 in s and their rate t2/t1) and relative fluorescent changes in intensity of Ca2+ indicator (∆F/F), can be evaluated at the same time and compared to the inhibitory effect of CsA. Further investigations are necessary to optimize the concentration of exogenous Ca2+ and specifically to determine whether more or less than 50 µM should be used to open the mPTP in isolated mitochondria in organs other than the liver. Based on our data, we suggest that simultaneous measure- ment of Ca2+-triggered Ca2+ and O2 flux may aid in testing and comparing (I) the effect of novel mPTP blockers (N-Me-Ala-6-cyclosporin A, N-Me-Val-4-cyclosporin and Sanglifehrin A21), which lack immunosuppressive Figure 9. Ca2+ flux after mPTP inhibition in rat isolated mitochondria and liver homogenate. Changes in CaGreen-5N fluorescence (a,b) and duration of stimulated Ca2+ fluxes (c,d) are illustrated. Bars show means ± SD, n = 5 rats. XP < 0.05 vs before Ca2+ stimulus (BSL) and #P < 0.05 compared to fluorescent intensity of Ca2+ influx or t1.
www.nature.com/scientificreports www.nature.com/scientificreports/
effects, and (II) biologically active gases that are known to inhibit these channels, such as nitric oxide22, hydrogen sulfide23, isoflurane24, sevoflurane25 and noble gases26. Since mPTP-related fluxes were similar in isolated mito- chondria and homogenate (both in the presence and absence of CsA), a time-consuming mitochondrial isolation procedure with low-speed and multiple high-speed centrifugation can be replaced by the use of homogenate, at least in the liver. Tissue homogenate provides numerous advantages over isolated mitochondria; for example, (I) the preparation protocol is faster; (II) tissue heterogeneity is well-preserved; and (III) a small amount of tissue is required for functional mitochondrial studies.
The question arises: how does uptake by mitochondria of external Ca2+ in the respiration buffer occur, and, secondly, what are the channels through which this Ca2+ can leave the organelle? Since our primary aim was to investigate the methodological aspects of Ca2+ fluxes, further experiments are needed to clarify the precise mechanism of influx and efflux in this model. A number of mitochondrial Ca2+ influx mechanisms have recently been identified in the literature, for instance, (I) rapid uptake mechanism-related Ca2+ uptake (RaM; quick, nano- molar Ca2+ influx27); (II) mitochondrial Ca2+ uniporter (which operates at a higher micromolar concentration of Ca2+28); (III) mitochondrial N-methyl-D-aspartate receptors29 in rat heart; (IV) leucine zipper-EF-hand con- taining transmembrane protein 1 (LETM1; the mitochondrial Ca2+/H+ antiporter30); (V) uncoupling protein (UCP31) 2 and 3; (VI) mitochondrial ryanodine receptor (mRyR32); and (VII) electron transport system-mediated Ca2+ uptake (coenzyme Q, which binds and transports Ca2+33).
As concerns efflux, so far three mechanisms have been documented in Ca2+ transport: (I) mPTPs8, (II) mito- chondrial Na+/Ca2+ exchanger (mNCX34) and (III) Ca2+-proton (H+) exchanger (mHCX)35. Among Ca2+ entry mechanisms, the mitochondrial Ca2+ uniporter (MCU) seems to be a candidate since it operates at micromolar Ca2+ range (˃10 µM36), and the duration of Ca2+ uptake is slower than RaM-mediated influx (~ns). According to a potential model, it is suggested that Ca2+ transport through MCU is inhibited through MICU1 and MICU2 reg- ulatory protein (“gatekeepers”) at a lower concentration of Ca2+, whereas it allows Ca2+ entry into the matrix at a higher concentration of Ca2+ as a result of conformational change in the protein via Ca2+ binding of EF hands of MICU1/MICU236. Moreover, activation of mPTPs has been shown to be inhibited in MCU knockout mitochon- dria or after channel blockade with Ru36037–40. We hypothesize that RAM mechanism-mediated Ca2+ entry plays a negligible role or is undetectable in our measurements because changes in CaGreen-5N fluorescence occur at a higher (0.5–50 µM) concentration of Ca2+, whereas RAM operates at nanomolar concentration range41,42.
An increase in the level of intracellular Ca2+ can influence mitochondrial ROS formation43. Despite dissipa- tion of mitochondrial membrane potential and mPTP activation, 50 µM CaCl2 did not affect the rate of extrami- tochondrial H2O2 generation in pilot studies using liver-isolated mitochondria (Supplementary Fig. S6). Substrate dependence of the effect of Ca2+ on ROS production has previously been described in the literature43. Thus, it may well be that other respiratory substrates should be added to succinate (or completely replaced) to stimu- late the fatty acid oxidation pathway control state with octanoylcarnitine, palmitoylcarnitine (F-pathway) or the N-pathway with glutamate, malate and pyruvate to measure Ca2+-induced mitochondrial ROS generation.
In contrast with exogenous Ca2+-triggered Ca2+ flux, anoxia-related endogenous Ca2+ release occurred in all the types of samples studied. A continuous increase in CaGreen-5N fluorescent intensity was started immediately after the commencement of anoxia, with no decrease in its intensity after 30 min. The mechanism behind anoxic Ca2+ release may involve the possibilities noted above, i.e. mNCX, mHCX or mPTPs, or their combined action.
In addition, responsiveness of fluorophore to exogenous CaCl2 was detected, and then the signal was successfully abolished with EGTA several hours (~3–4 h) later under anoxia (Fig. 5b). This observation facilitates the design of experiments with prolonged protocols and allows for a deeper insight into anoxia-induced mitochondrial Ca2+
movements and non-mitochondrial Ca2+ transport as well.
The study design has certain limitation because it is solely based on the High-Resolution FluoRespirometry technique. Besides, organelle-targeted biosensors can also be used to confirm the correlation between respiration activity and Ca2+ homeostasis in the cells. It should be noted here that metabolic differences may also affect the results. In isolated liver mitochondria and homogenate samples OXPHOS seems to be the predominant source of energy production while immortalized cell lines may privilege glycolysis over OXPHOS (Crabtree effect and Warburg effect). The different pathways for ATP production would largely affect mitochondrial function, includ- ing membrane potential and Ca2+ transport as well.
In summary, the new method is suitable to monitor simultaneous O2 and Ca2+ fluxes and the opening of mPTPs in various biological samples (in isolated mitochondria and tissue homogenate) after stimulation with external Ca2+. It can also be used to monitor anoxia-induced changes in Ca2+ release. Measuring the duration of stimulated Ca2+ fluxes may provide a novel parameter to evaluate the efficacy of mPTP blocker compounds.
Received: 17 July 2019; Accepted: 13 November 2019;
Published: xx xx xxxx
References
1. Duchen, M. R. Mitochondria and calcium: from cell signaling to cell death. J Physiol. 529, 57–68 (2000).
2. Tarasov, A. I., Griffiths, E. J. & Rutter, G. A. Regulation of ATP production by mitochondrial Ca(2+). Cell Calcium 52, 28–35 (2012).
3. Kosenko, E. A., Venediktova, N. I. & Kaminskiĭ, Iu G. Calcium and ammonia stimulate monoamine oxidase A activity in brain mitochondria. Izv Akad Nauk Ser Biol. 5, 542–6 (2003).
4. Pérez-Vázquez, V. et al. Effect of Ca(2+) and Mg(2+) on the Mn-superoxide dismutase from rat liver and heart mitochondria.
Amino Acids 22, 405–416 (2002).
5. Boerries, M. et al. Ca2+-dependent interaction of S100A1 with F1-ATPase leads to an increased ATP content in cardiomyocytes.
Mol Cell Biol. 27, 4365–4373 (2007).
6. Covian, R., French, S., Kusnetz, H. & Balaban, R. S. Stimulation of oxidative phosphorylation by calcium in cardiac mitochondria is not influenced by cAMP and PKA activity. Biochim Biophys Acta 1837, 1913–1921 (2014).
7. Fink, B. D., Bai, F., Yu, L. & Sivitz, W. I. Regulation of ATP production: dependence on calcium concentration and respiratory state.
Am J Physiol Cell Physiol. 313, C146–C153 (2017).
www.nature.com/scientificreports www.nature.com/scientificreports/
8. Hunter, D. R. & Haworth, R. A. The Ca2+-induced membrane transition in mitochondria. I. The protective mechanisms. Arch Biochem Biophys. 195, 453–459 (1979).
9. Elustondo, P. A., Negoda, A., Kane, C. L., Kane, D. A. & Pavlov, E. V. Spermine selectively inhibits high-conductance, but not low- conductance calcium-induced permeability transition pore. Biochim Biophys Acta 1847, 231–240 (2015).
10. Larche, J. et al. Inhibition of mitochondrial permeability transition prevents sepsis-induced myocardial dysfunction and mortality.
J Am Coll Cardiol. 48, 377–385 (2006).
11. Ichas, F., Jouaville, L. S. & Mazat, J. P. Mitochondria are excitable organelles capable of generating and conveying electrical and calcium signals. Cell 89, 1145–1153 (1997).
12. Endlicher, R., Drahota, Z. & Červinková, Z. Modification of calcium retention capacity of rat liver mitochondria by phosphate and tert-butyl hydroperoxide. Physiol Res. 68, 59–65 (2019).
13. Rajdev, S. & Reynolds, I. J. Calcium green-5N, a novel fluorescent probe for monitoring high intracellular free Ca2+ concentrations associated with glutamate excitotoxicity in cultured rat brain neurons. Neurosci Lett. 162, 149–152 (1993).
14. Paredes, R. M., Etzler, J. C., Watts, L. T., Zheng, W. & Lechleiter, J. D. Chemical calcium indicators. Methods 46, 143–151 (2008).
15. Krumschnabel, G., Eigentler, A., Fasching, M. & Gnaiger, E. Use of safranin for the assessment of mitochondrial membrane potential by high-resolution respirometry and fluorometry. Methods Enzymol. 542, 163–181 (2014).
16. Gizatullina, Z. Z., Chen, Y., Zierz, S. & Gellerich, F. N. Effects of extramitochondrial ADP on permeability transition of mouse liver mitochondria. Biochim Biophys Acta 1706, 98–104 (2005).
17. Burtscher, J., Zangrandi, L., Schwarzer, C. & Gnaiger, E. Differences in mitochondrial function in homogenated samples from healthy and epileptic specific brain tissues revealed by high-resolution respirometry. Mitochondrion 25, 104–112 (2015).
18. Chinopoulos, C., Kiss, G., Kawamata, H. & Starkov, A. A. Measurement of ADP-ATP exchange in relation to mitochondrial transmembrane potential and oxygen consumption. Methods Enzymol. 542, 333–348 (2014).
19. Makrecka-Kuka, M., Krumschnabel, G. & Gnaiger, E. High-Resolution Respirometry for Simultaneous Measurement of Oxygen and Hydrogen Peroxide Fluxes in Permeabilized Cells, Tissue Homogenate and Isolated Mitochondria. Biomolecules 5, 1319–1338 (2015).
20. Bonora, M. et al. Comprehensive analysis of mitochondrial permeability transition pore activity in living cells using fluorescence- imaging-based techniques. Nat Protoc. 11, 1067–80 (2016).
21. Rao, V. K., Carlson, E. A. & Yan, S. S. Mitochondrial permeability transition pore is a potential drug target for neurodegeneration.
Biochim Biophys Acta 1842, 1267–72 (2014).
22. Brookes, P. S. et al. Concentration-dependent effects of nitric oxide on mitochondrial permeability transition and cytochrome c release. J Biol Chem. 275, 20474–20479 (2000).
23. Papu John, A.S. et al. Hydrogen Sulfide Inhibits Ca2+-induced Mitochondrial Permeability Transition Pore (MPTP) Opening in Type-1 Diabetes. Am J Physiol Endocrinol Metab. Epub ahead of print (2019).
24. Ge, Z. D. et al. Isoflurane postconditioning protects against reperfusion injury by preventing mitochondrial permeability transition by an endothelial nitric oxide synthase-dependent mechanism. Anesthesiology 112, 73–85 (2010).
25. He, W. et al. Postconditioning of sevoflurane and propofol is associated with mitochondrial permeability transition pore. J Zhejiang Univ Sci B. 9, 100–108 (2008).
26. Pagel, P. S. et al. Noble gases without anesthetic properties protect myocardium against infarction by activating prosurvival signaling kinases and inhibiting mitochondrial permeability transition in vivo. Anesth Analg. 105, 562–569 (2007).
27. Sparagna, G. C., Gunter, K. K., Sheu, S. S. & Gunter, T. E. Mitochondrial calcium uptake from physiological-type pulses of calcium.
A description of the rapid uptake mode. J Biol Chem. 270, 27510–27515 (1995).
28. Baughman, J. M. et al. Integrative genomics identifies MCU as an essential component of the mitochondrial calcium uniporter.
Nature 476, 341–345 (2011).
29. Nesterov, S. V. et al. NMDA and GABA receptor presence in rat heart mitochondria. Chem Biol Interact 291, 40–46 (2018).
30. Jiang, D., Zhao, L. & Clapham, D. E. Genome-wide RNAi screen identifies Letm1 as a mitochondrial Ca2+/H+ antiporter. Science 326, 144–147 (2009).
31. Trenker, M., Malli, R., Fertschai, I., Levak-Frank, S. & Graier, W. F. Uncoupling proteins 2 and 3 are fundamental for mitochondrial Ca2+ uniport. Nat Cell Biol. 9, 445–452 (2007).
32. Beutner, G., Sharma, V. K., Giovannucci, D. R., Yule, D. I. & Sheu, S. S. Identification of a ryanodine receptor in rat heart mitochondria. J Biol Chem. 276, 21482–21488 (2001).
33. Bogeski, I. et al. Calcium binding and transport by coenzyme Q. J Am Chem Soc. 133, 9293–9303 (2011).
34. Palty, R. et al. NCLX is an essential component of mitochondrial Na+/Ca2+ exchange. Proc Natl Acad Sci USA 107, 436–441 (2010).
35. Crompton, M., Künzi, M. & Carafoli, E. The calcium-induced and sodium-induced effluxes of calcium from heart mitochondria.
Evidence for a sodium-calcium carrier. Eur J Biochem. 79, 549–558 (1977).
36. Finkel, T. et al. The ins and outs of mitochondrial calcium. Circ Res. 116, 1810–1819 (2015).
37. Yu, N. et al. The calcium uniporter regulates the permeability transition pore in isolated cortical mitochondria. Neural Regen Res. 7, 109–113 (2012).
38. Hamilton, J. et al. Deletion of mitochondrial calcium uniporter incompletely inhibits calcium uptake and induction of the permeability transition pore in brain mitochondria. J Biol Chem. 293, 15652–15663 (2018).
39. García-Rivas Gde, J., Carvajal, K., Correa, F. & Zazueta, C. Ru360, a specific mitochondrial calcium uptake inhibitor, improves cardiac post-ischaemic functional recovery in rats in vivo. Br J Pharmacol. 149, 829–837 (2006).
40. Luongo, T. S. et al. The Mitochondrial Calcium Uniporter Matches Energetic Supply with Cardiac Workload during Stress and Modulates Permeability Transition. Cell Rep. 12, 23–34 (2015).
41. Szabadkai, G., Pitter, J. G. & Spät, A. Cytoplasmic Ca2+ at low submicromolar concentration stimulates mitochondrial metabolism in rat luteal cells. Pflugers Arch. 441, 678–685 (2001).
42. Santo-Domingo, J. & Demaurex, N. Calcium uptake mechanisms of mitochondria. Biochim Biophys Acta 907-912, 2010 (1797).
43. Adam-Vizi, V. & Starkov, A. A. Calcium and mitochondrial reactive oxygen species generation: how to read the facts. J. Alzheimers Dis. 20, 413–426 (2010).
Acknowledgements
This study was funded by NKFIH K120232, NKFIH K116689, GINOP-2.3.2-15-2016-00015, the UNKP-18-2 New National Excellence Program from the Ministry of Human Capacities, the Szeged Scientists Academy under the sponsorship of the Hungarian Ministry of Human Capacities (EMMI:11136-2/2019/FIRFIN) and EFOP- 3.6.2-16-2017-00006. We appreciate the excellent technical assistance from Csilla Mester and Nikolett Beretka.
Author contributions
A.N. and L.J. performed the FluoRespirometric measurements on isolated mitochondria and homogenate, data analysis and statistical analysis and prepared Figure 2. E.T. performed all the experiments on the duodenal biopsy samples. L.J. wrote the manuscript and prepared Figure 1. M.B. and J.K. supervised and edited the manuscript.
All the authors reviewed the manuscript.
www.nature.com/scientificreports www.nature.com/scientificreports/
competing interests
The authors declare no competing interests.
Additional information
Supplementary information is available for this paper at https://doi.org/10.1038/s41598-019-55618-5.
Correspondence and requests for materials should be addressed to L.J.
Reprints and permissions information is available at www.nature.com/reprints.
Publisher’s note Springer Nature remains neutral with regard to jurisdictional claims in published maps and institutional affiliations.
Open Access This article is licensed under a Creative Commons Attribution 4.0 International License, which permits use, sharing, adaptation, distribution and reproduction in any medium or format, as long as you give appropriate credit to the original author(s) and the source, provide a link to the Cre- ative Commons license, and indicate if changes were made. The images or other third party material in this article are included in the article’s Creative Commons license, unless indicated otherwise in a credit line to the material. If material is not included in the article’s Creative Commons license and your intended use is not per- mitted by statutory regulation or exceeds the permitted use, you will need to obtain permission directly from the copyright holder. To view a copy of this license, visit http://creativecommons.org/licenses/by/4.0/.
© The Author(s) 2019
![thresholdoftoxicologicalconcern,anditsvalueforAOHis2.5ng/kgbodyweight[ ]. itshealtheffects,noregulatorylimitshavebeenestablishedonitsmaximalthreshold mutagenic,genotoxic,immunotoxic,and/orendocrinedisruptoreffects[ , ].Despite -pyrone Alternaria mycotoxin](data:image/gif;base64,R0lGODlhAQABAIAAAP///wAAACH5BAEAAAAALAAAAAABAAEAAAICRAEAOw==)