International Journal of
Molecular Sciences
Article
Effects of Microenvironmental Changes on the Fluorescence Signal of Alternariol: Magnesium Induces Strong Enhancement in the Fluorescence of the Mycotoxin
Eszter Fliszár-Nyúl1,2, Beáta Lemli3,4 , Sándor Kunsági-Máté3,4 and Miklós Poór1,2,*
Citation: Fliszár-Nyúl, E.; Lemli, B.;
Kunsági-Máté, S.; Poór, M. Effects of Microenvironmental Changes on the Fluorescence Signal of Alternariol:
Magnesium Induces Strong Enhancement in the Fluorescence of the Mycotoxin.Int. J. Mol. Sci.2021, 22, 8692. https://doi.org/10.3390/
ijms22168692
Academic Editor: Makoto Kimura
Received: 24 June 2021 Accepted: 11 August 2021 Published: 13 August 2021
Publisher’s Note:MDPI stays neutral with regard to jurisdictional claims in published maps and institutional affil- iations.
Copyright: © 2021 by the authors.
Licensee MDPI, Basel, Switzerland.
This article is an open access article distributed under the terms and conditions of the Creative Commons Attribution (CC BY) license (https://
creativecommons.org/licenses/by/
4.0/).
1 Department of Pharmacology, Faculty of Pharmacy, University of Pécs, Rókus u. 2, H-7624 Pécs, Hungary;
eszter.nyul@aok.pte.hu
2 Food Biotechnology Research Group, János Szentágothai Research Centre, University of Pécs, Ifjúságútja 20, H-7624 Pécs, Hungary
3 Department of Organic and Pharmacological Chemistry, Faculty of Pharmacy, University of Pécs, Szigetiút 12, H-7624 Pécs, Hungary; beata.lemli@aok.pte.hu (B.L.);
sandor.kunsagi-mate@aok.pte.hu (S.K.-M.)
4 Green Chemistry Research Group, János Szentágothai Research Centre, University of Pécs, Ifjúságútja 20, H-7624 Pécs, Hungary
* Correspondence: poor.miklos@pte.hu; Tel.: +36-72-501-500 (ext. 28316)
Abstract:Alternariol (AOH) is an emerging mycotoxin produced byAlternariamolds. It occurs as a contaminant e.g., in oilseeds, cereals, grapes, and tomatoes. Chronic exposure to AOH may cause genotoxic and endocrine disruptor effects. Our recent studies demonstrated that the fluorescence signal of AOH can be strongly affected by the environmental pH as well as by the presence of serum albumin or cyclodextrins. In the current study, we aimed to characterize the most optimal circumstances regarding the highly sensitive fluorescent detection of AOH.
Therefore, the further detailed investigation of the microenvironment on the fluorescence signal of the mycotoxin has been performed, including the effects of different buffers, organic solvents, detergents, and cations. Organic solvents (acetonitrile and methanol) caused only slight increase in the emission signal of AOH, while detergents (sodium dodecyl sulfate and Triton-X100) and Ca2+induced considerably higher enhancement in the fluorescence of the mycotoxin. In addition, Mg2+proved to be a superior fluorescence enhancer of the AOH. Spectroscopic and modeling studies suggest the formation of low-affinity AOH-Mg2+complexes. The effect of Mg2+was also tested in two HPLC assays: Our results show that Mg2+can considerably increase the fluorescence signal of AOH even in a chromatographic system.
Keywords: alternariol; mycotoxin; fluorescence; microenvironment; magnesium; fluorescence enhancers; high-performance liquid chromatography
1. Introduction
Alternariamolds commonly appear in cereals, oilseeds, tomatoes, citrus fruits, and grapes; they can produce several toxic secondary metabolites (including alternariol, al- ternariol monomethyl ether, tentoxin, tenuazonic acid, altenuene, and altertoxins) which can be classified as phyto- and mycotoxins [1]. Alternariol (AOH, Figure1) is a dibenzo- α-pyroneAlternariamycotoxin. Its acute toxicity is considered to be low compared to e.g. aflatoxin B1 or ochratoxin A [2–4]. However, the chronic exposure to AOH can cause mutagenic, genotoxic, immunotoxic, and/or endocrine disruptor effects [2,5]. Despite the fact that AOH is an emerging mycotoxin which raises increasing concerns regarding its health effects, no regulatory limits have been established on its maximal threshold concentrations in food, animal feed, and beverages [6,7]. The relative level of concern of AOH for human health was expressed by the European Food Safety Authority (EFSA) as threshold of toxicological concern, and its value for AOH is 2.5 ng/kg bodyweight [7].
Int. J. Mol. Sci.2021,22, 8692. https://doi.org/10.3390/ijms22168692 https://www.mdpi.com/journal/ijms
Int. J. Mol. Sci.2021,22, 8692 2 of 13
Nevertheless, the study of EFSA also indicated that the dietary exposure to this mycotoxin frequently exceeds the threshold suggested. Furthermore, there is still an urgent demand for the further data collection regarding the occurrence and toxicity of AOH as well as its metabolites for the proper risk assessment [8]. Since AOH exerts fluorescence, its molecular interactions can be successfully investigated and characterized employing fluorescence spectroscopy [9,10], and it can be quantified by HPLC-FLD (high-performance liquid chromatography coupled to fluorescence detector) technique [6,11]. Our recent studies demonstrated that the environmental pH can strongly affect the fluorescence spectra of AOH; in addition, serum albumin and cyclodextrins can considerably increase the fluores- cence signal of the mycotoxin [9,10]. These observations highlight that microenvironmental changes have high importance regarding the fluorescence detection of AOH.
Int. J. Mol. Sci. 2021, 22, x FOR PEER REVIEW 2 of 14
the study of EFSA also indicated that the dietary exposure to this mycotoxin frequently exceeds the threshold suggested. Furthermore, there is still an urgent demand for the fur- ther data collection regarding the occurrence and toxicity of AOH as well as its metabo- lites for the proper risk assessment [8]. Since AOH exerts fluorescence, its molecular in- teractions can be successfully investigated and characterized employing fluorescence spectroscopy [9,10], and it can be quantified by HPLC-FLD (high-performance liquid chromatography coupled to fluorescence detector) technique [6,11]. Our recent studies demonstrated that the environmental pH can strongly affect the fluorescence spectra of AOH; in addition, serum albumin and cyclodextrins can considerably increase the fluo- rescence signal of the mycotoxin [9,10]. These observations highlight that microenviron- mental changes have high importance regarding the fluorescence detection of AOH.
The microenvironment (e.g., the pH, ionic strength, polarity and viscosity of the sol- vent, detergents, or metal ions) can commonly influence the absorption and fluorescence spectra of optically active compounds, including certain mycotoxins [12]. Zearalenone and zearalenol can be detected with higher sensitivity with HPLC-FLD as a result of the post-column derivatization using aluminum chloride [13]. Furthermore, surfactants such as sodium dodecyl sulfate (SDS, Figure 1) and Triton-X100 (T-X100, Figure 1) effectively increased the emission signal of zearalenone [14]. In another study, T-X100 also strongly enhanced the fluorescence of aflatoxins (B1, B2, G1, and G2), allowing the development of a highly sensitive spectrofluorimetric method for their quantification from wheat sam- ples (after magnetic solid phase extraction) [15]. Complex formation with aluminum ion markedly increased the fluorescence of citrinin, while the emission intensity of another mycotoxin, ochratoxin A was only slightly affected under the same conditions [12]. Nev- ertheless, ochratoxin A forms complexes with other metal ions, including lithium, cal- cium, magnesium, and zinc [16,17]. Moreover, the addition of Mg2+ to the eluent caused a two-fold increase in the sensitivity of the HPLC-FLD method used, due to the magnesium- induced elevation in the emission signal of ochratoxin A [17].
In this study, we aimed to investigate the effects of microenvironmental changes on the fluorescence emission signal of AOH, which helps to understand which conditions favor the fluorescence detection of the mycotoxin. Therefore, the influence of environmen- tal pH, organic solvents, cations, and detergents has been examined. Our results demon- strate that magnesium ions can cause the highest increase in the emission signal of AOH, which is superior even vs. solvents and detergents tested. Modeling studies were also performed to characterize AOH-Mg2+ interaction. In addition, based on the strong fluo- rescence signal of the AOH-Mg2+ complex, two HPLC-FLD methods have been optimized and demonstrated, which highlights that magnesium can strongly increase the sensitivity of fluorescence based analytical detection of AOH.
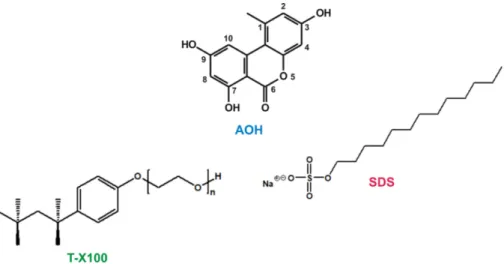
Figure 1. Chemical structures of alternariol (AOH), Triton-X100 (T-X100), and sodium dodecyl sul- fate (SDS).
Figure 1. Chemical structures of alternariol (AOH), Triton-X100 (T-X100), and sodium dodecyl sulfate (SDS).
The microenvironment (e.g., the pH, ionic strength, polarity and viscosity of the sol- vent, detergents, or metal ions) can commonly influence the absorption and fluorescence spectra of optically active compounds, including certain mycotoxins [12]. Zearalenone and zearalenol can be detected with higher sensitivity with HPLC-FLD as a result of the post-column derivatization using aluminum chloride [13]. Furthermore, surfactants such as sodium dodecyl sulfate (SDS, Figure1) and Triton-X100 (T-X100, Figure1) effectively increased the emission signal of zearalenone [14]. In another study, T-X100 also strongly enhanced the fluorescence of aflatoxins (B1, B2, G1, and G2), allowing the development of a highly sensitive spectrofluorimetric method for their quantification from wheat samples (af- ter magnetic solid phase extraction) [15]. Complex formation with aluminum ion markedly increased the fluorescence of citrinin, while the emission intensity of another mycotoxin, ochratoxin A was only slightly affected under the same conditions [12]. Nevertheless, ochratoxin A forms complexes with other metal ions, including lithium, calcium, magne- sium, and zinc [16,17]. Moreover, the addition of Mg2+to the eluent caused a two-fold increase in the sensitivity of the HPLC-FLD method used, due to the magnesium-induced elevation in the emission signal of ochratoxin A [17].
In this study, we aimed to investigate the effects of microenvironmental changes on the fluorescence emission signal of AOH, which helps to understand which conditions favor the fluorescence detection of the mycotoxin. Therefore, the influence of environmental pH, organic solvents, cations, and detergents has been examined. Our results demonstrate that magnesium ions can cause the highest increase in the emission signal of AOH, which is superior even vs. solvents and detergents tested. Modeling studies were also performed to characterize AOH-Mg2+interaction. In addition, based on the strong fluorescence signal of the AOH-Mg2+complex, two HPLC-FLD methods have been optimized and demonstrated,
Int. J. Mol. Sci.2021,22, 8692 3 of 13
which highlights that magnesium can strongly increase the sensitivity of fluorescence based analytical detection of AOH.
2. Results and Discussion
2.1. Effect of the Environmental pH on the Fluorescence Spectra of AOH
In our previous study, the excitation and emission spectra of AOH were recorded at pH 5.0, 7.4, and 10.0, showing that the ionization of the molecule strongly modifies its fluorescence [10]. In the current study, for the more detailed characterization regarding the influence of the pH, fluorescence spectra of AOH were tested at pH 2.0, 4.0, 6.0, 8.0, and 10.0.
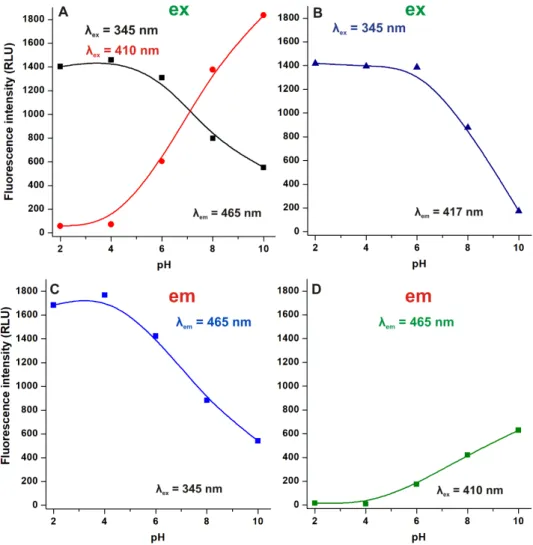
Using 465 nm emission wavelength: (1) an excitation peak can be noticed at 345 nm, its intensity is gradually decreasing with the elevation of the pH (above pH 4.0); (2) while at pH 6.0 a second excitation peak appears at 410 nm, which is increasing with the further elevation of the pH (Figure2A). However, applying 417 nm emission wavelength, we can notice a gradual decrease in the excitation signal at 345 nm above pH 6.0 (Figure2B). Based on our previous study [10], the excitation peak at 345 nm is presented by both non-ionized and ionized mycotoxin molecules, while the excitation peak at 410 nm belongs to the ionized form of AOH.
Int. J. Mol. Sci. 2021, 22, x FOR PEER REVIEW 4 of 14
Figure 2. Excitation (A and B: ex and em slits were 10 nm) and emission (C): ex and em slits were 10 nm; (D): ex and em slits were 5 nm and 10 nm, respectively) signals of AOH (25 μM) in sodium phosphate buffers (pH 2.0, 4.0, 6.0, 8.0, and 10.0; RLU: relative light unit).
2.2. Effects of Acetonitrile and Methanol on the Emission Signal of AOH
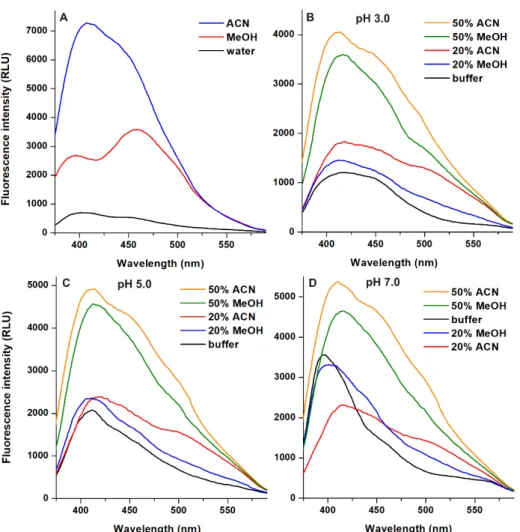
In reversed phase HPLC systems, typically acetonitrile and methanol are applied as organic eluent components, therefore, fluorescence emission spectra of AOH (λex = 345 nm) were recorded in water, methanol, and acetonitrile as well as in the binary mixtures of these organic solvents with aqueous buffers. AOH showed a wide emission peak in water (which can be composed of two peaks, likely belonging to the two tautomeric forms of nonionic AOH), as it has also been reported [10]. However, much higher emission sig- nals of the mycotoxin were noticed in acetonitrile and methanol, with the emission wave- length maxima at 405 and 455 nm, respectively (Figure 3A).
The effects of acetonitrile and methanol on the emission signal of AOH (λex = 345 nm) were also examined at pH 3.0, 5.0, and 7.0 (Figure 3). Only a slight increase in the fluores- cence of the mycotoxin was caused by 20 v/v% acetonitrile and methanol at pH 3.0 and 5.0, while these solvent concentrations decreased the emission signal at pH 7.0. However, the presence of 50 v/v% acetonitrile and methanol caused approximately 1.5- to 3-fold in- crease in the emission signal of AOH (Figure 3).
These data suggest that higher acetonitrile and methanol concentrations lead to the stronger fluorescence enhancement of AOH, and the aprotic solvent acetonitrile enhances the emission signal better compared to methanol. The stronger fluorescence of AOH in acetonitrile and methanol (vs. water) can be explained by the lower quenching effects of water molecules in the solvation shell [18,19], as it has also been demonstrated in the pres- ence of cyclodextrins [10].
Figure 2.Excitation ((A,B): ex and em slits were 10 nm) and emission (C): ex and em slits were 10 nm;
(D): ex and em slits were 5 nm and 10 nm, respectively signals of AOH (25µM) in sodium phosphate buffers (pH 2.0, 4.0, 6.0, 8.0, and 10.0; RLU: relative light unit).
When 345 nm excitation wavelength was applied, one dominant emission peak was observed at 465 nm, which gradually decreased above pH 4.0 (Figure 2C). However,
Int. J. Mol. Sci.2021,22, 8692 4 of 13
employing 410 nm excitation wavelength, an emission peak at 465 nm appeared only at pH 6.0 and increased with the further elevation of the pH (Figure2D). These observations are also in agreement with our previous study [10]: (1) the 345 nm excitation wavelength is suitable to excite both non-ionized and ionized AOH, nevertheless, the ionized form exerts lower fluorescence under these conditions; (2) the 410 nm excitation wavelength belongs to the ionic form(s) of AOH.
Since AOH shows emission signal in a wide pH range using 345 nm excitation, in the following experiments, we recorded the emission spectra of the mycotoxin using this wavelength. Furthermore, we applied acidic or neutral conditions because at higher pH, the deprotonation of the mycotoxin results in the appearance of several ionization forms and tautomers [10] which makes the interpretation of data extremely difficult.
2.2. Effects of Acetonitrile and Methanol on the Emission Signal of AOH
In reversed phase HPLC systems, typically acetonitrile and methanol are applied as organic eluent components, therefore, fluorescence emission spectra of AOH (λex= 345 nm) were recorded in water, methanol, and acetonitrile as well as in the binary mixtures of these organic solvents with aqueous buffers. AOH showed a wide emission peak in water (which can be composed of two peaks, likely belonging to the two tautomeric forms of nonionic AOH), as it has also been reported [10]. However, much higher emission signals of the mycotoxin were noticed in acetonitrile and methanol, with the emission wavelength maxima at 405 and 455 nm, respectively (Figure3A).
The effects of acetonitrile and methanol on the emission signal of AOH (λex= 345 nm) were also examined at pH 3.0, 5.0, and 7.0 (Figure3). Only a slight increase in the fluores- cence of the mycotoxin was caused by 20v/v% acetonitrile and methanol at pH 3.0 and 5.0, while these solvent concentrations decreased the emission signal at pH 7.0. However, the presence of 50v/v% acetonitrile and methanol caused approximately 1.5- to 3-fold increase in the emission signal of AOH (Figure3).
These data suggest that higher acetonitrile and methanol concentrations lead to the stronger fluorescence enhancement of AOH, and the aprotic solvent acetonitrile enhances the emission signal better compared to methanol. The stronger fluorescence of AOH in acetonitrile and methanol (vs. water) can be explained by the lower quenching effects of water molecules in the solvation shell [18,19], as it has also been demonstrated in the presence of cyclodextrins [10].
2.3. Effects of Detergents on the Emission Signal of AOH
Micellar encapsulation of fluorophores can result in fluorescence enhancement or quenching due to the formation of an altered microenvironment inside the micelles [14,20].
Therefore, in our following experiment, we investigated the interaction of AOH with surfactants at pH 3.0, 5.0, and 7.0. Emission spectra of the mycotoxin (5.0µM;λex= 345 nm) were recorded in the presence of sodium dodecyl sulfate (SDS; anionic detergent) and Triton-X100 (T-X100; nonionic detergent). Both SDS and T-X100 induced concentration dependent increase in the fluorescence of AOH, with two visible components of the emission spectra (Figure4). Same phenomenon was noticed previously in the presence of cyclodextrins [10]. Detergent-induced changes in the fluorescence intensity were similar at pH 3.0 and pH 5.0, while both SDS and T-X100 induced higher increase in the emission signal of AOH at pH 7.0 (Figure4). Regardless of the environmental pH, T-X100 proved to be a better fluorescence enhancer vs. SDS (T-X100: 7.7-fold at pH 3.0, 7.0-fold at pH 5.0, and 9.9-fold at pH 7.0; SDS: 4.9-fold at pH 3.0, 5.0-fold at pH 5.0, and 8.4-fold at pH 7.0). In accordance with the results regarding zearalenone-detergent interactions [14], the greater micelle size and the lower CMC (critical micelle concentration) value of T-X100 in aqueous solution can explain our observations. Furthermore, T-X100 also slightly increased the fluorescence of aflatoxins after their extraction from wheat samples [15].
Int. J. Mol. Sci.2021,22, 8692 5 of 13
Int. J. Mol. Sci. 2021, 22, x FOR PEER REVIEW 5 of 14
Figure 3. Emission spectra of AOH (25 μM) in pure solvents (A); ex slit: 5 nm, em slit: 10 nm) and in the presence of 20 or 50 v/v% organic solvents in sodium phosphate (B); 50 mM, pH 3.0; ex and em slits: 10 nm), sodium acetate (C); 50 mM, pH 5.0; ex and em slits: 10 nm), and Tris-HCl (D); 50 mM, pH 7.0; ex and em slits: 10 nm) buffers (λex = 345 nm; ACN, acetonitrile; MeOH, methanol;
RLU, relative light unit).
2.3. Effects of Detergents on the Emission Signal of AOH
Micellar encapsulation of fluorophores can result in fluorescence enhancement or quenching due to the formation of an altered microenvironment inside the micelles [14,20]. Therefore, in our following experiment, we investigated the interaction of AOH with surfactants at pH 3.0, 5.0, and 7.0. Emission spectra of the mycotoxin (5.0 μM; λex = 345 nm) were recorded in the presence of sodium dodecyl sulfate (SDS; anionic detergent) and Triton-X100 (T-X100; nonionic detergent). Both SDS and T-X100 induced concentra- tion dependent increase in the fluorescence of AOH, with two visible components of the emission spectra (Figure 4). Same phenomenon was noticed previously in the presence of cyclodextrins [10]. Detergent-induced changes in the fluorescence intensity were similar at pH 3.0 and pH 5.0, while both SDS and T-X100 induced higher increase in the emission signal of AOH at pH 7.0 (Figure 4). Regardless of the environmental pH, T-X100 proved to be a better fluorescence enhancer vs. SDS (T-X100: 7.7-fold at pH 3.0, 7.0-fold at pH 5.0, and 9.9-fold at pH 7.0; SDS: 4.9-fold at pH 3.0, 5.0-fold at pH 5.0, and 8.4-fold at pH 7.0).
In accordance with the results regarding zearalenone-detergent interactions [14], the greater micelle size and the lower CMC (critical micelle concentration) value of T-X100 in aqueous solution can explain our observations. Furthermore, T-X100 also slightly in- creased the fluorescence of aflatoxins after their extraction from wheat samples [15].
Figure 3.Emission spectra of AOH (25µM) in pure solvents ((A); ex slit: 5 nm, em slit: 10 nm) and in the presence of 20 or 50v/v% organic solvents in sodium phosphate ((B); 50 mM, pH 3.0; ex and em slits: 10 nm), sodium acetate ((C); 50 mM, pH 5.0; ex and em slits: 10 nm), and Tris-HCl ((D); 50 mM, pH 7.0; ex and em slits: 10 nm) buffers (λex= 345 nm; ACN, acetonitrile; MeOH, methanol; RLU, relative light unit).
2.4. Effects of Cations on the Emission Signal of AOH
Emission spectra of AOH were recorded (λex= 345 nm) in the presence of different cations, including alkali metal ions (Na+and K+), alkaline earth metal ions (Mg2+, Ca2+, and Ba2+), and transitional metal ions (Zn2+, Cu2+, and Fe2+) in Tris-HCl buffer (50 mM, pH 7.0). Na+, K+, Ba2+, Zn2+, Cu2+, and Fe2+did not affect or barely modified the emission spectra of the mycotoxin (data not shown). However, in a concentration-dependent fashion, Ca2+and Mg2+markedly increased the fluorescence signal of AOH (Figure5), suggesting the interaction of these cations with the mycotoxin. Ca2+(1000 mM) produced 12-fold while Mg2+(1000 mM) caused approximately 80-fold elevation in the emission intensity of the mycotoxin at 440 nm (emission wavelength maxima of the mycotoxin-cation complexes formed) (Figure5C).
Based on the fluorescence emission data (Figure5C), binding constants (K) of AOH- Ca2+and AOH-Mg2+complexes were determined employing the Hyperquad2006 software and the Benesi-Hildebrand equation. Table1demonstratesK(L/mol) values calculated using the two evaluations, showing that both complexes have low stability. Furthermore, Mg2+is not only a better fluorescence enhancer but it forms more (approximately four-fold) stable complex with AOH compared to Ca2+. Similar observations were published in an earlier study regarding the interactions of ochratoxin A with alkali and alkaline earth metal ions; however, ochratoxin A binds to these cations with much higher affinity [16].
Int. J. Mol. Sci.2021,22, 8692 6 of 13
Int. J. Mol. Sci. 2021, 22, x FOR PEER REVIEW 6 of 14
Figure 4. Fluorescence emission spectra of AOH (5 μM) in the presence of increasing concentrations of sodium dodecyl- sulfate (SDS; pH 3.0 (A), pH 5.0 (B), and pH 7.0 (C) and Triton-X100 (T-X100); pH 3.0 (D), pH 5.0 (E), and pH 7.0 (F). SDS- (G) and T-X100-induced (H) increase in the emission signal of AOH (λex = 345 nm, λem = 460 nm; ex and em slits: 10 nm;
buffers used: 50 mM pH 3.0 sodium phosphate, 50 mM pH 5.0 sodium acetate, and 50 mM pH 7.0 Tris-HCl; RLU: relative light unit).
2.4. Effects of Cations on the Emission Signal of AOH
Emission spectra of AOH were recorded (λex = 345 nm) in the presence of different cations, including alkali metal ions (Na+ and K+), alkaline earth metal ions (Mg2+, Ca2+, and Ba2+), and transitional metal ions (Zn2+, Cu2+, and Fe2+) in Tris-HCl buffer (50 mM, pH 7.0).
Na+, K+, Ba2+, Zn2+, Cu2+, and Fe2+ did not affect or barely modified the emission spectra of the mycotoxin (data not shown). However, in a concentration-dependent fashion, Ca2+
and Mg2+ markedly increased the fluorescence signal of AOH (Figure 5), suggesting the interaction of these cations with the mycotoxin. Ca2+ (1000 mM) produced 12-fold while Mg2+ (1000 mM) caused approximately 80-fold elevation in the emission intensity of the Figure 4.Fluorescence emission spectra of AOH (5µM) in the presence of increasing concentrations of sodium dodecyl- sulfate (SDS; pH 3.0 (A), pH 5.0 (B), and pH 7.0 (C) and Triton-X100 (T-X100); pH 3.0 (D), pH 5.0 (E), and pH 7.0 (F). SDS- (G) and T-X100-induced (H) increase in the emission signal of AOH (λex= 345 nm,λem= 460 nm; ex and em slits: 10 nm;
buffers used: 50 mM pH 3.0 sodium phosphate, 50 mM pH 5.0 sodium acetate, and 50 mM pH 7.0 Tris-HCl; RLU: relative light unit).
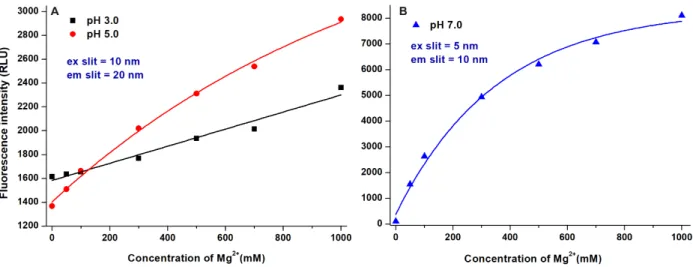
AOH-Mg2+interaction was further examined under acidic conditions (pH 3.0 and 5.0). Mg2+ caused concentration-dependent but moderate increase in the emission signal of AOH at pH 3.0 and pH 5.0 compared to the data observed at pH 7.0 (Figure6).
Interestingly, the further increase in the pH (pH 10.0 was tested; data not shown) caused lower fluorescence enhancement and binding constant than at pH 7.0, suggesting that Mg2+may prefer the monoanionic form of AOH. This hypothesis is also supported by modeling studies (see in Section2.5).
Int. J. Mol. Sci.2021,22, 8692 7 of 13
Int. J. Mol. Sci. 2021, 22, x FOR PEER REVIEW 7 of 14
mycotoxin at 440 nm (emission wavelength maxima of the mycotoxin-cation complexes formed) (Figure 5C).
Figure 5. Fluorescence emission spectra of AOH (5 μM) in the presence of increasing Ca2+ (A; ex and em slits: 10 nm) and Mg2+ (B; ex slit: 5 nm, em slit: 10 nm) concentrations in Tris-HCl buffer (50 mM, pH 7.0). Cation-induced relative increase in the emission signal of AOH (C; λex = 345 nm, λem = 440 nm; RLU: relative light unit).
Based on the fluorescence emission data (Figure 5C), binding constants (K) of AOH- Ca2+ and AOH-Mg2+ complexes were determined employing the Hyperquad2006 software and the Benesi-Hildebrand equation. Table 1 demonstrates K (L/mol) values calculated using the two evaluations, showing that both complexes have low stability. Furthermore, Mg2+ is not only a better fluorescence enhancer but it forms more (approximately four- fold) stable complex with AOH compared to Ca2+. Similar observations were published in an earlier study regarding the interactions of ochratoxin A with alkali and alkaline earth metal ions; however, ochratoxin A binds to these cations with much higher affinity [16].
Table 1. Binding constants (K) of AOH-cation complexes in Tris-HCl buffer (50 mM, pH 7.0).
Complex K (L/mol) ± SEM Hyperquad
K (L/mol) ± SEM Benesi-Hildebrand
AOH-Mg2+ 5.86 ± 0.62 4.11 ± 0.61
AOH-Ca2+ 1.49 ± 0.04 1.75 ± 0.03
AOH-Mg2+ interaction was further examined under acidic conditions (pH 3.0 and 5.0). Mg2+ caused concentration-dependent but moderate increase in the emission signal of AOH at pH 3.0 and pH 5.0 compared to the data observed at pH 7.0 (Figure 6). Inter- estingly, the further increase in the pH (pH 10.0 was tested; data not shown) caused lower fluorescence enhancement and binding constant than at pH 7.0, suggesting that Mg2+ may Figure 5.Fluorescence emission spectra of AOH (5µM) in the presence of increasing Ca2+((A); ex and em slits: 10 nm) and Mg2+((B); ex slit: 5 nm, em slit: 10 nm) concentrations in Tris-HCl buffer (50 mM, pH 7.0). Cation-induced relative increase in the emission signal of AOH ((C);λex= 345 nm, λem= 440 nm; RLU: relative light unit).
Table 1.Binding constants (K) of AOH-cation complexes in Tris-HCl buffer (50 mM, pH 7.0).
Complex K(L/mol)±SEM
Hyperquad
K(L/mol)±SEM Benesi-Hildebrand
AOH-Mg2+ 5.86±0.62 4.11±0.61
AOH-Ca2+ 1.49±0.04 1.75±0.03
The increase in the fluorescence signal of AOH in the presence of Ca2+ and Mg2+
can be explained by two mechanisms: (1) the nonradiative dissipation of the energy from the excited state is inhibited by the slower molecular motion of the more rigid structure (stabilized by the cation-molecule bonds); (2) the disruption of the hydration shell around the mycotoxin decreases the partial quenching effects of water molecules, resulting in the higher fluorescence of AOH-cation complexes. The former effect enhances the fluorescence quantum yield [21] while the latter impact reduces the quenching effects of water molecules on the aromatic fluorophore [22]. The latter phenomenon is supported by modeling studies: Mg2+ions show higher binding constants than Ca2+toward both the nonionic and monoanionic forms of AOH (Table2), which is associated with the extensive removal of water molecules from the hydration shell, and causing a larger enhancement in the emission intensity.
Int. J. Mol. Sci.2021,22, 8692 8 of 13
Int. J. Mol. Sci. 2021, 22, x FOR PEER REVIEW 8 of 14
prefer the monoanionic form of AOH. This hypothesis is also supported by modeling studies (see in 2.5).
The increase in the fluorescence signal of AOH in the presence of Ca2+ and Mg2+ can be explained by two mechanisms: (1) the nonradiative dissipation of the energy from the excited state is inhibited by the slower molecular motion of the more rigid structure (sta- bilized by the cation-molecule bonds); (2) the disruption of the hydration shell around the mycotoxin decreases the partial quenching effects of water molecules, resulting in the higher fluorescence of AOH-cation complexes. The former effect enhances the fluores- cence quantum yield [21] while the latter impact reduces the quenching effects of water molecules on the aromatic fluorophore [22]. The latter phenomenon is supported by mod- eling studies: Mg2+ ions show higher binding constants than Ca2+ toward both the nonionic and monoanionic forms of AOH (Table 2), which is associated with the extensive removal of water molecules from the hydration shell, and causing a larger enhancement in the emission intensity.
Figure 6. Effects of increasing Mg2+ concentrations on the fluorescence emission signal of AOH (5 μM) in sodium phos- phate (A; 50 mM, pH 3.0; ex slit: 10 nm, em slit: 20 nm), sodium acetate (A; 50 mM, pH 5.0; ex slit: 10 nm, em slit: 20 nm), and Tris-HCl (B; 50 mM, pH 7.0; ex slit: 5 nm, em slit: 10 nm) buffers (λex = 345 nm, λem = 440 nm; RLU: relative light unit).
Table 2. Binding constants (K) of AOH-cation complexes based on modeling studies.
AOH Interacting Ion K (L/mol)
nonionic Mg2+ 5.54
monoanionic Mg2+ 5.91
nonionic Ca2+ 1.80
monoanionic Ca2+ 4.80
2.5. Investigation of AOH-Mg2+ and AOH-Ca2+ Interactions Employing Molecular Modeling Studies
Interaction of the nonionic and monoanionic forms of AOH with Mg2+ and Ca2+ were examined in aqueous environment. Calculated binding constants of these complexes are demonstrated in Table 2. Our results suggest that AOH forms complexes with the selected cations (Figure 7). Higher K values were obtained for the AOH-Mg2+ compared to the AOH-Ca2+ complexes. Monoanionic AOH forms more stable complexes with the cations than the nonionic AOH, reflecting the involvement of Coulomb forces in the molecular interactions. Considering the aqueous environment and the weak interactions, competi- tive processes can occur between the hydration and the AOH-cation interactions. Typi- cally, the interacting molecules lose their hydration shell prior their primary interactions.
However, during the interaction of the nonionic form of AOH with Ca2+, the removal of the last water molecule from the hydration shell of Ca2+ requires higher energy than the Figure 6.Effects of increasing Mg2+concentrations on the fluorescence emission signal of AOH (5µM) in sodium phosphate ((A); 50 mM, pH 3.0; ex slit: 10 nm, em slit: 20 nm), sodium acetate ((A); 50 mM, pH 5.0; ex slit: 10 nm, em slit: 20 nm), and Tris-HCl ((B); 50 mM, pH 7.0; ex slit: 5 nm, em slit: 10 nm) buffers (λex= 345 nm,λem= 440 nm; RLU: relative light unit).
Table 2.Binding constants (K) of AOH-cation complexes based on modeling studies.
AOH Interacting Ion K(L/mol)
nonionic Mg2+ 5.54
monoanionic Mg2+ 5.91
nonionic Ca2+ 1.80
monoanionic Ca2+ 4.80
2.5. Investigation of AOH-Mg2+and AOH-Ca2+Interactions Employing Molecular Modeling Studies Interaction of the nonionic and monoanionic forms of AOH with Mg2+and Ca2+were examined in aqueous environment. Calculated binding constants of these complexes are demonstrated in Table2. Our results suggest that AOH forms complexes with the selected cations (Figure7). HigherKvalues were obtained for the AOH-Mg2+compared to the AOH-Ca2+complexes. Monoanionic AOH forms more stable complexes with the cations than the nonionic AOH, reflecting the involvement of Coulomb forces in the molecular interactions. Considering the aqueous environment and the weak interactions, competitive processes can occur between the hydration and the AOH-cation interactions. Typically, the interacting molecules lose their hydration shell prior their primary interactions. However, during the interaction of the nonionic form of AOH with Ca2+, the removal of the last water molecule from the hydration shell of Ca2+requires higher energy than the energy gain of the complex formation. Therefore, AOH-Ca2+complex will be formed through the microsolvation of Ca2+ion. Thus, the determinant forces of the complex formation are offered by hydrogen bonds, which are much weaker than the Coulomb forces appearing during the direct interaction of AOH molecules and the completely dehydrated Ca2+ions.
These observations are in agreement with a previous study which also demonstrated that higher hydration energy of Ca2+is observed when the hydration shell composed less than six water molecules compared to the hydration energy of the Mg2+[23].
Int. J. Mol. Sci.2021,22, 8692 9 of 13
Int. J. Mol. Sci. 2021, 22, x FOR PEER REVIEW 9 of 14
energy gain of the complex formation. Therefore, AOH-Ca2+ complex will be formed through the microsolvation of Ca2+ ion. Thus, the determinant forces of the complex for- mation are offered by hydrogen bonds, which are much weaker than the Coulomb forces appearing during the direct interaction of AOH molecules and the completely dehydrated Ca2+ ions. These observations are in agreement with a previous study which also demon- strated that higher hydration energy of Ca2+ is observed when the hydration shell com- posed less than six water molecules compared to the hydration energy of the Mg2+ [23].
Figure 7. Electrostatic potential map associated to the most stable equilibrium conformations of AOH-cation complexes: nonionic AOH-Mg2+ (A), monoanionic AOH-Mg2+ (B), nonionic AOH-Ca2+
(C), and monoanionic AOH-Ca2+ (D).
2.6. Probing the Analytical Application of AOH-Mg2+ Interaction to Increase the Sensitivity of HPLC-FLD Methods
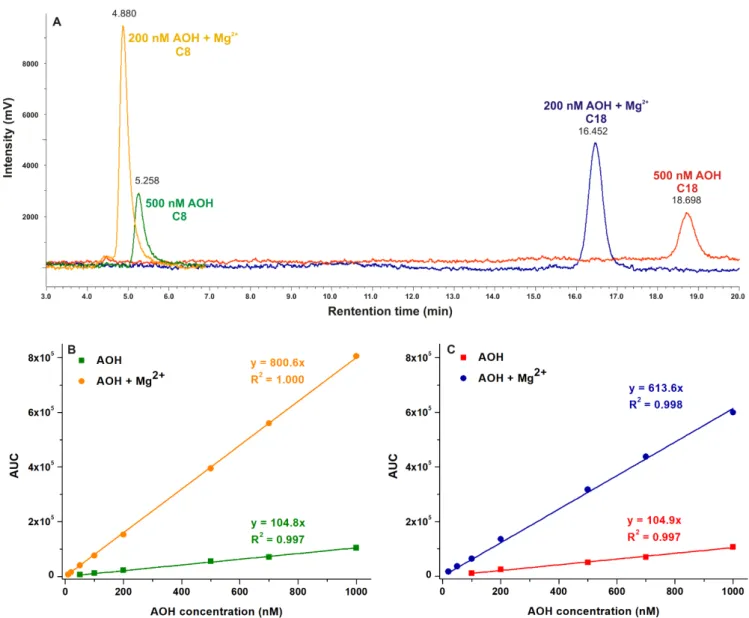
Based on the results of fluorescence spectroscopic studies, Mg2+ markedly increased the emission signal of AOH at pH 7.0 (Figure 6). Since the fluorescence enhancer effect of Mg2+ on AOH did not decrease even in the presence of 30% acetonitrile (data not shown), it was reasonable to hypothesize that AOH-Mg2+ interaction may be suitable to increase the sensitivity of HPLC-FLD methods. We applied two different (C8 and C18 types) ana- lytical columns for the evaluations, using the same eluent (10 mM pH 7.0 HEPES buffer and acetonitrile (70:30 v/v%), without or with 50 mM MgCl2) and conditions (see detailed in 3.4). In both methods tested, Mg2+ slightly shortened the retention time of the mycotoxin and considerably increased the height and the area of its chromatographic peaks (Figure 8). Mg2+ ions caused approximately six- to sevenfold signal amplification of AOH, without increasing the baseline noise. Each method (C8 and C18, with or without Mg2+) showed good linearity (R2 = 0.997 to 1.000) in the 0–1000 nM concentration range (Figure 8B,C).
Limit of detection (LOD) and limit of quantification (LOQ) data determined are demon- strated in Table 3. Intra-day repeatability was also examined for the Mg2+-sensitized meth- ods, it was 4.1% and 1.8% for the analyses performed using C8 and C18 columns, respec- tively.
Table 3. LOD and LOQ values of the HPLC-FLD methods applied, without and with 50 mM MgCl2 in the eluent.
LOD LOQ
Method nM μg/L nM μg/L
C8 without Mg2+ 50 12.9 100 25.8
C8 with Mg2+ 10 2.6 20 5.2
Figure 7. Electrostatic potential map associated to the most stable equilibrium conformations of AOH-cation complexes: nonionic AOH-Mg2+(A), monoanionic AOH-Mg2+(B), nonionic AOH-Ca2+
(C), and monoanionic AOH-Ca2+(D).
2.6. Probing the Analytical Application of AOH-Mg2+Interaction to Increase the Sensitivity of HPLC-FLD Methods
Based on the results of fluorescence spectroscopic studies, Mg2+ markedly in- creased the emission signal of AOH at pH 7.0 (Figure6). Since the fluorescence en- hancer effect of Mg2+on AOH did not decrease even in the presence of 30% acetonitrile (data not shown), it was reasonable to hypothesize that AOH-Mg2+interaction may be suitable to increase the sensitivity of HPLC-FLD methods. We applied two differ- ent (C8 and C18 types) analytical columns for the evaluations, using the same eluent (10 mM pH 7.0 HEPES buffer and acetonitrile (70:30v/v%), without or with 50 mM MgCl2) and conditions (see detailed in 3.4). In both methods tested, Mg2+ slightly shortened the retention time of the mycotoxin and considerably increased the height and the area of its chromatographic peaks (Figure8). Mg2+ions caused approximately six- to sevenfold signal amplification of AOH, without increasing the baseline noise.
Each method (C8 and C18, with or without Mg2+) showed good linearity (R2= 0.997 to 1.000) in the 0–1000 nM concentration range (Figure8B,C). Limit of detection (LOD) and limit of quantification (LOQ) data determined are demonstrated in Table3. Intra-day repeatability was also examined for the Mg2+-sensitized methods, it was 4.1% and 1.8%
for the analyses performed using C8 and C18 columns, respectively.
The analytical quantification ofAlternariatoxins, including AOH, can be performed employing various chromatographic techniques, such as thin layer chromatography, gas chromatography, HPLC, and liquid chromatography coupled with mass spectrometry [6].
The sensitivity of these methods highly depends on the sample matrix. The LOD and LOQ values of the recent (HPLC or LC-MS/MS) methods are typically in the range of 0.01–6.0 µg/kg and 0.03–12.0 µg/kg, respectively [6]. Our Mg2+-enhanced methods proved to be more sensitive than the HPLC-FLD method reported by Rico-Yuste et al.
(LOD = 7.0µg/kg, LOQ = 20.0µg/kg) [24]. In addition, the sensitivity of the Mg2+- enhanced C8 method is only slightly lower compared to certain LC-MS/MS methods previously reported regarding the measurement of AOH from wheat (LOD = 0.75µg/kg, LOQ = 2.5µg/kg) [25] and tomato-based products (LOD = 1.4µg/kg, LOQ = 3.5µg/kg) [26].
Therefore, the application of Mg2+seems to be a cost-effective tool to significantly increase the sensitivity regarding the fluorescence based analytical detection of AOH.
Int. J. Mol. Sci.2021,22, 8692 10 of 13
Int. J. Mol. Sci. 2021, 22, x FOR PEER REVIEW 10 of 14
C18 without Mg2+ 100 25.8 200 51.6
C18 with Mg2+ 20 5.2 50 12.9
Figure 8. Representative chromatograms of AOH without or with MgCl2 (50 mM) in the eluent (A). Linearity of the con- centration-AUC curves regarding the C8 (B) and C18 (C) methods.
The analytical quantification of Alternaria toxins, including AOH, can be performed employing various chromatographic techniques, such as thin layer chromatography, gas chromatography, HPLC, and liquid chromatography coupled with mass spectrometry [6].
The sensitivity of these methods highly depends on the sample matrix. The LOD and LOQ values of the recent (HPLC or LC-MS/MS) methods are typically in the range of 0.01–6.0 μg/kg and 0.03–12.0 μg/kg, respectively [6]. Our Mg2+-enhanced methods proved to be more sensitive than the HPLC-FLD method reported by Rico-Yuste et al. (LOD = 7.0 μg/kg, LOQ = 20.0 μg/kg) [24]. In addition, the sensitivity of the Mg2+-enhanced C8 method is only slightly lower compared to certain LC-MS/MS methods previously re- ported regarding the measurement of AOH from wheat (LOD = 0.75 μg/kg, LOQ = 2.5 μg/kg) [25] and tomato-based products (LOD = 1.4 μg/kg, LOQ = 3.5 μg/kg) [26]. There- fore, the application of Mg2+ seems to be a cost-effective tool to significantly increase the sensitivity regarding the fluorescence based analytical detection of AOH.
3. Materials and Methods
Figure 8. Representative chromatograms of AOH without or with MgCl2(50 mM) in the eluent (A). Linearity of the concentration-AUC curves regarding the C8 (B) and C18 (C) methods.
Table 3.LOD and LOQ values of the HPLC-FLD methods applied, without and with 50 mM MgCl2 in the eluent.
LOD LOQ
Method nM µg/L nM µg/L
C8 without Mg2+ 50 12.9 100 25.8
C8 with Mg2+ 10 2.6 20 5.2
C18 without Mg2+ 100 25.8 200 51.6
C18 with Mg2+ 20 5.2 50 12.9
3. Materials and Methods 3.1. Reagents
Alternariol (AOH) was purchased from Cfm Oskar Tropitzsch GmbH (Marktredwitz, Germany). 4-(2-hydroxyethyl)-1-piperazineethanesulfonic acid (HEPES) and Triton-X100 (T-X100) were obtained from Merck (Darmstadt, Germany). Sodium dodecyl sulfate (SDS), and tris(hydroxymethyl)-aminomethane (Tris) were purchased from Reanal (Budapest, Hungary). HPLC grade acetonitrile was obtained from VWR (Debrecen, Hungary). Stock
Int. J. Mol. Sci.2021,22, 8692 11 of 13
solution of AOH (5000µM) was prepared in dimethyl sulfoxide (DMSO, spectroscopic grade; Fluka, NJ, US) and stored at−20◦C, protected from light.
3.2. Fluorescence Spectroscopic Measurements
Fluorescence spectroscopic measurements were performed employing a Hitachi F-4500 spectrofluorimeter (Tokyo, Japan) at 25◦C, in the presence of air. Background correction was carried out in each experiment.
The effect of environmental pH on the spectroscopic properties of AOH was tested in 50 mM phosphate buffers (pH 2.0, 4.0, 6.0, 8.0, and 10.0), the pH was tuned by sodium hydroxide (1 M). Excitation spectra of the mycotoxin (20µM) were recorded employ- ing 417 and 465 nm emission wavelengths, while emission spectra were obtained using 345 and 410 nm excitation wavelengths.
We also examined the emission spectra of AOH in water, acetonitrile, and methanol as well as in the binary mixtures of methanol or acetonitrile with aqueous buffers. Emission spectra of AOH (25µM) were recorded in the presence of 0, 20, and 50v/v% methanol or acetonitrile in sodium phosphate (50 mM, pH 3.0), sodium acetate (50 mM, pH 5.0), and Tris-HCl (50 mM, pH 7.0) buffers (λex= 345 nm).
The effects of detergents on the emission signal of AOH were also tested employing SDS and T-X100. Samples contained AOH (5.0µM) and increasing concentrations of SDS (0.0, 0.5, 1.0, 2.0, 3.0, 5.0, 10.0, and 20.0 mM) or T-X100 (0.0, 0.2, 0.3, 0.4, 0.5, 1.0, 2.5, and 5.0 mM). Emission spectra were recorded using 345 nm excitation wavelength in sodium phosphate (50 mM, pH 3.0), sodium acetate (50 mM, pH 5.0), and Tris-HCl (50 mM, pH 7.0) buffers.
We tested the effects of different alkali and alkaline metal ions as well as transitional metal ions on the fluorescence signal of AOH: Increasing concentrations of Na+, K+, Ca2+, Mg2+, Ba2+, Zn2+, Fe2+, and Cu2+(0, 50, 100, 200, 300, 500, and 1000 mM) were added to AOH (5.0µM) in Tris-HCl buffer (50 mM, pH 7.0). Since Mg2+proved to be a potent fluo- rescence enhancer of the mycotoxin, AOH-Mg2+interaction was also examined at pH 3.0 (50 mM sodium phosphate buffer) and pH 5.0 (50 mM sodium acetate buffer). Emission spectra were recorded using 345 nm excitation wavelength. Binding constants of AOH- cation complexes were calculated employing non-linear fitting by the Hyperquad2006 software [27,28] as well as using the graphical application of the Benesi-Hildebrand equation [29,30].
Data presented are derived at least from three parallel, independent experiments.
SEM (standard error of the mean) values did not exceed 5.1%.
3.3. Modeling Studies
According to our previous work [10], the molecular modelling studies have been performed at semi-empirical level using HyperChem 8 code. However, considering the presence of Ca2+and Mg2+ions, PM3 method is applied for both the geometry optimization and the vibrational-rotational analysis to calculate the thermodynamic parameters of the molecular interactions. The aqueous environment was considered by the TIP3P method.
Both the enthalpy and entropy terms were calculated on the common way: the enthalpy change of the complex formation considered as the energy change calculated by subtracting the total energies of the reactants from the total energies of the products, while the entropy changes were calculated by subtracting the entropy terms of the reactants from the entropy terms of the products. Vibrational frequencies to calculate the vibrational entropy term are considered in harmonic approximation.
3.4. HPLC Analyses
The integrated HPLC system (Jasco, Tokyo, Japan) used contained an autosampler (AS-4050), a binary pump (PU-4180), and a fluorescence detector (FP-920). Chromato- graphic data were evaluated employing ChromNAV2 software (Jasco, Tokyo, Japan). The effects of Mg2+on the sensitivity regarding the HPLC-FLD analyses of AOH were tested
Int. J. Mol. Sci.2021,22, 8692 12 of 13
employing the following two methods. In the first HPLC method, a SecurityGuard guard column (C8, 4.0×3.0 mm; Phenomenex, Torrance, CA, USA) was linked to a Kinetex C8 (100×4.6 mm, 5µm; Phenomenex, Torrance, CA, USA) analytical column; while in the second method, a SecurityGuard guard column (C18, 4.0×3.0 mm; Phenomenex, Torrance, CA, US) was linked to a Gemini C18 (150×4.6 mm, 5µm; Phenomenex, Torrance, CA, US) chromatographic column. In both assays, the mobile phase consisted of HEPES buffer (10 mM, pH 7.0) and acetonitrile (70:30v/v%), without or with MgCl2(50 mM). The injected sample volumes were 20µL, the analyses were carried out at 1.0 mL/min flow rate and room temperature. AOH was detected at 455 nm emission wavelength (λex= 345 nm). The linearity was tested between 0 and 1000 nM mycotoxin concentrations. LOD and LOQ values were determined as the lowest concentrations where signal-to-noise ratios were 3 and 10, respectively. Intra-day repeatability was tested only for the Mg2+-sensitized methods (n= 7).
4. Conclusions
In summary, the effects of the microenvironment on the fluorescence properties of AOH have been examined. The environmental pH can strongly affect the excitation and emission spectra of the mycotoxin (Figure2). In acetonitrile and methanol, the emission signal of AOH is much higher (approximately ten- and fivefold, respectively) than in water;
however, in aqueous buffers, 20 and 50v/v% concentrations of these organic solvents caused only minor increases (Figure3). Detergents (20 mM of SDS and 5 mM of T-X100) caused approximately eight- to ten-fold increase in the fluorescence of AOH at pH 7.0 (Figure4). Similarly, Ca2+(1000 mM) induced a 12-fold elevation in the emission signal of the mycotoxin (Figure5). However, Mg2+forms more stable complexes with AOH than Ca2+(Tables1and2), and causes a major (80-fold) increase in the emission intensity of the mycotoxin at pH 7.0 (Figure6). Finally, we demonstrated that Mg2+is suitable for the sensitization of the analytical detection of AOH by HPLC-FLD methods (Figure8).
Author Contributions:Conceptualization, M.P.; formal analysis, B.L. and S.K.-M.; funding acquisi- tion, M.P.; investigation, E.F.-N., B.L., S.K.-M. and M.P.; methodology, E.F.-N. and M.P.;
writing—original draft, E.F.-N., S.K.-M. and M.P.; conceived the study, M.P.; wrote the paper, E.F.-N., M.P. and S.K.-M.; performed fluorescence spectroscopic studies and evaluations, E.F.-N. and B.L.;
carried out HPLC analyses, E.F.-N.; performed modeling studies, S.K.-M. All authors have read and agreed to the published version of the manuscript.
Funding: M.P. is thankful for support of the Hungarian National Research, Development and Innovation Office (FK125166). This project was supported by the János Bolyai Research Scholarship of the Hungarian Academy of Sciences (M.P.). S.K.-M. is thankful for the support of the European Union, co-financed by the European Social Fund (EFOP-3.6.1.-16-2016-00004).
Institutional Review Board Statement:Not applicable.
Informed Consent Statement:Not applicable.
Data Availability Statement:Not applicable.
Acknowledgments:The authors thank to Katalin Fábián for her excellent technical support.
Conflicts of Interest:The authors declare no conflict of interest. The funders had no role in the design of the study; in the collection, analyses, or interpretation of data; in the writing of the manuscript, or in the decision to publish the results.
References
1. Dall’Asta, C.; Cirlini, M.; Falavigna, C. Mycotoxins fromAlternaria: Toxicological implications.Adv. Mol. Toxicol.2014,8, 107–121.
[CrossRef]
2. Solhaug, A.; Eriksen, G.S.; Holme, J.A. Mechanisms of action and toxicity of the mycotoxin alternariol: A review. Basic Clin.
Pharmacol. Toxicol.2016,119, 533–539. [CrossRef]
3. Heussner, A.H.; Bingle, L.E.H. Comparative ochratoxin toxicity: A review of the available data. Toxins2015,7, 4253–4282.
[CrossRef]
Int. J. Mol. Sci.2021,22, 8692 13 of 13
4. McKean, C.; Tang, L.; Billam, M.; Tang, M.; Theodorakis, C.W.; Kendall, R.J.; Wang, J.-S. Comparative acute and combinative toxicity of aflatoxin B1 and T-2 toxin in animals and immortalized human cell lines.J. Appl. Toxicol.2006,26, 139–147. [CrossRef]
5. Fraeyman, S.; Croubels, S.; Devreese, M.; Antonissen, G. EmergingFusariumandAlternariamycotoxins: Occurrence, toxicity and toxicokinetics.Toxins2017,9, 228. [CrossRef]
6. ESFA. Scientific Opinion on the risks for animal and public health related to the presence ofAlternariatoxins in feed and food.
EFSA on Contaminants in the Food Chain (CONTAM).EFSA J.2011,9, 2407–2504. [CrossRef]
7. Arcella, D.; Eskola, M.; Ruiz, J.A.G. Dietary exposure assessment toAlternariatoxins in the European population.EFSA J.2016, 14, 4654. [CrossRef]
8. Aichinger, G.; Del Favero, G.; Warth, B.; Marko, D.Alternariatoxins—Still emerging?Compr. Rev. Food Sci. Food Saf.2021, 1–17.
[CrossRef]
9. Fliszár-Nyúl, E.; Lemli, B.; Kunsági-Máté, S.; Dellafiora, L.; Dall’Asta, C.; Cruciani, G.; Peth˝o, G.; Poór, M. Interaction of mycotoxin alternariol with serum albumin.Int. J. Mol. Sci.2019,20, 2352. [CrossRef]
10. Fliszár-Nyúl, E.; Lemli, B.; Kunsági-Máté, S.; Szente, L.; Poór, M. Interactions of mycotoxin alternariol with cyclodextrins and its removal from aqueous solution by beta-cyclodextrin bead polymer.Biomolecules2019,9, 428. [CrossRef]
11. Man, Y.; Liang, G.; Li, A.; Pan, L. Analytical methods for the determination ofAlternariamycotoxins.Chromatographia2017,80, 9–22. [CrossRef]
12. Keller, J.; Moldenhauer, D.; Byrne, L.; Haase, H.; Resch-Genger, U.; Koch, M. Complexes of the mycotoxins citrinin and ochratoxin a with aluminum ions and their spectroscopic properties.Toxins2018,10, 538. [CrossRef]
13. Hetmanski, M.T.; Scudamore, K.A. Detection of zearalenone in cereal extracts using high performance liquid chromatography with post-column derivatization.J. Chromatogr.1991,588, 41–52. [CrossRef]
14. Appell, M.; Bosma, W.B. Effect of surfactants on the spectrofluorimetric properties of zearalenone.J. Lumin.2011,131, 2330–2334.
[CrossRef]
15. Manafi, M.H.; Allahyari, M.; Pourghazi, K.; Amoli-Diva, M.; Taherimaslak, Z. Surfactant-enhanced spectrofluorimetric determina- tion of total aflatoxins from wheat samples after magnetic solid-phase extraction using modified Fe3O4 nanoparticles.Spectrochim.
Acta A Mol. Biomol. Spectrosc.2015,146, 43–49. [CrossRef] [PubMed]
16. Poór, M.; Kunsági-Máté, S.; Matisz, G.; Li, Y.; Czibulya, Z.; Peles-Lemli, B.; K˝oszegi, T. Interaction of alkali and alkaline earth ions with Ochratoxin, A.J. Lumin.2013,135, 276–280. [CrossRef]
17. Poór, M.; Kuzma, M.; Matisz, G.; Li, Y.; Perjési, P.; Kunsági-Máté, S.; K˝oszegi, T. Further Aspects of ochratoxin a-cation interactions:
Complex formation with zinc ions and a novel analytical application of ochratoxin a-magnesium interaction in the HPLC-FLD system.Toxins2014,6, 1295–1307. [CrossRef] [PubMed]
18. Rodríguez, E.M.R.; Alaejos, M.S.; Romero, C.D. Enhancement of the fluorescence intensity of Se-2,3-diaminonaphthalene complex in aqueous solution by adding organic solvents.Anal. Chim. Acta1996,334, 161–166. [CrossRef]
19. Dobretsov, G.E.; Syrejschikova, T.I.; Smolina, N.V. On mechanisms of fluorescence quenching by water. Biophysics2014,59, 183–188. [CrossRef]
20. Acharya, S.; Rebery, B. Fluorescence spectrometric study of eosin yellow dye-surfactant interactions.Arab. J. Chem.2009,2, 7–12.
[CrossRef]
21. Fery-Forgues, S.; Therese Le Bris, M.; Guette, J.P.; Valeur, B. Ion-responsive fluorescent compounds. 1. Effect of cation binding on photophysical properties of benzoxazinone derivative linked to monoaza-15-crown-5.J. Phys. Chem. 1988,92, 6233–6237.
[CrossRef]
22. Lakowicz, J.R.Principles of Fluorescence Spectroscopy, 3rd ed.; Springer: Baltimore, MD, USA, 2006. [CrossRef]
23. Rodriguez-Cruz, S.E.; Jockusch, R.A.; Williams, E.R. Hydration energies and structures of alkaline earth metal ions, M2+(H2O)n, n =5–7, M = Mg, Ca, Sr, and Ba.J. Am. Chem. Soc.1999,121, 8898–8906. [CrossRef] [PubMed]
24. Rico-Yuste, A.; Gómez-Arribas, L.N.; Pérez-Conde, M.C.; Urraca, J.L.; Moreno-Bondi, M.C. Rapid determination ofAlternaria mycotoxins in tomato samples by pressurised liquid extraction coupled to liquid chromatography with fluorescence detection.
Food Addit. Contam. Part A2018,35, 2175–2182. [CrossRef] [PubMed]
25. Jani´c Hajnal, E.; Orˇci´c, D.; Torbica, A.; Kos, J.; Mastilovi´c, J.; Škrinjar, M.Alternariatoxins in wheat from the autonomous Province of vojvodina, Serbia: A preliminary survey.Food Addit. Contam. Part A2015,32, 361–370. [CrossRef]
26. Rodríguez-Carrasco, Y.; Mañes, J.; Berrada, H.; Juan, C. Development and validation of a LC-ESI-MS/MS Method for the determination ofAlternariatoxins alternariol, alternariol methyl-ether and tentoxin in tomato and tomato-based products.Toxins 2016,8, 328. [CrossRef]
27. Gans, P.; Sabatini, A.; Vacca, A. Investigation of equilibria in solution. Determination of equilibrium constants with the HYPERQUAD suite of programs.Talanta1996,43, 1739–1753. [CrossRef]
28. Faisal, Z.; Lemli, B.; Szerencsés, D.; Kunsági-Máté, S.; Bálint, M.; Hetényi, C.; Kuzma, M.; Mayer, M.; Poór, M. Interactions of zearalenone and its reduced metabolitesα-zearalenol andβ-zearalenol with serum albumins: Species differences, binding sites, and thermodynamics.Mycotox. Res.2018,34, 269–278. [CrossRef]
29. Poór, M.; Matisz, G.; Kunsági-Máté, S.; Derdák, D.; Szente, L.; Lemli, B. Fluorescence spectroscopic investigation of the interaction of citrinin with native and chemically modified cyclodextrins.J. Lumin.2016,172, 23–28. [CrossRef]
30. Srinivasan, K.; Stalin, T.; Sivakumar, K. Spectral and electrochemical study of host–guest inclusion complex between 2,4- dinitrophenol andβ-cyclodextrin.Spectrochim. Acta A Mol. Biomol. Spectrosc.2012,94, 89–100. [CrossRef]