A Comprehensive Study of the Ca 2 + Ion Binding of Fluorescently Labelled BAPTA Analogues
Attila Csomos,
[a]Bence Kontra,
[a]Attila Jancsó,
[b]Gábor Galbács,
[b]Ruth Deme,
[c]Zoltán Kele,
[d]Balázs József Rózsa,
[e, f]Ervin Kovács,*
[a, g]and Zoltán Mucsi*
[a, h]In memory of Ferenc Fülöp.
Since its development, the ionophore BAPTA (1,2-bis(2-amino- phenoxy)-ethane-N,N,N’,N’-tetraacetic acid) has been used un- changed in calcium sensing applications. In this work we present a comprehensive experimental and theoretical study of novel alterations in the structure of BAPTA, with a focus on the systematic modification of the chain connecting the two aromatic rings of the molecule (denoted as “linker”). A bis- (diethylamino)xantene fluorophore was also attached to the structures in a fixed position and the structure-fluorescence response relationship of these molecules was investigated in addition. The effect of the linker’s length, the number of oxygen atoms in this chain and even the removal of one of the rings
was tested; these all proved to significantly alter the character- istics of the compounds. For example, it was found that the second aromatic ring of BAPTA is not essential for the turn-on of the fluorescence. We also demonstrated that successful sensing can be realized even by replacing the chain with a single oxygen atom, which suggests the availability of a new calcium binding mode of the chelator. The reliable turn-on characteristic, the steep Ca2+ fluorescence titration curve and the intense fluorescence emission combine to make this compound a prospective candidate as a calcium sensing molecular probe in diagnostic neurobiological applications.
Introduction
Calcium ions play an essential role in multiple physiological processes e.g in muscles, various organs, and parts of the nervous system. Examples include signal transduction, gene transcription and blood coagulation, among others.[1] Further- more, the omnipresence of Ca2+ ions has contributed substan- tially to the success of imaging over the last 40 years. Under- standing cellular processes by monitoring the presence of Ca2+ ions at the cellular level was made widely available by the introduction of the visually active ionophore 1,2-bis(2-amino- phenoxy)-ethane-N,N,N’,N’-tetraacetic acid (BAPTA, 1 a) in the pioneering work of Tsien et al.[2] Since then, a wide range of BAPTA derivatives were prepared and used in biological research.[3] Lately, with the spread of genetically encoded calcium indicators, the use and the development of small molecular probes were slightly relegated into the background.
Nevertheless, the latter have several advantages over the genetically encoded indicators as they offer a wider choice of Ca2+ affinity, display unique spectral properties and can even be used simultaneously.[3] These advantageous features allow highly customizable measurements to be executed. In addition to this, synthetic molecular probes are also suitable for subcellular Ca2+ imaging,[4] and recent studies also revealed possibilities for using them as MRI contrast agents[5,6] or therapeutic compounds.[7] In combination with microendoscopes,[8] fluorescent Ca2+ chelators also have a bright future in the fields of human diagnostics and therapy – which are applications where – the use of genetically encoded indicators is not a viable option. Despite their above high- lighted importance, the development of small Ca2+ sensors [a] A. Csomos, B. Kontra, Dr. E. Kovács, Dr. Z. Mucsi
Department of Chemistry, Femtonics Ltd.
1094 Budapest, Hungary E-mail: ervin.kovacs@femtonics.eu
zmucsi@femtonics.eu [b] Dr. A. Jancsó, Dr. G. Galbács
Department of Inorganic and Analytical Chemistry, University of Szeged
Szeged 6720, Hungary [c] Dr. R. Deme
Department of Organic Chemistry, Semmelweis University, Budapest H-1092, Hungary
[d] Dr. Z. Kele
Institute of Medical Chemistry, University of Szeged Szeged H-6720, Hungary
[e] Dr. B. J. Rózsa
Two-Photon Measurement Technology Research Group,
The Faculty of Information Technology, Pázmány Péter Catholic University Budapest 1083, Hungary
[f] Dr. B. J. Rózsa
Laboratory of 3D Functional Imaging of Neuronal Networks and Dendritic Integration,
Institute of Experimental Medicine Budapest, 1083, Hungary [g] Dr. E. Kovács
Polymer Chemistry Research Group, Research Centre for Natural Sciences Budapest, 1117, Hungary
[h] Dr. Z. Mucsi
Faculty of Materials Science and Engineering, University of Miskolc Miskolc 3515, Hungary
Supporting information for this article is available on the WWW under https://doi.org/10.1002/ejoc.202100948
Part of the Special Collection in memory of Ferenc Fülöp.
© 2021 The Authors. European Journal of Organic Chemistry published by Wiley-VCH GmbH. This is an open access article under the terms of the Creative Commons Attribution License, which permits use, distribution and reproduction in any medium, provided the original work is properly cited.
based on fluorescent chelators has received little attention lately.
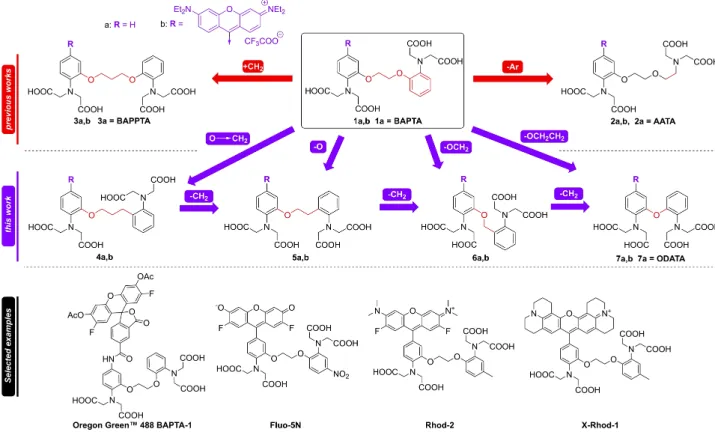
For the purpose of fluorescent Ca2+ imaging, the BAPTA (1 a) ionophore can be coupled to a wide range of fluorophores thereby producing a large number of different dyes (a few important examples shown in Figure 1, bottom) with potential uses in several applications.[9] In this work, we present our efforts to optimize the BAPTA ionophore scaffold for fluorescent Ca2+ imaging and to discuss the structure-activity relationship of the modifications on the chelating and spectrophysical properties of the complexes.
The substituent effects on the aromatic rings of BAPTA (1, Figure 1) were widely investigated earlier by Pethig and co- workers.[10] Kimura et al.[11] have measured the affinity of the ionophores towards Ca2+, which decreased radically with the enlargement of the binding pocket by extending the linker of the compound (e. g. 3 a, BAPPTA in Figure 1). Analogous molecular probes for Ca2+ detection by NMR, known as AATA (2 a in Figure 1) were also developed. In this case one of the aromatic rings was replaced with ethylene, combining the features of BAPTA and EGTA.[12] However, in none of these studies was the coupling of the ionophores to fluorophores accomplished. This motivated us to investigate the effects of the linker on the Ca2+ complexation and the fluorescence property in a comprehensive study.
This work discusses three known (1 a,2 a,3 a) and four novel chelating scaffolds (4 a–7 a) containing the same tetraethyl
rhodamine fluorophore (rosamine analogues, summarized in Figure 1 as 1 b–7 b). The tetraethyl rosamine fluorophore was selected because it exhibits better two-photon absorption than the tetramethyl variant (TAMRA) which is beneficial for further biological applications.[13,14] This set of modified fluorescent ionophores were subjected to a spectroscopic investigation combined with fluorescence-monitored Ca2+-titrations in order to study the details of their interaction with Ca2+ ions. In particular, the optimal length of the linker and the role of the oxygen atom with regards to Ca2+ affinity were studied along with the photophysical changes of the fluorescent dyes (4 b–
7 b). For comparative purpose, derivatives of the original and longer ionophore analogues (BAPTA and BAPPTA,1 band3 b) were also prepared and studied in the same way. The photo- physical characteristics of the fluorescent derivatives of AATA (2 b) were not reported in the literature earlier, therefore we investigated our novel construction as well.[15]This fluorophore unit lacks the possibility of regioisomer formation, and it is easily attachable to the scaffolds.[16]
In summary, our aim was the synthesis of seven novel compounds (1 b–7 b, Figure 1) to investigate the relationship between their structure and fluorescence properties induced by Ca2+binding.
Figure 1.Top: The concept of the present study. Systematic modification in of the BAPTA (1) structure using shorter linkers (4,5,6,7=ODATA), than the previously reported modifications (2) as well as a derivative with a single phenyl group (3, AATA). Bottom: a few selected examples of the available fluorescent dyes based on BAPTA.[9]
Results and discussion
Chemical Synthesis
Tetraethyl ester derivatives of BAPTA (1 a) and BAPPTA (3 a) were prepared as previously reported (see Scheme S1 in the supplementary information).[2,11] Tetraethyl ester of AATA was synthesized by a more productive way compared to the previous attempts (Scheme 1).[15] The original azide formation and reduction steps were replaced by N-alkylation of diethyl iminodiacetate using compound8, followed by a reduction and further alkylation, which produced the desired ester of AATA (11).
Preparation of the ester of 4 a was carried out from 2- nitrophenol by an alkylation followed by nitration, and reduc- tion (Scheme 2).
For the synthesis of the ionophore 5 a, the Mitsunobu reaction, a reduction and an alkylation step proved to be an effective route providing intermediate 17 with a good yield (Scheme 3).
For the preparation of 20, after the O-alkylation (18), PtO2
was applied to an effective catalyst[17] to avoid the unwanted benzylic cleavage instead of reduction. However, amine 19 is extremely sensitive to oxidation and was found to decompose at elevated temperatures during the alkylation. To avoid this, DMF solvent was used at a lower temperature (70°C). The desired product (20) formed with a moderate yield after 15 hours (Scheme 4).
The tetraethyl ester of oxydianylinyl N,N,N’,N’-tetraacetic acid (ODATA, 7 a) was prepared by employing a method reported in the literature (Scheme S2).[2,18]In the next synthetic step, the formyl group was introduced into one of the benzene rings of 11, 14, 17, 20–23, to allow the attachment of the rhodamine moiety to the molecule,[19] according to a well- described procedure (Scheme 5).[16]
Spectroscopic Characterization
Fluorescence spectra of each fluorescent Ca2+ chelating candidates (1 b–7 b) were recorded in samples containing the compounds in ac<1μM concentration and at pH=7.4 (MOPS buffer). Spectra were acquired in the absence as well as in the presence of Ca2+ ions the concentration of which was set to a high, but biologically relevant level (37μM) with a Ca2+-buffer, EGTA. Figure 2 shows that the shape and position of the fluorescence emission bands of these compounds are very similar, with significant differences present only in their intensities. All spectra recorded in the absence of metal ions reflect very weak emissions.
The intensity enhancements observed in the presence of Ca2+ions suggests that all compounds bind Ca2+ ions to some extent and that the binding is followed by a change in their photophysical properties. This turn on change can be explained by Ca2+ induced diminishing of the photoinduced electron Scheme 1.Preparation of the tetraethyl ester of AATA (11). a: 1.5 equiv.
K2CO3, DMF, 110°C, 2 h, b: 1.5 equiv. DIPEA, DMF, 110°C, 144 h, c: H2 (10 bar), 10 % Pd/C, EtOH, RT, 2 h. d: 6 equiv. Na2HPO4, 0.2 equiv. KI, MeCN, reflux, 10 h.
Scheme 2.Synthetic route to14. a: 2 equiv. K2CO3, DMF, 110°C, 2 h, b:
6 equiv. Na2HPO4, 0.2 equiv. KI, DMF, 90°C, 12 h.
Scheme 3.Synthetic route to the tetraethyl ester17. a: 1.1 equiv. PPh3, 1 equiv. DIAD, abs. THF, 0°C!RT, 1 h, recrystallisation, b: H2, 10 % Pd/C, RT, d: 6 equiv. BrCH2COOEt, 6 equiv. Na2HPO4, 0.2 equiv. KI, DMF, 12 h.
Scheme 4.Synthetic route to the tetraethyl ester of6 b. a: 1.2 equiv. NaH, DMF, RT!90°C, 6 h, b: 6 equiv. BrCH2COOEt, 6 equiv. Na2HPO4, 0.2 equiv. KI, DMF, 70°C, 15 h.
transfer (PET) mechanism operating otherwise in the metal ion free form of the molecules.[20] The observed fluorescence enhancement factors (FEF) are between ca. 3.5 and 120 (see Table 1). Although this confirms that all compounds show some
response to Ca2+, the increase in the fluorescence activity covers a broad range. The observed values reflect that none of these molecular probes are capable to overperform the BAPTA derivative (1 b). Out of the longer ionophore derivatives, AATA (2 b), BAPPTA (3 b) and 4 b, 2 b shows a notably larger fluorescence enhancement. The probes, based on a shorter ionophore design (5 b–7 b), display a rather mixed fluorescence response for Ca2+ ions. The observed fluorescence enhance- ments measured for 4 b, 5 b and 6 b are rather low (4 b) or modest (5 b,6 b). The compound containing only one oxygen as a linker (7 b) exhibits the second largest FEF, on par with2 b, only superseded by the original BAPTA-derivative (1 b).
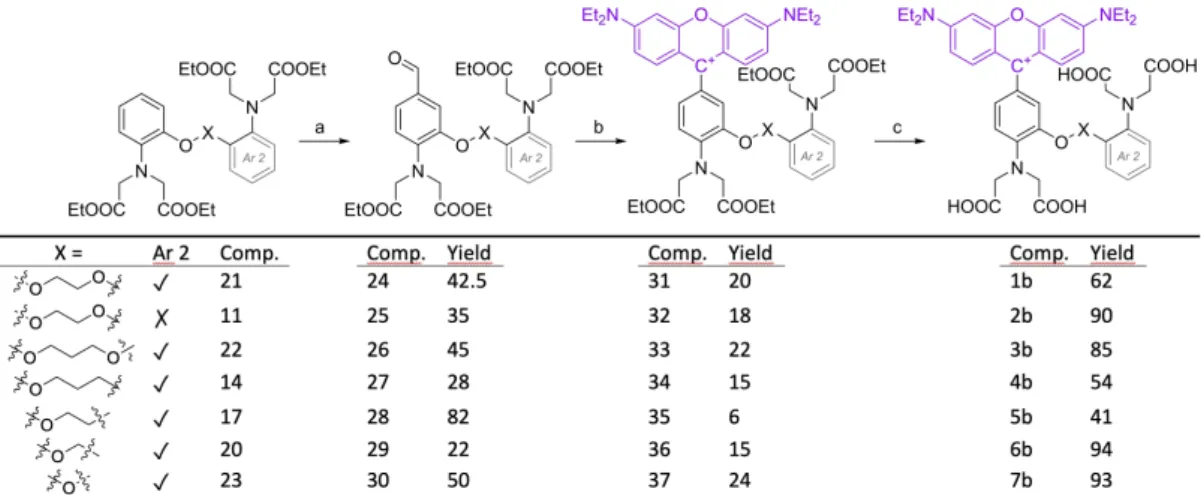
To gain a more detailed insight into the Ca2+ion promoted fluorescence response of the investigated compounds and about their affinity towards Ca2+ ions, Ca2+-titrations were performed with all seven candidate molecules by recording their fluorescence emission spectra in a series of solutions containing the studied compound in a constant concentration and Ca2+ ions in gradually increasing concentrations. The Ca2+ concentrations were adjusted following a widely used protocol using EGTA as a Ca2+-buffer, while the pH was kept at physiologically relevant value of 7.2 (MOPS) and the ionic strengths at 0.1 M (KCl).[21,22] The fluorescence intensity values Scheme 5.General synthetic route to achieve the desired fluorescent Ca2+molecular probes (1 b–7 b). a: 1.2 equiv. POCl3in DMF, 85°C, 3 h. b: 1) 2 equiv. 2- (diethylamino)phenol in propionic acid, 110°C, 4 h. 2) 0.95 equiv. chloranil in EtOH, RT, overnight, c: 8 equiv. aqueous NaOH 20 % in 5 ml EtOH, RT, 30 min.
Figure 2.Fluorescence spectra of the prepared compounds in solutions containing no Ca2+ions (dashed lines) and 37μM free Ca2+ions (continuous lines). Spectra were recorded at pH=7.4 (MOPS buffer) and normalized to 1.0μM concentrations of the compounds.
Table 1. Measured spectroscopic properties of the prepared compounds without Ca2+ion (and in the presence of Ca2+ion).[a]
λabs[nm] (Ca2+) ɛ[M 1× cm1] (Ca2+) Fmax/AU FEF[b] QY (Ca2+)[c] λem[nm] (Ca2+)[d] p[Ca2+][e]
1 b 555 (559) 8.49 × 10⁴(9.37 × 10⁴) 432 122 0.001 (0.113) 575 (578) 6.1
2 b 553 (559) 5.67 × 10⁴(5.91 × 10⁴) 273 93 0.001 (0.117) 575 (578) 5.8
3 b 554 (557) 7.22 × 10⁴(7.81 × 10⁴) 157 65 0.001 (0.052) 577 (578) 5.4
4 b 554 (554) 8.06 × 10⁴(8.46 × 10⁴) 5.4 3.5 <0.001 (0.001) 573 (577) !5[f]
5 b 554 (554) 7.51 × 10⁴(7.88 × 10⁴) 29.3 14 <0.001 (0.009) 577 (577) !5[f]
6 b 553 (554) 9.63 × 10⁴(1.04 × 10⁵) 65.9 10 0.002 (0.015) 578 (577) !5[f]
7 b 555 (561) 8.57 × 10⁴(8.85 × 10⁴) 281 32 0.002 (0.077) 581 (580) 5.7
[a] Data published here (pH=7.20 (MOPS);I=0.1 M KCl;T=25�0.1°C. Fluorescence intensities (Fmax) are normalized toc=1.0μM concentrations of the studied compounds. [b] Fluorescent enhancement factor: (Fmax–F0)/F0).F0andFmaxare the fluorescent intensity observed without (F0) and in the presence (Fmax) of Ca ion. [c] Fluorescence quantum yields (QY) were estimated based on the method described by Lakowicz[20][d] Wavelength of the intensity maximum of the emission bands in the absence and presence of Ca2+ions. [e] p[Ca2+] values at the half of the overall fluorescence intensity change observed in the Ca2+-titration procedure. [f] These values are below the experimental measurement limit and can be significantly smaller due to the assumed incomplete fluorescence change by the end of the titration process terminating at [Ca2+]=37μM.
observed at the maxima of the emission bands plotted against the concentration of Ca2+ ion at logarithmic scale produce classical fluorescence titration curves, as depicted in Figure 3.
The inflection points of such curves may provide a good estimation of the apparent dissociation constants of the complexes if the shape of the curve represents a simple one- step association process completed by the end of the titration protocol, such as that of the BAPTA-derivative (1 b).
The titration curves of 1 b, 2 b and 7 b clearly have a sigmoidal shape with saturating fluorescence intensities at the far end of the concentration scale, suggesting that the Ca2+ -binding event is completed within the concentration range of the titrations and that the compounds are characterized by Ca2+-binding affinities falling in the pK’d=5.6–6.2 range (Fig- ure 3). These values, including the p[Ca2+]=5.7 for the Ca2+ -binding step of 7 b (Table 1) are rather high and indicate remarkable Ca2+-sensitivities of these sensor candidates. The steeper and more distinguished increase in the curve of 7 b offers better usability in neurobiological applications, where the binary (active/inactive) signalling is preferred in contrast to the exact determination of the Ca2+concentration.
Interestingly, the observed fluorescence response steps are rather steep for many of the studied compounds suggesting differences in their Ca2+-binding mechanisms as compared to the BAPTA-based molecular probe. At the same time, titration curves of other compounds might indicate that the complex- ation process is not complete. Both are interesting phenomena that may initiate further investigations but are out of the scope of the present study. For the characterization of the Ca2+ -binding abilities of the investigated compounds we used the p[Ca2+] values at the inflection points (where relevant) or at the half of the overall fluorescence change observed by the end of the titration protocol (see the last column in Table 1).
Compound3 bdisplays an intense Ca2+-promoted response around p[Ca2+] ~ 5.3–5.4, however, the continuous increase of fluorescence even at the far end of the applied concentration range suggests a more complex metal ion binding mechanism.
The observed poor performance of 4 b, 5 b and 6 b suggests
that these compounds either possess weak affinity towards Ca2+, preventing to reach fluorescence saturation in the studied concentration range, or the PET quenching of the fluorophore moiety, induced by the attached ionophores, is not fully obstructed upon Ca2+-binding.
The main difference between 7 b (ODATA) and the other three novel analogues (4 b–6 b) is that both aromatic rings in 7 b are connected to an oxygen atom, just like in 1 b–3 b. In contrast, the second aromatic ring in4 b–6 bis connected to an aliphatic chain. It would seem rational that only the fluoro- phore-linked aromatic ring is responsible for the quenching of fluorescence in the absence of Ca2+ ions, and the fluorescence turns on when Ca2+ ions are coordinated. However, our data imply that the more distant ring also contributes to the quenching, which is not abolished if the potential Ca2+-binder, ring-connected oxygen atom is missing. The question, whether the weak fluorescence enhancement is the result of weak Ca2+ -binding or the inefficient induction of fluorescence via Ca2+ -coordination (via breaking down the internal PET) or both, cannot be unambiguously answered based on these results. It is possible that the fluorescence of these compounds may further increase at even higher Ca2+ concentrations, e. g. via a more complex metal binding scheme. Nevertheless, too low pKD
values are not relevant for the intended use of these molecular probes, i. e. in general biological applications.
Finally, we can draw the conclusion that the molecular probe based on the original BAPTA (1 b) has the highest and optimal affinity towards Ca2+ and the largest fluorescence enhancement factor via Ca2+-binding, however, it is closely followed by the new molecular probes2 band7 b.
Theoretical Studies
A study of the Ca2+ ion affinity of the prepared chelators (1 a–
7 a) at M06-2X/6-31G(d,p) level of theory is presented, aiming to shed light on the causes of the differences in the Ca2+ binding with regard to alterations in the structures. Previous computa- tional works have not addressed BAPTA-based chelators. Our study revealed that the optimal conformations of complex1 a- Ca2+ is different in solvents of different polarity. DFT structure optimalizationin vacuopredicted an asymmetrical, hexacoordi- nated structure for this complex, with a benefit in enthalpy as large as 14.4 kJ · mol 1(process shown in Figure 4) compared to the symmetrical (octacoordinated) arrangement. This hexacoor- dinated structure motivated the synthesis of new derivatives containing one linker O atom.
In other implicit solvent models presented in Figure 4, however, the preferred arrangement is the symmetrical and octacoordinated structure, which finally reaches a significant enthalpy benefit of 26.3 kJ · mol 1 in water as a solvent (Fig- ure 4). Using the symmetrical conformation as a reference, our hypothesis for the process shown in Figure 4 was investigated for water, MeCN, THF, benzene and heptane. An exponential relation between the relative stability of the asymmetrical complex and the dipole moment of the solvent was calculated (favouring the symmetric structure in polar solvents). This Figure 3.Titration curves representing the normalized fluorescence inten-
sities at the maxima of the emission bands of the studied compounds as a function of the free Ca2+concentrations, set by the Ca2+-buffer EGTA according to the protocol described previously.[21,22]
finding is in accordance with the experimental results showing a weaker binding ability of derivatives4 b–7 b.
In the next step, structural optimizations were carried out on the disodium (model for the non-complexed form) as well as monocalcium complexes of 1 a–7 a and EGTA separately, to avoid the change of the overall charges. Despite BAPTA (1 a) shares structural motifs with EGTA, their thermodynamic stability constants corresponding to Ca2+ binding have a difference of ca. four orders of magnitude (i. e. pKD, BAPTA=6.97
(T=22°C) versus pKD, EGTA=10.97 (T=20°C).[23] In order to approach the theoretical bases of this large deviation in pKDfor Ca2+-binding caused by the significant difference in the basicity of the two amino functions in the two ligands,[23]we compared the enthalpy difference (ΔΔH) of the Ca2+ binding of BAPTA and EGTA. According to quantum chemical calculations (Fig- ure 5, top), the enthalpy difference of complexation is 30.4 kJ mol 1 in favour of EGTA. This matches the expected value based on the reported difference of ΔpKD~ 4, which corresponds well to ca. 25 kJ · mol 1 Gibbs free energy and approximately 25 kJ · mol 1enthalpy difference at room temper- ature.
To highlight the structure-activity relationship for the Ca2+ -binding of BAPTA and EGTA, we split the overall enthalpy changes into different sub-effects caused by the various functionalities (A, B and C). First, the conformational change of the ethylene linkers was studied (A), which turns from all-trans (38 a and 38 b) to gauche (39 a and 39 b, Figure 5A) in the course of the complexation process, resulting only a negligible (ΔΔHA= 8.4+7.8 kJ · mol 1= 0.6 kJ · mol 1) difference in fa- vour of EGTA. Second, a larger difference was assigned to the hybrid state change of the coordinating nitrogen atom (B, Figure 5B). In the EGTA model (39 a), the nitrogen atom retains its pure sp3state (pyramidity ~ 333–335°) during the complex- ation. In contrast, the nitrogen atom in the BAPTA model (39 b) is in a mixed sp2–sp3state due to the strong conjugation with the benzene ring (pyramidity=344°), which transforms into an sp3 state during the metal ion binding, while the above- mentioned conjugation vanishes. The computation resulted in a ΔΔHB= 6.3 kJ · mol 1 energy benefit for the EGTA model, Figure 4.Solvent-dependent energy diagram of the binding process. The
absolute enthalpy of the octacoordinated complex was taken as a reference in all solvents and enthalpies of the hexacoordinate forms were compared to this, by the implicit solvent model at M062X/6-31G(d,p) level of theory.
Figure 5.Complexation process of calcium ion by EGTA in the presence of BAPTA. This process is modelled by the deconvolution of three main processes as A: conformational changes,B: nitrogen conjugation differences,C: electronic effects. The corresponding enthalpy values were calculated at M062X/6-31G(d,p) level of theory.
confirming that the effect of conjugation (B) is one of the major causes of EGTA being a stronger ionophore. Third, the effect of difference in the electronic environment of the N atom (C, Figure 5C, inset) was investigated as another potential reason behind the strength of EGTA. In the proposed reaction scheme the Ca2+-tetraqua-bis-dimethylaniline complex exchanges li- gands to form the Ca2+-tetraaqua-bis-trimethylamine complex.
The enthalpy difference of this process is highly endothermic (~~HC= 18.7 kJ · mol 1). By taking everything into account, the total enthalpy effects sum up toΣ~~H= 31.9 kJ · mol 1, which corresponds excellently to the value computed for the two Ca2+ complexes. In conclusion, we proved in silico, that the differ- ence between the complexation of BAPTA and EGTA can be explained by the characteristics of the aliphatic and aromatic N atoms, i. e. their different basicity. It was shown that an aliphatic N atom has a larger attraction to Ca2+, than an aromatic one. At pH=7.2, however, the competing protonation equilibrium decreases this difference and the conditional stabilities of the Ca2+-binding of EGTA and BAPTA are nearly identical at this pH.[23]
We estimated the enthalpy difference between the proto- nation of EGTA and BAPTA by model calculation (see SI, 35.0 kJ · mol 1) which indicates that EGTA can be protonated more easily than BAPTA (column B in Table 2). The analogous thermodynamic values (H and G), calculated for the Ca2+ -complexation of2 a–7 arelative to BAPTA, are listed in Table 2.
These were calculated according to the same equation. Most of the calculated enthalpies are in a good agreement with the experimental values, except for those of3 aand7 a.
Based on the similar equilibrium enthalpies in Table 2 for the Ca2+ complexation of EGTA and BAPTA it can be assumed that they possess the same coordination mode (8-coordination) and one aliphatic N atom of2 acan produce the same effect as two in1 a. However, the competing protonation process on the aliphatic N in EGTA decreases the overall pKDsimilar to that of BAPTA. Interestingly, the sign of the calculated entropy change is the opposite in these two cases (EGTA and 2 a). The computation for the compound bearing a longer linker (3 a) significantly underestimates the complexation enthalpy, com- pared to the experimental results. The predicted weak binding
of3 ato Ca2+could be due to the decrease of the coordination number to 7. In ourin silicomodel one of the etheric O atoms does not coordinate to Ca2+. Similarly, compounds4 a,5 aand 6 aalso lack the second O atom, and thus the largest possible coordination number for Ca2+ ion is 7, hence the relative enthalpies of the corresponding complexation processes are endothermic. Interestingly, the best fitting among4 a,5 aand 6 awas found for4 athat has the same linker length as BAPTA (Figure 6). For7 a, the calculated unbeneficial binding enthalpy and the corresponding ΔpKDvalues are in sharp contrast with the experimental observation, as this compound experimentally displayed efficient Ca2+ binding ability. To resolve this contra- diction, one can look for alternative binding possibilities.
Supposing a possible dimer complex formation proposed in Figure 6 resulted in a more beneficial enthalpy value (Table 2).
Conclusion
In this study, a systematic structural modification of the BAPTA ionophore was performed and seven new fluorescent BAPTA- analogues were successfully synthesized and subjected to spectrophysical characterization. The excitation and emission wavelength values in addition to the absorption and emission intensities were studied in the presence and absence of Ca2+ ions. The affinities of the compounds towards the desired analyte ion were characterized based on fluorescence-moni- tored Ca2+ titration data. Our structure-activity relationship results suggest that even a ring at greater distance is able to quench the fluorescence in the presence of Ca2+ ions if there are no oxygen atoms directly connected to this ring. A comprehensive computational study was executed to reveal further information regarding the role of the structure in the complexation process. The optimal structure of the complexes depends on the polarity of the applied solvent model continuum. In apolar solvents or vacuum, an asymmetric hexacoordinated form is preferred. On the other hand, in polar models, the symmetric octacoordinated arrangement becomes preferable. The structural analysis confirmed that the hybrid state and the electronic environment of the coordinating N
Table 2. Enthalpy (ΔHin kJ mol 1), Gibbs free energy (ΔGin kJ mol 1) and entropy (ΔSin kJ mol 1K1) values for the Ca2+complexation [A], protonation [B]
and their sum [A+B=C], of the aliphatic amine EGTA and2 a–7 arelative to BAPTA (1 a). The calculated pKDdata are compared to experimental values.
Coord.
number
Complexation [A]
Protonation at pH=7.4 [B]
Sum [A+B=C]
ΔpKD pKD p[Ca2+] ~ pKD
ΔHR ΔGR ΔSR ΔHP ΔGP ΔHR ΔGR theoretical theoretical experimental
1 a 8 0.0 0.0 0.0 0.0 0.0 0.0 0.0 0.0 6.1[a] 6.1
EGTA 8 30.4 24.4 19.9 35.0[b] 36.7[b] 4.6 0.2 0.1 6.2 6.7[c]
2 a 8 37.9 42.1 13.8 35.0[b] 36.7[b] 2.9 5.4 0.9 7.0 5.8
3 a 8 38.6 27.2 38.4 0.0[d] 0.0[d] 38.6 27.2 4.8 1.3 5.4
4 a 7 25.4 15.1 34.5 0.0[d] 0.0[d] 25.4 15.1 2.7 3.5 !5[e]
5 a 7 56.3 41.7 48.7 0.0[d] 0.0[d] 56.3 41.7 7.3 1.2 !5[e]
6 a 7 43.1 26.4 55.9 0.0[d] 0.0[d] 43.1 26.4 4.6 1.5 !5[e]
7 a 7 60.3 38.8 71.9 0.0[d] 0.0[d] 60.3 38.8 6.8 0.7 5.7
dimer[f] 0.1 19.9 66.5 0.0[d] 0.0[d] 0.1 4.9* 0.9 5.2
[a] Experimental value used as reference value; [b] According to model calculation, see SI; [c] Literature data; [d] Only anilinyl moiety, no difference in protonation to BAPTA (1 a); [e] Much below the current experimental measurement limit; [f] For7 a, two types of complex formation were considered, a mono complex and a dimer species, see Figure 6.
atom is responsible mainly for the difference in the affinity of EGTA and BAPTA towards Ca2+. In conclusion, an optimal chain length between the aromatic rings, an exact cavity volume and advantageous dynamic characteristics are present in BAPTA, which explains its effectiveness in calcium binding. These features are similarly present in the fluorescent derivative of AATA developed in this work. Moreover, the steep Ca2+ -induced fluorescence turn-on step observed for7 b(ODATA) is expected to be the most useful feature in neurobiological diagnostic applications in which the detection of cellular signals with a large contrast is demanded. According to the computa- tional results, we raise the possibility of the existence of a unique binding model, i. e., the formation of a dimeric complex, in this latter chelator. This study not only contributes to the clarification of why BAPTA currently performs so well in Ca2+ capture, but also opens up new possibilities for further structural optimizations that target specific sensing applica- tions.
Experimental Section
Reagents and solvents were purchased from Sigma Aldrich in reagent grade and used as received, while NMR solvents were purchased from Eurisotop. Thin layer chromatography (TLC) was performed on commercially available pre-coated TLC plates (Merck Silica gel 60 F254 aluminium sheets or Merck Aluminium oxide 60 F254 plates). Visualisation was either achieved under UV light at 254 nm or by exposing the plates to iodine or to the aqueous solution of (NH4)6Mo7O24, Ce(SO4)2 and sulphuric acid. Melting points were determined on a Büchi M-560 capillary melting point apparatus and are uncorrected. For flash column chromatography an Interchim PuriFlash XS 420 system was employed using gradient elution on normal phase (silica or aluminium oxide column;
hexane EtOAc or DCM/MeOH as eluents). Preparative HPLC was applied for purification in many cases using an Armen SPOT Prep II instrument with UV detector (200–600 nm scan) equipped with a Phenomenex Gemini C18, 250 × 50.00 mm; 10μm, 110 A column.
Gradient elution was employed using 0.4 g NH4HCO3in 1 L water (A) and acetonitrile (B) or 10 mL TFA in 1 L water (A) and acetonitrile (B) as eluent systems. NMR spectra were recorded on Varian Unity INOVA spectrometers operating at an equivalent 1H Figure 6.Optimized structures of the ionophores EGTA and1 a–7 ain the presence of Ca2+calculated at M062X/6-31G(d,p) level of theory. For7 a, two types of complex formation were considered, such as7 aand7 a-dimer, where the dimeric structure was modelled by one of the two Ca2+centers surrounded by the coordinating donor atoms from two ligands. C N and C O bond lengths are given in blue and red numbers (in Ångstrom units), respectively. For details, see Table S1 in the supporting information. Binding cavities are illustrated by orange clouds.
frequency of 400 and 500 MHz. Notations for the1H NMR spectral splitting patterns include singlet (s), doublet (d), triplet (t), broad (br) and multiplet/overlapping peaks (m). Chemical shifts of the resonances are given asδvalues in ppm and coupling constants (J) are expressed in Hertz. Individual resonances were assigned on the basis of DEPT 135, 1D (NOESY) and 2D NMR (COSY, HSQC and HMBC) experiments. HRMS spectra were recorded on a Q Exactive Plus hybrid quadrupole-orbitrap mass spectrometer (Thermo Scientific, Waltham, MA, USA) equipped with a heated electrospray ionization (HESI-II) probe that was used in positive and negative ion mode. Samples were introduced with FIA (flow injection analysis) method and the eluent stream (water and acetonitrile in a 1 : 1 volume ratio with 0.1 % formic acid) was provided by a Waters UPLC (Waters, Milford, USA).
UV/Vis absorption spectra were recorded were recorded on a Thermo Scientific Evolution 220 spectrometer in the wavelength range of 220–700 nm using a quartz cuvette (pathlength=5.0 cm).
The general sample preparation protocol involved the dissolution of 1–3 mg of the studied compounds in 10.0–15.0 mL of MOPS buffer (c=0.03 M, pH=7.2) that were diluted further to the concentrations used for the fluorescence Ca2+-titrations by ‘Buffer A’ or ‘Buffer B’ (typically tocdye<1.0μM). ‘Buffer A’ and ‘Buffer B’ are solutions containing the pH-buffer MOPS (c=0.03 M), KCl back- ground electrolyte (c=0.1 M) and the Ca2+-buffer EGTA (c= 0.01 M), adjusted to a pH value of 7.2. Besides these components,
‘Buffer B’ contains Ca2+ions (CaCl2) in a concentration identical to that of EGTA (c=0.01 M). These background-corrected spectra of the relevant buffers (‘Buffer A’ or ‘Buffer B’) were subtracted from the sample spectra. These background-corrected spectra were used for determining the wavelength of absorption maxima (λabs) and the absorbances normalized to 1.0 M concentrations of the dyes (ɛ).
Fluorescence emission spectra were acquired on a Hitachi F-4500 fluorescence spectrophotometer using a quartz cell (pathlength= 1.0 cm). Slit widths were selected to provide 2.5 nm bandpass both for the excitation and emission beams. Emission data were normalized to the intensity of an external reference probe body, recorded every day. Background emission spectra of the relevant buffers (‘Buffer A’ or ‘Buffer B’) were subtracted from the spectra of samples. Samples were excited at the wavelength values of their absorption maxima (λabs) determined during UV/fVis absorption measurements. Quantum yields were calculated by method pub- lished earlier.[20]
Fluorescence-monitored Ca2+-titrations were executed by using a solution of the selected dye molecule containing the Ca2+-buffer EGTA in a concentration of 0.01 M but no Ca2+ions. These starting solutions were made by the dilution of the stock solution of the dye into ‘Buffer A’. Another solution, containing the dye in the same concentration, was also prepared by using ‘Buffer B’. This latter solution contained the Ca2+-buffer EGTA and Ca2+ions at identical, 0.01 M concentration, setting the free Ca2+-level to 37μ M. For the measurement of the first (0) point of the titration curve 2.0 mL of the sample made with ‘Buffer A’ was used. In the titration process various (typically increasing) volume fractions of the sample were replaced by the same volumes of the solution made with
‘Buffer B’. Fine details of this fluorescence titration protocol have been described previously.[21,22]
Density-functional theory (DFT) computation was performed with the Gaussian 16 program package (G16),[24] using convergence criteria of 3.0 × 10 4, 4.5 × 10 4, 1.2 × 10³ and 1.8 × 10 3, for the gradients of the root mean square (RMS) force, maximum force, RMS displacement, and maximum displacement vectors, respec- tively. Computation was carried out at M062X/6 31G(d,p) level of theory.[25]The vibrational frequencies were computed at the same levels of theory, as used for geometry optimization, in order to properly confirm that all structures reside at minima on their
potential energy hypersurfaces (PESs). Thermodynamic functions, such as energy (U), enthalpy (H), Gibbs free energy (G), and entropy (S) were computed for 298.15 K, using the quantum chemical, rather than the conventional thermodynamic reference state.
Synthesis and characterization
General procedure 1 for reduction. The nitro compound was suspended in EtOH and 5 % of Pd/C (10 w/w % Pd in carbon) was added to the suspension. The mixture was flushed with argon in an autoclave, then filled with H2(10 bar pressure) and stirred overnight at room temperature. The suspension turned into yellow, it was filtered and concentrated in vacuo to yield the desired product, which was used in the next step without further purification.
General procedure 2 for N-alkylation. 27 mmol of the amino compound was dissolved in 20 ml MeCN, then Na2HPO4 (23 g, 162 mmol, 6 equiv.), KI (450 mg, 2.7 mmol, 0.1 equiv.) and 17.9 ml ethyl bromoacetate (27 g, 162 mmol, 6 equiv.) were added to the reaction mixture before stirring at 90°C for 10–18 hours. The complete conversion to the tetraalkyl derivative was assured and confirmed by HPLC-MS, since the removal of underalkylated derivatives is difficult. The solvent was removed under reduced pressure. The resulting solids were dissolved in 150 ml water and 100 ml EtOAc was added. The layers were separated, and the aqueous phase was washed with 2 × 100 ml EtOAc. The combined organic phases were washed with water, then with brine and dried over MgSO4. The solvent was removed under reduced pressure and the resulting oil was suspended in hexane, then cooled to 5°C. The pure product precipitated as brownish crystals. If the crystallization did not occur (11, 14), flash chromatography was used for purification on silica gel using a gradient elution (0 %!20 % EtOAc in hexane). For compound11, the quantity of ethyl bromoacetate and the base was halved.
General procedure 3for formylation.[19]2 mmol of the ethyl esters in 5 ml DMF were added to a cool (0°C) solution of POCl3
(1.1 mmol, 100μL, 1.1 equiv.) in 10 ml DMF. After stirring at room temperature for 2 hours, the mixture was neutralized by the addition of 10 w/w % aqueous solution of NaHCO3. The organic compounds were extracted with EtOAc, the organic layers were combined, and the solvent was removed under reduced pressure.
The product was purified using preparative HPLC.
General procedure 4for coupling to the fluorophore.[16]Formylated compound (1 mmol, ca. 500 mg) was dissolved in 5 ml propionic acid and 3-diethylaminophenol (363,5 mg, 2.2 mmol, 2.2 equiv.) was added to the mixture. This solution was stirred under micro- wave irradiation in a sealed tube at 80°C for 2–4 hours, then cooled to room temperature. A suspension of chloranil (233 mg, 0.95 mmol, 0.95 equiv.) in 5 ml DCM/EtOH 1 : 1 was added to the reaction mixture, and it was stirred at room temperature for overnight to promote the oxidative ring closure. The reaction mixture was concentrated and purified by preparative HPLC to afford the desired product.
General procedure 5for hydrolysis of the ethyl esters. Ethyl ester (0.1 mmol) was dissolved in 5 ml EtOH and 20 w/w% NaOH solution (200 mg, ca. 200μl, 1 mmol, 10 equiv.) was added to the solution and stirred for 20 minutes at room temperature. The reaction mixture was injected to preparative HPLC. The collected fractions were lyophilized to yield the desired final products.
Preparation of the fluorescent derivatives 1 b and 3 b (See Figure S1 in Supplementary Information)
The synthesis of BAPTA ethyl ester (21) and BAPPTA ethyl ester (22) were carried out following the procedure described in references[2,11] with minor modifications. K2CO3 (7.3 g, 53 mmol, 1.5 equiv.) was suspended in 40 ml DMF and a solution of 2- nitrophenol (4.9 g, 35.3 mmol, 1.0 equiv.) in 10 ml DMF was added under stirring. To this red solution 8.8 ml (15.2 g, 106.5 mmol, 3.0 equiv.) of 1-bromo-2-chloroethane was added in the case of BAPTA ethyl ester (21), while 9.8 ml (16.8 g, 106.5 mmol, 3 equiv.) of 1-bromo-2-chloropropane in the case of BAPPTA ethyl ester (22).
880 mg (5.3 mmol, 0.1 equiv.) of KI was added to each mixture and the solutions were stirred at 90°C for 3 hours, then the solvents were removed under reduced pressure and the solid residues were dissolved in EtOAc and extracted with saturated Na2CO3, then with brine. The organic phase fractions were dried over MgSO4, then the solvent was removed under reduced pressure. The resulting brown oil was dissolved in 30 ml DMF containing 7.3 g of suspended K2CO3(53 mmol, 1.5 equiv.). 880 mg (5.3 mmol, 0.1 equiv.) of KI and 4.9 g 2-nitrophenol (35.3 mmol, 1 equiv.) was added and the mixture was stirred at 110°C for 2 hours. The brownish mixture was poured on crushed ice. The white precipitate was filtered from the orange mother liqueur and washed with water, then dried over- night. Carrying out the reaction in two steps resulted in higher product purity. The products 1,2-bis(2-nitrophenoxy)ethane (S2) (beige powder, yield: 9.66 g, 90 %, melting point: 158°C, ref 167°C), and 1,2-bis(2-nitrophenoxy)propane (S5) (beige powder, yield:
14.4 g, 90 %, melting point: 108°C, ref 106°C) were used without further purification.
Hydrogenations were carried out under pressure (10 bar), com- pared to the previous methods,[2] using general procedure 1.
described in S3.1.1.starting from the quantities from the quantity given above. The products 1,2-bis(2-aminophenoxy)ethane (S3) (yield: 7.13 g, 92 %) and 1,2-bis(2-aminophenoxy)propane (S6) (yield: 10.72 g, 94 %) were isolated as yellow oils.
Alkylations were performed based ongeneral procedure 2, starting from 6.58 g and 6.96 g of amine. The Ethyl ester products21(yield:
14.45 g, 91 %, melting point: 99°C, ref 95–97°C) and 22 (yield:
14.62 g, 90 %, melting point: 77°C, ref 76°C) were isolated as brown crystals. The spectroscopic properties of all above compounds are in agreement with previously published data.[2,11]
The formylations were performed according togeneral procedure 3 from 1 mmol of starting materials. The aldehyde compounds 24 (yield: 262 mg, 42.5 %, melting point: 109°C; ref 139°C.) and 26 (yield: 296 mg, 47 %, melting point: 83°C.) were isolated as brown solids. The spectroscopic properties of compound 24 are in agreement with data previously reported.[19] The spectroscopic properties of compound 26: 1H NMR (400 MHz, [D6]DMSO)δ=(s, 1H, C[32] H), 7.39 (dd,J=8.2, 1.8 Hz, 1H, C[3] H), 7.33 (d,J=1.9 Hz, 1H, C[5] H), 6.89 (dd,J=7.8, 1.9 Hz, 1H, C[14] H), 6.85–6.76 (dt,J=
14.9, 7.3, 1.8 Hz, 2H, C[12–13] H), 6.71–6.65 (m, 2H, C[2, 11] H), 4.19 (s, 4H, C[16–17] H), 4.12–4.02 (m, 16H, C[7,9,18–19,20–23] H), 2.05 (t,J=6.2 Hz, 2H, C[8] H), 1.15 (dt,J=14.1, 7.1 Hz, 12H, C[24–
27] H).13C {1H} NMR (101 MHz, [D6]DMSO)δ=190.7, 170.8, 170.3, 149.7, 148.7, 144.5, 138.7, 128.8, 125.5, 121.3, 120.8, 118.1, 115.9, 113.2, 111.4, 65.5, 65.1, 60.4, 60.1, 53.7, 53.3, 28.5, 14.1. HRMS (ESI +): m/z calcd for C32H43N2O11+ ([M+H]+): 631.28614, found:
631.28611.
The couplings to the fluorophores were carried out using the general procedure 4using the quantities given above. The tetraethyl ester compounds 31(yield: 119 mg, 20 %, melting point: decom- posed) and 33(yield: 205 mg, 22 %, melting point: decomposed) were isolated as red powders.
The spectroscopic properties of compound31:1H NMR (400 MHz, [D6]DMSO)δ=7.46 (d, J=9.6 Hz, 2H, C[33, 42] H), 7.16–7.09 (m, 3H, C[5, 34, 41] H), 7.03 (dd, J=8.2, 1.9 Hz, 1H, C[3] H), 6.94 (dd, J= 15.3, 2.2 Hz, 3H, C[13, 36, 39] H), 6.89–6.81 (m, 3H, C[2, 11–12] H), 6.68 (dd, J=7.3, 2.3 Hz, 1H, C[10] H), 4.26–4.13 (m, 8H, C[7–8, 15–
16] H), 4.06 (s, 4H, C[17–18] H), 3.96 (dq, J=21.7, 7.1 Hz, 8H, C[44–
47] H), 3.67 (s, 8H, C[19–22] H), 1.21 (t, J=7.0 Hz, 12H, C[48–
51] H), 1.06 (td, J=7.1, 5.3 Hz, 12H, C[23–26] H). 13C {1H} NMR (101 MHz, [D6]DMSO) δ=170.8, 170.7, 157.4, 156.8, 154.9, 149.5, 148.8, 140.7, 138.8, 132.0, 123.4, 123.3, 121.3, 121.1, 117.9, 116.9, 114.8, 114.2, 113.1, 112.6, 96.0, 67.5, 66.8, 60.4, 60.1, 53.3, 53.1, 45.3, 13.9, 13.9, 12.5. HRMS (ESI+): m/z calcd for C51H65N4O11+ ([M]+):
909.46444, found: 909.46217.
The spectroscopic properties of compound33:1H NMR (400 MHz, [D6]DMSO)δ=7.48 (d, J=9.6 Hz, 2H, C[24, 43] H), 7.16–7.05 (m, 3H, C[5, 35, 42] H), 6.97 (dd, J=19.3, 5.2 Hz, 3H, C[2, 37, 40] H), 6.89–
6.83 (m, 2H, C[3, 14] H), 6.77 (dt, J=13.9, 7.0 Hz, 2H, C[12, 13] H), 6.61 (dd, J=7.6, 2.1 Hz, 1H, C[11] H), 4.23 (s, 4H, C[16–17] H), 4.18–
3.93 (m, 16H, C[7, 9, 18–19, 20–23] H), 3.64 (d, J=7.1 Hz, 8H, C[45–
48] H), 2.05 (p, J=6.2 Hz, 2H, C[8] H), 1.21 (td, J=7.0, 4.4 Hz, 18H, C[24–25, 49–52] H), 1.09 (t, J=7.1 Hz, 6H, C[26–27] H). 13C {1H}
NMR (101 MHz, [D6]DMSO) δ=170.9, 170.7, 158.2, 157.9, 157.4, 156.8, 154.9, 149.5, 148.8, 140.6, 138.6, 132.1, 123.3, 121.3, 120.8, 117.9, 114.7, 114.2, 113.0, 112.5, 104.6, 96.0, 65.7, 60.4, 60.1, 53.5, 53.2, 45.3, 28.6, 14.2, 14.1, 12.5. HRMS (ESI+): m/z calcd for C52H67N4O11+([M]+): 923.48009, found: 923.47866.
The hydrolysis of the ethyl esters were carried out using thegeneral procedure 5.using the quantities given above. The fluorescent dyes 1 b (red powder, yield: 38 mg, 62 %, melting point: decomposed at>110°C.) and3 b(yield: 52 mg, 85 %, melting point: decomposed at 116°C.) were isolated as red powders. The spectroscopic proper- ties of compound1 b:1H NMR (400 MHz, [D6]DMSO)δ=12.55 (bs, 4H, C[19–22]OO H), 7.50 (d, J=8.2 Hz, 2H, C[25, 34] H), 7.19 (d, J= 1.9 Hz, 1H, C[5] H), 7.16 (dd, J=8.2, 2.2 Hz, 2H, C[26, 33] H), 7.11–
6.72 (m, 8H, C[2, 3, 10–13, 28, 31] H), 4.31 (t, J=7.0 Hz, 4H, C[7, 8] H), 4.24 (s, 4H, C[15–16] H), 4.02 (s, 4H, C[17–18] H), 3.96 (q, J= 7.1 Hz, 8H, C[36–39] H), 1.20 (t, 12H, J=7.0 Hz, C[19–22] H). 13C {1H} NMR (101 MHz, [D6]DMSO)δ=172.5, 172.3, 157.4, 156.7, 154.9, 149.4, 148.4, 141.3, 139.3, 132.2, 123.9, 122.8, 121.5, 121.1, 118.2, 116.8. 116.1, 114.8, 114.2, 112.5. 96.0, 67.5, 67.0, 53.7, 53.5, 45.3, 12.5. HRMS (ESI+): m/z calcd for C43H49N4O11+ ([M]+): 797.33923, found: 797.33812.
The spectroscopic properties of compound3 b:1H NMR (400 MHz, [D6]DMSO)δ=12.55 (s, 4H, C[20–23]OO H), 7.49 (d, J=9.6 Hz, 2H, C[26, 35] H), 7.11 (dd, J=9.6, 2.5 Hz, 2H, C[27, 34] H), 7.06 (d, J= 2.0 Hz, 1H, C[5] H), 7.00 (dd, J=8.2, 1.9 Hz, 1H, C[3] H), 6.94 (d, J= 2.5 Hz, 2H, C[29, 32] H), 6.91–6.86 (dd, J=9.6, 2.5 Hz, 1H, C[14] H), 6.83 (d, J=8.3 Hz, 1H, C[2] H), 6.76 (dt, J=7.1, 6.4, 3.6 Hz, 2H, C[12–
13] H), 6.66–6.59 (m, 1H, C[11] H), 4.16 (s, 4H, C[16–17] H), 4.11 (t, J=6.4 Hz, 2H, C[9] H), 4.07 (t, J=5.9 Hz, 2H, C[7] H), 3.92 (s, 4H, C[18–19] H), 3.64 (q, J=7.0 Hz, 8H, C[37–40] H), 2.19–2.10 (m, 2H, C[8] H), 1.21 (t, J=7.0 Hz, 12H, C[41–44] H). 13C {1H} NMR (101 MHz, [D6]DMSO) δ=172.6, 172.3, 157.4, 156.8, 154.8, 149.5, 148.7, 141.0, 138.9, 132.1, 123.4, 122.8, 120.9, 120.7, 117.5, 116.4, 114.7, 114.2, 113.0, 112.4, 95.9, 65.7, 64.9, 53.6, 53.4, 45.2, 28.7, 12.5.
HRMS (ESI+):m/zcalcd for C44H51N4O11+ ([M]+): 811.35488, found:
811.35354.
Preparation of the fluorescent dye 2 b. (See Figure S2 in Supple- mentary Information)2-nitrophenol (10 g, 72 mmol, 1.0 equiv.) was dissolved in DMF (150 ml), then K2CO3 (14.9 g, 108 mmol, 1.5 equiv.), and KI (1.19 g, 7.2 mmol, 0.1 equiv.) were added. The mixture was stirred at 110°C, 2-chloroethyl ether (30.8 g, 25.3 ml, 216 mmol, 3.0 equiv.) was added and stirred for 2 hours at 110°C.
The solvents were removed under reduced pressure and the solid
residue was dissolved in EtOAc and water. The layers were separated, the organic phase was extracted with saturated aqueous Na2CO3and brine. The mixture was dried over MgSO4, the solvent was removed under reduced pressure. Mononitro compound 8 (brown oil, yield: 21.7 g, 92 %) was used in the next step without further purification. The spectroscopic properties of8are in good agreement with those published previously.[26]
11.5 g (37.5 mmol, 1.0 equiv.) of8was dissolved in 100 ml DMF and 10.1 g DIPEA (77.9 mmol, 13.6 ml, 2.0 equiv.). 12. 8 g diethyl iminodiacetate (67.5 mmol, 12.1 ml, 1.8 equiv.) was added and the mixture was stirred at 120°C for 2 days. Additional 7.09 g (37.5 mmol, 6. 7 ml, 1.0 equiv.) diethyl iminodiacetate and 2 g (12 mmol, 0,32 equiv.) of KI were added, then stirred for 4 days. The solvents were removed under reduced pressure, the solid residue was dissolved in EtOAc and the mixture was extracted with saturated aqueous Na2CO3, then with brine. The organic phase was dried over MgSO4, then the solvent was removed under reduced pressure. Product9was isolated as a brown oil (yield: 21.8 g, 80 %).
1H NMR (400 MHz, [D6]DMSO) δ=7.86 (dd, J=8.1, 1.7 Hz, 1H, C[2] H), 7.64 (ddd,J=8.8, 7.4, 1.7 Hz, 1H, C[3] H), 7.37 (dd,J=8.6, 1.1 Hz, 1H, C[5] H), 7.12 (dt,J=8.3, 7.4, 1.1 Hz, 1H, C[4] H), 4.26 (t, J=5.2 Hz, 2H, C[7] H), 4.08 (q,J=7.1 Hz, 4H, C[13–14] H), 3.80 (s, 4H, C[11–12] H), 3.76 (t,J=5.2 Hz, 2H, C[8] H), 3.67 (t,J=5.2 Hz, 2H, C[9] H), 3.10 (t,J=5.2 Hz, 2H, C[10] H), 1.16 (t,J=7.1 Hz, 6H, C[15–16] H). 13C {1H} NMR (101 MHz, [D6]DMSO) δ=169.1, 151.3, 139.6, 134.4, 125.0, 120.7, 115.3, 69.0, 68.5, 68.1, 60.6, 54.9, 53.7, 13.9. HRMS (ESI+):m/zcalcd for C18H27N2O8
+([M+H]+): 399.17620, found: 399.17621.
Reduction of 9was carried out according to general procedure 1 starting from 26 mmol of staring material. The amine compound10 (yield: 9,3 g, 97 %) was isolated as a brown oil.1H NMR (400 MHz, [D6]DMSO)δ=7.21–7.11 (m, 3H, C[2–3, 5] H), 6.96 (dt, J=8.3, 7.3, 1.1 Hz, 1H, C[4] H), 4.17 (t,J=5.2 Hz, 2H, C[7] H), 4.08 (q,J=7.1 Hz, 4H, C[13–14] H), 3.74 (t,J=5.5 Hz, 2H, C[8] H), 3.69 (s, 4H, C[11–
12] H), 3.63 (t, J=5.5 Hz, 2H, C[9] H), 2.98 (t, J=5.5 Hz, 2H, C[10] H), 1.18 (t, J=7.1 Hz, 6H, C[15–16] H). 13C {1H} NMR (101 MHz, [D6]DMSO) δ=170.0, 150.2, 121.6, 121.3, 117.3, 114.4, 113.5, 68.8, 68.7, 68.3, 60.2, 55.1, 53.3, 14.0. HRMS (ESI+):m/zcalcd for C18H29N2O6+([M+H]+): 369.20202, found: 369.20183.
Alkylation of10was carried out according to general procedure 2.
starting from 9.3 mmol of starting compound to yield 11. The quantity of ethyl bromoacetate was halved compared to other compounds. The ethyl ester compound11(yield: 3,5 g, 70 %) was isolated as a brown oil. The spectroscopic properties of11are in good agreement with those published.[12] The formylation was performed according togeneral procedure 3starting from 2.5 mmol staring material. The aldehyde compound25(yield: 470 mg, 35 %) was isolated as a brown viscous oil.1H NMR (400 MHz, [D6]DMSO) δ=9.75 (s, 1H, C[27] H), 7.41 (dd,J=8.3, 1.8 Hz, 1H, C[3] H), 7.35 (d,J=1.8 Hz, 1H, C[5] H), 6.75 (d,J=8.3 Hz, 1H, C[2] H), 4.25 (s, 4H, C[11–12] H), 4.17–4.02 (m, 10H, C[7, 15–18] H), 3.67 (s, 6H, C[8, 13–
14] H), 3.59 (t, J=5.6 Hz, 2H, C[9] H), 2.98 (t, J=5.5 Hz, 2H, C[10] H), 1.18 (dt, J=14.8, 7.1 Hz, 12H, C[19–22] H). 13C {1H} NMR (101 MHz, [D6]DMSO) δ=190.4, 170.0, 169.9, 148.6, 144.4, 128.7, 125.3, 116.1, 112.4, 68.6, 68.3, 67.9, 60.2, 60.0, 55.0, 53.7, 53.4, 13.9, 13.9. HRMS (ESI+): m/z calcd for C27H41N2O11+ ([M+H]+):
569.27049, found: 569.27001.
The coupling to the fluorophore was carried out using thegeneral procedure 4 starting from 0.6 mmol of formyl compound. The tetraethyl ester compound32(yield: 80 mg, 15 %) was isolated as blue crystals. Melting point: decomposed at>145°C. 1H NMR (400 MHz, [D6]DMSO)δ=7.47 (d, J=9.6 Hz, 2H, C[29, 38] H), 7.20–
7.06 (m, 3H, C[5, 30, 37] H), 7.01 (dd, J=8.2, 1.9 Hz, 1H, C[2] H), 6.94 (d, J=2.5 Hz, 2H, C[32, 35] H), 6.92 (d, J=8.2 Hz, 1H, C[3] H),
4.27 (s, 4H, C[11–12] H), 4.16 (q, J=7.1 Hz, 4H, C[15–16] H), 4.09 (t, J=5.8 Hz, 2H, C[7] H), 4.03 (q, J=7.1 Hz, 4H, C[17–18] H), 3.66 (m, 10H, C[8, 40–43] H), 3.54 (t, J=5.8 Hz, 2H, C[9] H), 3.51 (s, 4H, C[13–14] H), 2.85 (t, J=5.8 Hz, 2H, C[10] H), 1.23 (t, J=7.2 Hz,18H, C[19–20, 44–47] H), 1.14 (t, J=7.1 Hz, 6H, C[21–22]).13C {1H} NMR (101 MHz, [D6]DMSO) δ=170.5, 170.2, 164.1, 157.3, 154.8, 148.8, 140.6, 131.8, 123.2, 117.2, 115.8, 114.1, 112.4, 95.9, 69.3, 68.4, 68.2, 60.0, 59.5, 55.0, 53.4, 53.0, 45.1, 44.7, 13.9, 13.8, 12.2. HRMS (ESI+):
m/zcalcd for C47H65N4O11+([M]+): 861.46444, found: 861.46278.
The hydrolysis of this ethyl ester was carried out using theGeneral procedure 5staring from the quantity given above. The fluorescent dye2 b(yield: 19 mg, 64 %) was isolated as blue crystals. Melting point: decomposed at>110°C. 1H NMR (400 MHz, [D6]DMSO)δ= 7.49 (d, J=9.6 Hz, 2H, C[21, 30] H), 7.14 (dd, J=9.6, 2.4 Hz, 2H, C[22, 29] H), 7.09 (d,J=2.0 Hz, 1H, C[5] H), 7.02 (d,J=8.3 Hz, 1H, C[2]), 6.95 (d, J=2.4 Hz, 2H, C[24, 27] H), 6.85 (d, J=8.3 Hz, 1H, C[3] H), 4.18 (s, 4H, C[11–12] H), 4.07 (t, J=4.5 Hz, 2H, C[7] H), 3.82 (s, 4H, C[13–14] H), 3.66 (m, 12H, C[8–9, 32–35] H), 3.18 (s, 2H, C[10] Hf), 1.21 (t, J=7.0 Hz, 12H, C[36–39] H). 13C {1H} NMR (101 MHz, [D6]DMSO) δ=172.2, 170.1, 157.4, 156.8, 154.9, 148.5, 141.0, 132.1, 123.6, 122.7, 116.6, 115.3, 114.2, 112.5, 96.0, 68.6, 68.0, 55.0, 54.3, 53.6, 45.3, 36.5, 12.5. HRMS (ESI+): m/z calcd for C39H49N4O11+([M]+): 749.33923, found: 749.33765.
Preparation of the fluorescent dye 4 b
To perform the initial alkylation shown in Scheme 2, 2-nitrophenol (10 g, 72 mmol, 1.0 equiv.) was dissolved in dry DMF (20 ml), then K2CO3 (19.9 g, 144 mmol, 2.0 equiv.) was added. The mixture was stirred at 110°C for 2 hours after the addition of (3-bromopropyl) benzene (15.8 g, 11.7 ml, 79.2 mmol, 1.1 equiv.). The formed solids were filtered out. Mononitro compound12(yield: 17.4 g, 94 %) was isolated as brown oil. The spectroscopic properties of the com- pound are in good agreement with the ones reported in the literature.[27]
To achieve precursor 13, 9.5 g of 12 (37 mmol, 1.0 equiv.) was dissolved in 30 ml 65 % HNO3(7.5 equiv.) and 1 ml of conc. H2SO4
was added. The mixture was stirred at 110°C for 1 hour, then poured on 100 ml icy water. The aqueous phase was extracted with 3x50 ml EtOAc. The organic layer was washed with 30 ml of saturated aqueous Na2CO3, then washed with brine, dried over MgSO4and concentrated to give 9.1 g of yellow oil. The reduction step was carried out according togeneral procedure 1.starting from the mixture of isomers present in the crude product. The isomers were separated at the end of reduction by preparative HPLC. The amine compound13(yield: 3.13 g, 35 % for the overall process) was isolated as an off-white powder. Melting point: 183°C. 1H NMR (400 MHz, [D6]DMSO)δ=7.24–6.91 (m, 8H, C[2–5, 11–14] H), 4.07 (t, J=6.1 Hz, 2H, C[7] H), 2.77 (t, J=6.1 Hz, 2H, C[9] H), 2.03 (q, J= 7.9 Hz, 2H, C[8] H). 13C {1H} NMR (100 MHz, [D6]DMSO) δ=150.1, 137.4, 130.2, 130.0, 127.2, 126.0, 125.1, 123.1, 121.3, 120.9, 119.7, 112.6, 67.6, 28.6, 26.4. HRMS (ESI+):m/zcalcd for C15H19N2O+([M+ H]+): 243.14919, found: 243.14890.
Alkylation of13was carried out according to general procedure 2.
from 4 mmol of amine to yield14. The ethyl ester compound14 (yield: 0.94 g, 40 %) was isolated as brown crystals. 1H NMR (400 MHz, [D6]DMSO) δ=7.25–7.15 (m, 2H, C[11, 14] H), 7.12 (td, J=7.6, 1.7 Hz, 1H, C[13] H), 7,02 (td,J=7.5, 1.6 Hz, 1H, C[12] H), 6.91–6.76 (m, 3H, [3–5] H), 6.69 (dd,J=7.2, 2.3 Hz, 1H, [2] H), 4.18–
3.90 (m, 18H, C[7, 16–23] H), 2.78 (t,J=7.9 Hz, 2H, C[9] H), 2.02 (t, J=11.1 Hz, 2H, C[8] H), 1.20–1.08 (m, 14H, C[24–27] H). 13C {1H}
NMR (101 MHz, [D6]DMSO) δ=170.8, 170.5, 170.3, 149.9, 148.3, 138.6, 136.9, 129.4, 126.3, 124.2, 123.2, 121.3, 120.7, 118.2, 113.3, 68.2, 60.1, 60.0, 54.9, 54.4, 53.4, 29.2, 26.9, 14.1, 14.1, 14.0. HRMS

![Table 2. Enthalpy (ΔH in kJ mol 1 ), Gibbs free energy (ΔG in kJ mol 1 ) and entropy (ΔS in kJ mol 1 K 1 ) values for the Ca 2 + complexation [A], protonation [B]](https://thumb-eu.123doks.com/thumbv2/9dokorg/960670.56613/7.892.73.823.892.1069/table-enthalpy-gibbs-energy-entropy-values-complexation-protonation.webp)
