Indoor localization simulation framework for optimized sensor placement to increase
the position estimation accuracy
Ádám Kaló, Zoltán Kincses, László Schäffer, Szilveszter Pletl
University of Szeged, Department of Technical Informatics
Kalo.Adam@stud.u-szeged.hu,{kincsesz,schaffer,pletl}@inf.u-szeged.hu Submitted: February 4, 2020
Accepted: July 1, 2020 Published online: July 23, 2020
Abstract
Indoor position estimation is an important part of any indoor application which contains object tracking or environment mapping. Many indoor local- ization techniques (Angle of Arrival – AoA, Time of Flight – ToF, Return Time of Flight – RToF, Received Signal Strength Indicator – RSSI) and tech- nologies (WiFi, Ultra Wideband – UWB, Bluetooth, Radio Frequency Identi- fication Device – RFID) exist which can be applied to the indoor localization problem. Based on the measured distances (with a chosen technique), the position of the object can be estimated using several mathematical methods.
The precision of the estimated position crucially depends on the placement of the anchors, which makes the position estimate less reliable. In this paper a simulation framework is presented, which uses genetic algorithm and the multilateral method to determine an optimal anchor placement for a given pathway in an indoor environment. In order to make the simulation more re- alistic, the error characteristics of the DWM1001 UWB ranging module were measured and implemented in the simulation framework. Using the proposed framework, various measurements with an optimal and with a reference an- chor placement were carried out. The results show that using an optimal anchor placement, a higher position estimation accuracy can be achieved.
Keywords:Anchor placement, Ultra Wide Band, Multilateral, Genetic Algo- rithm, Indoor Localization, Non-linear Measurement Error Model
doi: 10.33039/ami.2020.07.002 https://ami.uni-eszterhazy.hu
29
1. Introduction
The location of a device or user can be effectively obtained outdoor using the Global Positioning System (GPS), but it could be challenging in an indoor envi- ronment. During the last decade, indoor localization has been investigated mainly for wireless sensor networks and robotics. However, nowadays, the wide-scale usage of mobile phones and wearable devices has enabled localization in a wide range of applications like health-care, industry, surveillance and home management.
In the literature many localization technologies and techniques are available [9].
A Received Signal Strength Indicator (RSSI), which is the strength of the signal received usually measured in decibel-milliwatts (dBm), and a wireless Ethernet based localization approach is used in [4]. Using a path-loss model and the RSS, the distance between the sender and receiver can be estimated. In [7] an Angle of Arrival (AoA) and Wireless LAN (Wifi) based method is applied using an antennae array for the estimation of the angle by computing the difference between the arrival times at the individual elements of the array. A Time of Flight (ToF) and 2.4 GHz radio based approach is presented in [5], using signal propagation time to compute the distance between the transmitter and the receiver. A similar technique, the Return Time of Flight (RToF) is used in conjunction with RSSI in a Wifi-based method in [10].
RToF is a two-way ranging method where the transmitter sends a ranging mes- sage to the receiver at 𝑡1 time. The receiver sends it back with a delay of 𝑡proc time and it arrives to the original transmitter at 𝑡2 time. The time of flight is 𝑡2−𝑡1−𝑡proc, and the distance can be calculated with the speed of the signal, depending on the technology. The accuracy of the measurement highly depends on 𝑡proc.
The UWB is a recently researched communication technology providing more accurate ToF and RToF estimations. It uses ultra-short pulses with a time period less than a nanosecond, resulting in a low duty cycle which leads to lower power consumption. Its frequency range is from 3.1 to 10.6 GHz with a bandwidth of 500 MHz. Since the UWB usually operates at a low energy level, typically between
−40 and −70dB, most of the other technologies detect it as background noise.
This makes it practically immune to interference with other systems since it has a radically different signal type and radio spectrum. Moreover, the signal (especially in its lower frequencies) can penetrate through walls because signal pulses are very short. Utilizing this attribute, it is easier to differentiate the main path from the multi-paths, providing more accurate estimations [8].
Once the point-to-point distances between the objects are measured, the un- known position of the object can be estimated. There are various algebraic methods to estimate the position from the point-to-point distances like triangulation or mul- tilateration. Most of them require a few devices with known fixed positions (anchor nodes) to calculate the actual position of the moving device (mobile node). In case of error-free distance measurements, these methods theoretically give an exact po- sition. But real distance measurements contain errors which depend on the relative
position of the devices, the orientation of the antennas of the devices, and also the technique and technology used. These result in a varying reliability of the position estimation.
In this paper, a genetic-algorithm-based simulation framework is presented, which takes the specific error characteristics of the chosen localization system (DWM1001 a commercially available UWB localization system using RToF) into consideration and uses a 2-dimensional (2D) version of the multilateral method to determine an optimal anchor placement for a given pathway in a given environ- ment. This framework can also be extended to 3-dimensional (3D) space in the future.
2. Methods
During the research, several methods were used together. To calculate the posi- tion of the object from the measured point-to-point distances, a 2D version of the original 3D multilateral algorithm [6] was used. The evaluation of the calculated positions was based on the Root-Mean-Squared Error (RMSE) of distances be- tween the original and the calculated positions. To minimize this error, the genetic algorithm with a special fitness function (Subsection 4.1) was used. In this section, the various methods are presented.
2.1. Multilateral algorithm
The multilateral algorithm [6] can be used to determine the unknown position in a 3D space – assuming an adequate number of reference points in a common Descartes coordinate system spanning the space – by solving the following linear equation system:
(𝑥−𝑥𝑖)2+ (𝑦−𝑦𝑖)2+ (𝑧−𝑧𝑖)2=𝑑2𝑖; 𝑖= 1, . . . , 𝑁, (2.1) where𝑁 is the number of anchor nodes,(𝑥𝑖, 𝑦𝑖, 𝑧𝑖)is the coordinate of the𝑖th an- chor node,(𝑥, 𝑦, 𝑧)is the coordinate of the mobile node and𝑑𝑖is the point-to-point distance between the𝑖th anchor node and the mobile node respectively. Rearrang- ing (2.1) in 2D case, it can be written in the following matrix representation:
⎛
⎜⎜
⎜⎝
−1 −2𝑥1 −2𝑦1
−1 −2𝑥2 −2𝑦2
... ... ...
−1 −2𝑥𝑁 −2𝑦𝑁
⎞
⎟⎟
⎟⎠·
⎛
⎝𝑥2+𝑦2 𝑥 𝑦
⎞
⎠=
⎛
⎜⎜
⎜⎝
𝑑21−𝑥21−𝑦21 𝑑22−𝑥22−𝑦22
...
𝑑2𝑁 −𝑥2𝑁 −𝑦𝑁2
⎞
⎟⎟
⎟⎠. (2.2)
Rewriting (2.2) in a short form:
A·𝜂=b; A∈R𝑁×3, 𝜂∈R3, b∈R𝑁. (2.3) The solution of (2.3) for𝜂 is given by:
𝜂=A+·b, (2.4)
whereA+ denotes the Moore-Penrose pseudo-inverse of matrixA. Assuming that the positions of anchor nodes are fixed during the measurement, it is enough to calculate 𝐴+ once offline thus speeding up the position estimation process.
2.2. Root-Mean-Squared error
There are several methods for qualifying models. In our case, to determine the quality of the anchor topography in relation to the position estimation accuracy, an appropriate quality factor is required which takes the standard deviation of the positioning error into account. Such factor is the RMSE or Root-Mean-Squared deviation (RMSD), which has the formula as follows [1]:
𝑅𝑀 𝑆𝐸=
⎯⎸
⎸⎷Σ𝑀𝑖=1(︁
𝑑ˆ2err,𝑖)︁
𝑀 ,
where 𝑀 is the number of discrete points in the field of mobile nodes, and 𝑑ˆerr,𝑖 is the Euclidean-distance between the estimated position ( ˆ𝑥𝑖,𝑦ˆ𝑖) and the exact position(𝑥𝑖, 𝑦𝑖)of point𝑖∈[1, 𝑀]:
𝑑ˆerr,𝑖=√︀
(ˆ𝑥𝑖−𝑥𝑖)2+ (ˆ𝑦𝑖−𝑦𝑖)2.
2.3. Genetic algorithm
The genetic algorithm (GA) is a metaheuristic, optimization algorithm based on the concept of Darwin’s theory of evolution. During the optimization, the properties of the initial population are altered in such way that the value of the predefined fitness function should converge towards an optimal solution in every iteration.
The genetic algorithm requires a genetic representation of the solution and a fitness function which can evaluate this representation. Since the GA usually works with hundreds of candidate solutions per iteration, choosing a compact representation and a fast evaluation method is crucial.
The GA typically starts with a randomly generated set of candidate solutions.
The solutions are evaluated one-by-one, and a portion of the higher-ranking can- didates are kept for the next generation.
After the first iteration, the generations will consist of higher-ranking candi- dates from the previous generations, cross-mutated individuals from the previous candidates, and also of new randomized individuals. Random mutations may also appear at any candidate. In the case of multi-population GA a migration step is also performed.
The optimization stops after the fitness value has reached a predefined limit or the number of maximum generations or stall-generations (i.e. generations, where the fitness value did not improved) has been reached [3].
3. Measurement setup
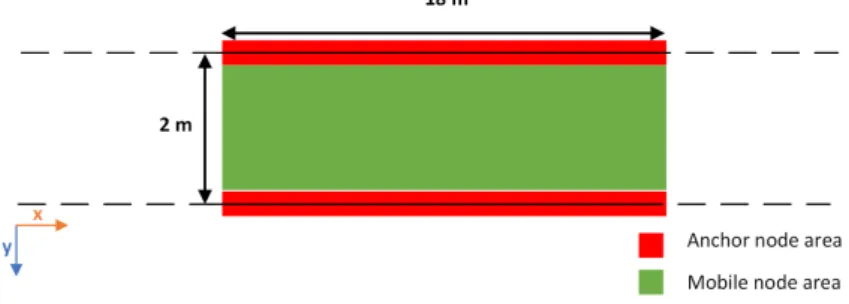
The environment of our experiment is a corridor in the University of Szeged. During the simulation and also in the validation a belt-type topography is used as can be seen in Fig. 1. The boundary conditions are derived from the physical capabilities of the corridor. For details of the anchors and mobile nodes used, see Subsection 3.1.
Two sets of measurements were carried out. The first set consisted of two measurements with 4 anchors using equidistant and optimised placement (see Sec- tion 4). The second set of measurement differed only in the number of anchors, since 8 anchors were used.
Figure 1: Measurement setup
During the measurements, the exact position of the discrete grid points (mobile node position) is determined using a professional laser rangefinder. In each grid point, the mobile node collected the distances from the anchors many times (at least 100 samples per point) and the aggregated data was sent to the data collector.
3.1. Hardware
The UWB based distance measurements were carried out by a commercially avail- able localization system framework (MDEK1001), which consists of DWM1001 modules. The anchors were configured via the official mobile application (De- caWave DRTLS manager). The 8 anchors were organized in 2 networks, each network consisted of 4 anchors. On the measurements with 4 anchors, only one network was used.
The DWM1001 was connected to an STM32F746ZGT6 nucleo-144 development board (STM) via UART. The original program of the DWM1001 was modified to gather the 4 distances in both networks, and send the collected data towards the STM. The STM sent the data towards a mobile computer via UART trough an USB cable. On the mobile computer, the data was captured and saved via PuTTY, and were later evaluated with MATLAB.
4. Genetic algorithm based simulation
The simulation framework is based on the GA implementation of the optimtool toolbox of MATLAB. The implementation was slightly modified to run the multi- population version of GA. The genetic representation of the system (the phenotype) was the 𝑥 coordinates of the anchors. The 𝑦 coordinates were along the walls of the simulated area, and the distribution of the anchors between the two walls was equal, or its difference was 1. The phenotype had a lower limit of 0, and an upper limit of 18 (see Section 3), and they were free to move within this interval.
The initial population range was 100 candidates. For each generation, the 20 highest-ranked candidates of the previous generation survived and further 60 were generated with cross-breeding and 20 new were randomly generated. The maximum number of generations, and the maximum number of stall-generations were both 100. The evaluation of the candidates was done by the special fitness function (Subsection 4.1). During the optimization process the number of anchors was 4 and 8.
4.1. Fitness function
The aim of the fitness function in a GA is to order the candidates of the population based on their phenotype. The input of the function is the 𝑥coordinates of the candidate anchors, and the output is a corresponding RMSE value. After that the exact positions of the mobile node have been generated along a given path in the simulated area, the point-to-point distances from these points and the anchor nodes can be calculated. For each distance value, a unique error (see Subsection 4.2) is added. Using the erroneous distance values and the anchor positions the simulated mobile node positions can be determined using (2.4). Since the physical hardware device distance horizon is limited to 10 metres, any distance value over this range is discarded. The RMSE value can be calculated from the exact and simulated positions (see Subsection 2.2), resulting a fitness value of the given candidate.
4.2. Determination of the 2D error characteristics
In order to implement a more realistic simulation, the UWB distance sensor cali- bration was performed using a more accurate (±1mm) class of laser rangefinder.
Based on the measurements, the 2D error characteristics of the DWM1001 module with the built-in on-board antenna was determined. The measurement consisted of placing two modules in a known distance from each other, and performing a measurement with the UWB technology using RToF technique. The measured dis- tance (𝑑) is the sum of the exact distance measured with a laser rangefinder (𝑑)ˆ and the RToF measurement additive error (∆𝑑) as follows:
𝑑ˆ=𝑑+ ∆𝑑.
The∆𝑑was calculated in discrete points from 0.3 to 10 metres in steps of 0.3 meters. At each discrete point at least 100 measurements were conducted with
varying antenna orientation (0∘,90∘,180∘) and the mean value was calculated.
After the measurements, at each measured distance, an error value was inter- polated for every degree between 0∘–180∘. Since the error characteristic is sym- metrical in this plane [2], the corresponding error values for degrees between180∘ and360∘ can be used from the interpolated ones. Each point of the 2D error char- acteristic is loaded into a Look-Up-Table (LUT), since in the optimization process the genetic algorithm reads the corresponding error value addressing the LUT by the distance and orientation parameters.
5. Results
The main results of the proposed method are creating a realistic (hardware- and environment-specific) 2D error characteristic of DWM1001, determining an opti- mal placement of anchor nodes and experimentally validating the results of the simulation.
5.1. Realistic 2D error characteristic
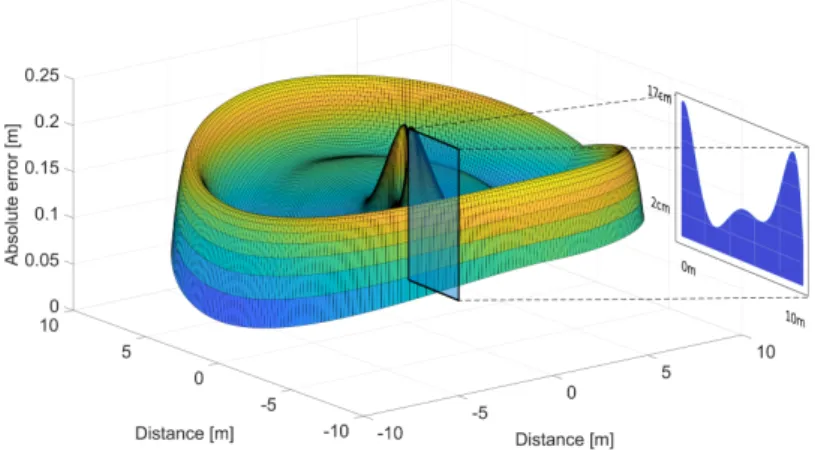
The visualization of the realistic 2D error characteristic can be seen in Fig. 2, where one slice of the surface represents the distance error of one degree of rotation of the DWM1001 module. In the data sheet of DWM1001 [2] it is claimed that the ranging accuracy of the module is within 10 cm. But the results in Fig. 2 showed that the accuracy is a nonlinear function of distance and orientation. Furthermore, between 0–1 m and 9–10 m, the error is significantly higher than 10 cm (17cm±2cm). The highest accuracy can be reached around 2 meters (7cm±2cm).
Figure 2: Realistic 2D error characteristic of DWM1001
5.2. Optimized anchor placements
The goal of the optimization process was to find an optimal anchor placement in case of 4 and 8 anchors. During this process, linear and non-linear paths of the mobile node was used. Table 1. shows the RMSE values of the position estimation using the optimally and equidistantly placed anchors. The results showed that the optimization significantly increases the accuracy of the position estimation in case of 4 anchors, but in case of 8 anchors, it has a lower impact. However, using only 4 anchors, the robustness of the system is lower.
RMSE [m]
straight line sine wave arctangent wave Average
4 anchor opt. 0.086 0.088 0.087 0.087
4 anchor eq. 1.392 1.392 1.391 1.392
8 anchor opt. 0.057 0.060 0.060 0.059
8 anchor eq. 0.072 0.072 0.073 0.072
Table 1: RMSE of the optimized and equidistant anchor placement
Figure 3: Optimized and reference anchor placements for 4 anchors (A) and 8 anchors (B)
In Fig. 3 the placement of the anchor nodes can be seen with and without op- timization. The optimization process provides significantly different anchor place- ment in case of 4 anchors but just a slightly different in the 8-anchor case compared
to the equidistant placing. Analyzing the results of the optimization, it can be stated that the algorithm places the anchors considering two main conditions. It tries to cover the whole area to have at least 3 anchor nodes in the range of the mobile node and places as many anchors as possible in the border of the mobile node area since the accuracy of the DWM1001 is lower nearby its horizon.
5.3. Validation of the anchor placement
The purpose of the validation is to verify the localization accuracy by real measure- ments using the proposed anchor placement in case of 4 and 8 anchors. In Fig. 4 and Fig. 5 the anchor position, the accurate position using the laser rangefinder and the estimated position using the DWM1001 of the mobile node can be seen.
Figure 4: Experimental results for the 4 anchor measures
Figure 5: Experimental results for the 8 anchor measures
The results show that using an optimized anchor placement, the localization accuracy can be increased in case of 4 anchors but there is no significant improve-
ment using 8 anchors compared to the equidistant case. Using an optimal anchor placement in case of limited number of anchors the space of the mobile nodes can be effectively covered. Furthermore, the validation shows that using the simu- lation framework, the same positioning results can be achieved as with the real measurement.
6. Conclusion
In this paper, a genetic-algorithm-based simulation framework is presented to de- termine an optimal anchor placement in an indoor environment. To implement a realistic and precise simulation environment, the 2D error characteristics of the DWM1001 module was measured and implemented in this work. Using the pro- posed framework, various measurements with an optimal and with a reference anchor placement were carried out. The results show that the optimal anchor placement is crucial when the number of anchors is limited. It can also be con- cluded that if the number of anchors are increasing, their placement becomes less relevant. Furthermore, the validation shows that there is no significant difference between the simulation and the real experiments.
Acknowledgements. This research was supported by the projects “Extending the activities of the HU-MATHS-IN Hungarian Industrial and Innovation Mathe- matical Service Network” EFOP-3.6.2-16-2017-00015.
References
[1] T. Chai,R. R. Draxler:Root mean square error (RMSE) or mean absolute error (MAE)?
– Arguments against avoiding RMSE in the literature, Geoscientific Model Development 7.3 (2014), pp. 1247–1250,
doi:10.5194/gmd-7-1247-2014.
[2] DecaWave:DWM1001 Datasheet, Version 1.10, 2017.
[3] J. H. Holland:Genetic Algorithms, Scientific American 267.1 (1992), pp. 66–73, doi:10.1038/scientificamerican0792-66.
[4] A. Ladd,K. Bekris,A. Rudys,E. L. Kavraki,D. S. Wallach:Robotics-Based Location Sensing Using Wireless Ethernet, Wireless Networks 11 (2005), pp. 189–204,
doi:https://doi.org/10.1007/s11276-004-4755-8.
[5] S. Lanzisera,D. T. Lin,K. S. J. Pister:RF Time of Flight Ranging for Wireless Sen- sor Network Localization, in: International Workshop on Intelligent Solutions in Embedded Systems, 2006, pp. 1–12,
doi:10.1109/WISES.2006.329127.
[6] A. Norrdine:An algebraic solution to the multilateration problem, in: International Con- ference on Indoor Positioning and Indoor Navigation, 2012, pp. 1–4,
doi:10.13140/RG.2.1.1681.3602.
[7] J. Xiong,K. Jamieson:ArrayTrack: A Fine-Grained Indoor Location System, in: Sympo- sium on Networked Systems Design and Implementation, 2013, pp. 71–84.
[8] K. Yu,I. Oppermann, in: UWB Theory and Applications, John Wiley and Sons, Ltd, 2005, pp. 175–196,
doi:10.1002/0470869194.ch8.
[9] F. Zafari,A. Gkelias,K. K. Leung:A Survey of Indoor Localization Systems and Tech- nologies, IEEE Communications Surveys Tutorials 21.3 (2019), pp. 2568–2599,
doi:10.1109/COMST.2019.2911558.
[10] Zheng Sun,R. Farley,T. Kaleas, J. Ellis,K. Chikkappa:Cortina: Collaborative context-aware indoor positioning employing RSS and RToF techniques, in: 2011 IEEE Inter- national Conference on Pervasive Computing and Communications Workshops (PERCOM Workshops), 2011, pp. 340–343,
doi:10.1109/PERCOMW.2011.5766901.