Article
Application of Correlation-Based Scoring Scheme for Visual Acuity Measurements in the Clinical Practice
Csilla F ¨ulep
1, Ill ´es Kova´cs
2, Kinga Kra´nitz
2, Zolta´n Zsolt Nagy
2, and Ga´bor Erdei
11Department of Atomic Physics, Budapest University of Technology and Economics, Budapest, Hungary
2Department of Ophthalmology, Semmelweis University, Budapest, Hungary
Correspondence: Csilla F ¨ulep, De- partment of Atomic Physics, Buda- pest University of Technology and Economics, Budafoki ´ut 8, Budapest H-1111, Hungary. e-mail:
fulepcsilla@gmail.com Received:19 July 2018 Accepted:9 January 2019 Published:17 April 2019
Keywords:visual acuity; eye chart;
scoring method; optotype correla- tion; psychometric function Citation:F ¨ulep C, Kova´cs I, Kra´nitz K, Nagy ZZ, Erdei G. Application of correlation-based scoring scheme for visual acuity measurements in the clinical practice. Trans Vis Sci Tech. 2019;8(2):19, https://doi.org/
10.1167/tvst.8.2.19
Copyright 2019 The Authors
Purpose: Visual acuity tests are generally performed by showing eye charts to the subjects and registering their correct/incorrect identifications for the presented optotypes. We recently developed a correlation-based scoring method that significantly reduces the statistical error associated with relative letter legibility. In this paper, our purpose was to demonstrate the advantages and clinical utility of our scoring scheme compared to standard methods.
Methods: We developed a new computer-controlled measurement setup aligned with the ophthalmological standard. With this system, we presented the application of our correlation-based scoring in conventional clinical environment for 25 subjects and estimated the systematic error of the obtained acuity values. A separate experiment was performed by 14 additional subjects to reveal the test-retest variability of the new scoring method.
Results:The average systematic error relative to standard probability-based scoring is 0.01 logMAR over the examined subject group. Application of the correlation-based scheme when used in clinical environment with five letters per size decreases the repeatability error by ~20% and increases diagnosis time by~10%.
Conclusions: The new scoring scheme is directly applicable in clinical practice providing unbiased results with improved repeatability compared to standard visual acuity measurements. It reduces test-retest variability by the same amount as if the number of letters was doubled in traditional tests.
Translational Relevance:Our new method is a promising alternative to conventional acuity tests in cases when high-precision measurements are required, for example evaluating implanted intraocular lenses, testing subjects with retinal diseases or cataract, and refractive surgery candidates.
Introduction
Visual acuity is the primary ophthalmological metric that quantifies the patient’s perceived visual quality. Accurate and sensitive acuity measurements are especially important in applications testing patients suffering from retinal diseases (e.g., age- related macular degeneration or diabetic macular edema to determine the need for treatment or its efficacy) or cataract and refractive surgery candidates with high visual expectations (to indicate the need for corneal or lens surgery and to evaluate its out- come).1,2 In ophthalmic studies, clinically relevant treatment effects should be prespecified and then
justified in terms of ‘‘change in visual acuity from baseline.’’ Most of the (re)treatment criteria are based on the measured progress of visual acuity, using different expectations in letter score increment (e.g., .5 letters or .10 letters). Both in these clinical situations and in scientific studies, a visual acuity measurement method with high accuracy and repro- ducibility, that is low test-retest variability (TRV, standard deviation of the results of several repeated measurements), is desirable.3,4 The specific motiva- tion of our research group comes from the field of cataract surgery: we are primarily interested in improving intraocular lens (IOL) design and implan- tation. Comparison of different types of premium
IOLs (i.e., aspheric, toric, or diffractive lenses), as well as assessment of the outcome of a surgery, require a method that enables the detailed analysis of visual acuity with greater precision than current approaches.
Although these goals may not be universal, we hope our results will be beneficial for other areas of vision science, too.
Conventional acuity tests are based on letter recognition in eye charts. For this purpose, the Early Treatment Diabetic Retinopathy Study (ETDRS) chart has become the standard.5,6,7 Its logarithmic layout6,8,9standardizes the visual task and the effects of letter crowding.10,11 Furthermore, to ensure equalized difficulty for the rows, the ETDRS protocol uses only certain combinations of the Sloan let- ters,5,6,12whose selection has been still further refined in the currently used ETDRS 2000 series charts.13 Thus, the only significant variable that changes from one line to the next is the letter size, usually characterized by the a visual angle, that is the angle that the stroke width (and smallest gap) of the optotypes subtend at the eye.
Even though the standardization of the chart design has reduced the systematic error (the average difference between two measurements took under different conditions) and, thus, increased the compa- rability of the measurements, the evaluation process (i.e., the applied scoring method, evaluation protocol, and termination rule) still causes a large statistical uncertainty.1,14–16 According to the line-assignment evaluation, the visual acuity value is determined by the visual angle of the smallest letter size (threshold), where the majority of the optotypes is recognized correctly.12,17 It has been shown that the variance of the measurement is almost constant across a wide visual acuity range if the scaling is logarithmic.9,18 Therefore, in currently used eye charts, the decrease of the letter size from line to line follows a geometric progression with a quotient of 10.1/10Corresponding- ly, the V visual acuity value is usually expressed in logMAR units (i.e., the decimal-base logarithm of the minimum angle of resolution),
V[log10ð Þ;a0 ð1Þ wherea0denotes the visual angle at the threshold line in minutes of arc. Although the theoretical probabil- ity threshold is 50%,12,17 using the ETDRS charts (implemented with five letters per line) the actual threshold rises to 60%, 80%, or even 100%depending on the distribution of correctly recognized letters, which causes noticeable error in the results relative to theory. According to the literature,6,14,19the statistical
error of current line-assignment-based visual acuity measurements varies between 0.6 and 1.5 line (0.06 logMAR , TRV,0.15 logMAR) for subjects with normal vision. This accuracy is sufficient for screening purposes as part of preventive health care; however, epidemiologic surveys and clinical research require higher precision and reliability as the successive measurements are to be compared to each other.4,9
To reduce the statistical error, the single-letter- scoring method has been developed based on record- ing the identifications for individual letters instead of complete lines.4,14,15,20 The special design of the ETDRS chart allows the examiner to recompense the subject’s visual acuity by0.02 logMAR unit for each correctly recognized letter.4,6,21 Corresponding- ly, the visual acuity value can be determined from the Tctotal number of correct identifications in the chart as:
V ¼1:10:02Tc: ð2Þ Although this technique decreases the uncertainty error (TRV ’ 0.04 logMAR),22,23 its outcome does not correspond exactly to the theoretical 50%
probability threshold. It is offset by approximately half a line (i.e.,þ0.05 logMAR) systematic error.4,21
According to the literature,3,4,21 nonlinear (e.g., logistic) regression provides an alternative possibility in clinical research to achieve the same reduced amount ofTRVas single-letter-scoring:TRV’0.04 logMAR.
In this case, the measured P recognition probability values at the x ¼log10(a) letter sizes are fitted by a monotonic differentiable S-shaped curve, the so-called psychometric function of vision.16,24–26Visual acuity is determined by the x0 letter size at which the L(x) psychometric function intersects the theoretical P0¼ 0.5 probability threshold,22,27,28 that is:
LðxÞjx¼x0 ¼P0) V[x0: ð3Þ This method exactly corresponds to the definition given by the measurement standard17 and, thus, eliminates systematic error. Because it has the lowest statistical error as well, in our former paper29 we concluded that applying nonlinear regression is the best way to determine visual acuity.
The TRV of the measurements is also influenced by the recognizability of individual characters.
Despite the extensive effort put into balancing legibility,12,30 certain Sloan letters are still easier to identify, whereas some are easier to confuse with others.24 If the within-line legibility differences are greater than the between-line legibility differences of the chart, then an increased variability may occur in
the results.31,32 To overcome this issue, we formerly introduced a correlation-based scoring method to further reduce the statistical error of the measure- ments. In our previous studies,29,33 we presented the theoretical background and the technical details of the method and verified that our correlation-based approach is practically equivalent to standard prob- ability-based scoring for subjects with normal and supernormal vision. We also demonstrated that it reduces the statistical error by ~28% under special high-precision laboratory conditions. However, to test our correlation-based scoring in the clinical practice over subjects from a wider range of visual quality, new measurements became necessary.
In this paper, we presented the clinical application of the correlation-based scoring scheme by our improved and customized experiments. We evaluated the trials both by probability- and correlation-based scorings and compared the obtained results to verify the adequacy of the previously calibrated correlation threshold29 in a clinical environment, covering the 0.2 toþ0.7 logMAR range. We also compared and contrasted the results of our measurements to the outcomes of standard ETDRS trials to assess the widespread applicability of the new method. Finally, we gave an estimation for the statistical error reduction of the correlation-based scoring when used in clinical practice.
Methods and Measurements
The Correlation-Based Scoring Method
Below, a brief summary of our correlation-based scoring method is given and some differences from standard probability-based scoring are expressed.
Further details and deeper explanations are presented in our previous work.29,33
During conventional visual acuity tests, the exam- iner registers only whether the displayed letters are recognized correctly or not, that is the mere fact of recognition is considered. The identifications are represented in binary digits, where 1 denotes a correct recognition and 0 indicates a mistake. Based on the distribution of correct identifications, visual quality is represented by the P(x) recognition probability as a function of the letter size. However, to increase accuracy, examiners sometimes omit minor errors (e.g., misidentifying C as O or R as P),9acknowledg- ing that human letter recognition is more complex than a simple binary scheme. Consequently, if the subject is able to see some features of a misidentified
letter, then it is worth for characterizing how bad or good his/her guess is. Thus, we have formerly introduced a new quantity called optotype correlation (OC) to characterize the physical similarity of the letters.29,33TheOCvalue of a character pair has been determined by the Pearson’s cross-correlation of the binary (black/white) ideal images of the letters. OC spans between 1 and þ1, with higher values corresponding to more similar letter pairs, and identities (i.e., correct identifications) are represented by 1. The numerical values of the entire OC matrix corresponding to a complete character set have been transformed linearly so that the expected value of two randomly selected letters (i.e., misidentifications) equals 0 (excluding identical letter pairs, i.e., acciden- tal correct answers). In this way, OC is directly comparable to the conventional binary scheme of true/false identifications.
In our preliminary laboratory measurements,29,33 we strove for high precision; thus, all characters of the extended Sloan font type34 were displayed, including the complete English alphabet. Accordingly, we expected that the subjects’ identifications covered the same 26-letter selection. In our new experiments, corresponding to the real composition of the ETDRS charts, the presented optotypes are selected only from the 10 original Sloan letters.5,6 However, we still consider all letters of the complete English alphabet as potential guesses because the subjects are not supposed to know this restriction. Due to this difference from our former measurements,29 the numerical values of the OC matrix had to be recalculated for clinical use to ensure that the expected value of misidentifications still equals 0.
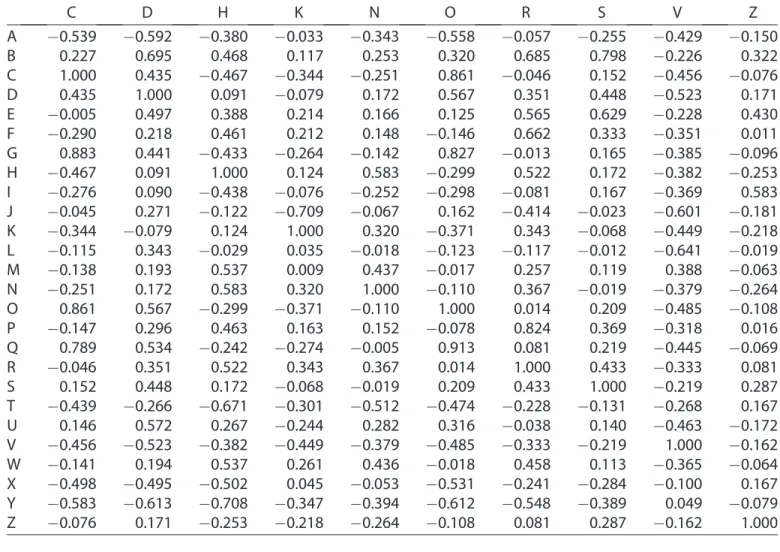
The updated OC matrix of the potential presented- perceived letter pairs is depicted in Figure 1, where rows represent the displayed Sloan characters, col- umns indicate the potential identifications, and the OC values are color coded according to the Viridis colormap. The numerical values are listed inTable A1 in theAppendix.
The diagram in Figure 1 is similar to confusion matrices, sometimes used by ophthalmologists to quantify the probability of misidentifications35 be- cause character pairs with higher correlations are more likely to be mixed up. In other words, the OC value of more similar letters (lighter/yellowish cells in Fig. 1), such as C and O (0.861), is larger than that of less similar characters (darker/bluish cells in Figure 1), such as H and T (0.671).
In our previous studies,29,33 we proposed a new quantity, namely the rate of recognition (RR), instead
ofPto describe visual quality. For a fixedxletter size (i.e., an actual line of the ETDRS chart), RR is defined as the average OC value of the presented- perceived character pairs:
RR[OC: ð4Þ
Consequently, RRis directly comparable to recogni- tion probability but provides more information about visual perception. According to our interpretation, the limiting case ofRR(x) represents the psychometric function of vision, when the number of letters per row tends to infinity.
In our former measurements,29,33 we applied decimal notation to express the letter size of the rows, but for the evaluation of clinical trials, we decided to use the more widespread logMAR units (i.e., x ¼ log10(a)). In the former case,29 a super- Gaussian function36 provided the most robust fit for the interpolation of the psychometric function, having only two independent parameters. However, switch- ing the letter size expression from decimal to logMAR units, we also have to change the regression function.
In this case, we can apply the L(x) sigmoid-shape logistic function, which is the most frequently used two-parameter curve to approximate any psychomet- ric function.22,26,27 Its mathematical formula is described by:
LðxÞ ¼ 1
1þexpðk ðxxmpÞÞ: ð5Þ The xmp parameter sets the midpoint position of the sigmoid, while k/4 determines the steepness of the curve at this point. To make sure that the limits of the psychometric function correspond to the theoretically expected RRvalues, it has to be further transformed linearly as22,27:
L0ðxÞ ¼25
26LðxÞ þ 1
26; ð6Þ
so that limx!‘L0ðxÞ ¼1, and limx!‘L0ðxÞ ¼1=26 according to the total number of potential answers.
Visual acuity of a subject is determined by fitting the logistic curve described in Eq. (6) to his/her measured RR values collected at the discrete letter sizes of the eye chart (x ¼ 1.0, 0.9, 0.8 to 0.3 logMAR). In accordance with the measurement standard,17 the V acuity value corresponds to the specificx0letter size at which the value of the function equals the given threshold (RR0):
L0ðxÞjx¼x0 ¼RR0) V[x0: ð7Þ We calibrated the correlation threshold empirically by our former high-precision laboratory measure- ments. The systematic error (between the visual acuity values obtained by correlation-based and traditional evaluation of the same trial records) reached its minimum atRR0¼0.68.29Figure 2shows the concept of curve-fitting-based evaluation by the average psychometric curves determined in our previous
Figure 1. Optotype correlation (OC) values for the displayed-identified letter pairs arranged in alphabetical order. Rows represent the displayed Sloan characters and columns indicate the potential identifications. High correlations are represented byyellow(light) hues and low correlations byblue(dark) hues.
Figure 2. Average probability- and correlation-based psychometric functions and the corresponding thresholds (P0
andRR0) based on our former measurements.
paper29 (LP0: xmp ¼ 0.214 logMAR, k ¼ 13.22 logMAR1, and LRR0: xmp ¼ 0.269 logMAR, k ¼ 17.11 logMAR1) and emphasizes the differences between the probability- and correlation-based scor- ing methods.
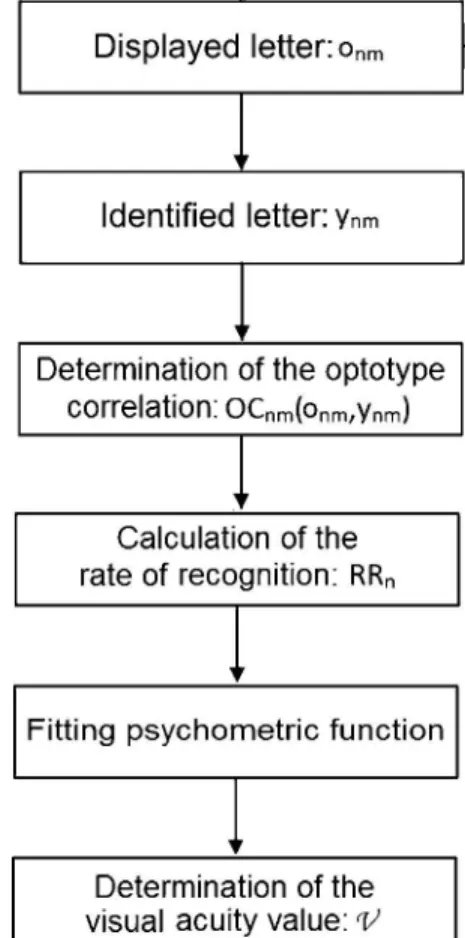
The entire workflow of the above-described correlation-based approach is depicted in Figure 3.
To verify the applicability of the method and the pertinence of the RR0 threshold under conventional clinical conditions, we had to perform new trials.
Details of the measurements are discussed below, and their results are presented in the Results section. It is important to note that according to our experience, the difference between the visual acuity values obtained by the decimal and the logMAR notation is negligible.
Description of the Measurement Setup
We implemented a computer-controlled setup that allows for the medical application of our scoring method in alignment with the current clinical
standards.37,38 In addition to our new correlation- based measurements, we used the same monitor to display an ETDRS chart and perform conventional trials to provide reliable reference for cross-valida- tion. For all subjects, the ETDRS test followed by the correlation-based experiment were carried out at one sitting to ensure exactly the same conditions. In accordance with the European clinical standard,6,12,17 we took our measurements from a viewing distance of 4 meters in a dimly lit exam room, with an illuminance of 150 lux. To investigate complete five- letter lines from 0.9 to0.5 logMAR value, we used a Samsung U24E590D 4k UHD LED monitor with a diagonal size of 600 mm and a pixel pitch of 0.1358 mm, having a matte screen to reduce glare. The luminance of the monitor was set to 100 cd/m2, which fulfilled the International Council of Ophthalmology (ICO) standard (min. 80 cd/m2).17
During the measurement, the subject verbally identified each displayed optotype, and the examiner promptly typed the response on a keyboard. The controller software also scored the test and analyzed the collected data. For identifications such as ‘‘I don’t know’’ or ‘‘I can’t see,’’ the program used the average value of the OC matrix (1/26 ’ 0.038), representing a random choice. Right after the measurement, the software also performed logistic regression to determine the visual acuity value.
Figure 4 depicts the graphical result of a represen- tative trial.
We used two separate experiments for the verifi- cation of the clinical applicability of our method: one for assessing the systematic errors (experiment 1) and another for repeatability error analysis (experiment 2). The main purposes, the fundamental consider- ations, and the differences between the two protocols are discussed below.
Figure 3. Workflow of the correlation-based scoring scheme for testing visual acuity. The variablen indicates the index of letter size, whereas m indicates the index of single letters within a specific letter size (i.e., row).
Figure 4. Visual acuity test results for a representative subject:
measured rate of recognition (RR) values with the fitted psychometric curve as a function of thexletter size.
Investigation of Systematic Errors:
Experiment 1
The purpose of this measurement was two-fold.
First, we intended to verify whether the correlation- based scoring method is suitable for clinical acuity testing at all. Second, because the correlation threshold had been calibrated under special labora- tory conditions, we had to estimate the systematic error to judge if the RR0¼0.68 value can be used in clinical measurements as well.
To obtain accurate and precise data through rapid trials aligned with the clinical standard, we imple- mented a measurement protocol comprising of two stages. The first one rapidly and roughly estimates the quality of vision, whereas the second stage determines the precise visual acuity value. In the first stage, the algorithm examines only one character at every second letter size. The tested optotypes are selected randomly from the original Sloan letter set and are displayed one after another in the middle of a constant white background. This stage ends at the first significant mistake, specifically when the OC value of the displayed-identified letter pair drops below 0.85 (this value corresponds to the confusion of very similar letter pairs, such as C and O).
The second stage starts three letter sizes above the previously determined rough limit and ends one letter size below it, resulting in five measurement points at least. If the RR value achieved at the smallest letter size is still larger than 0.4, then the trial is supplemented with the next two smaller sizes to provide sufficient data for curve-fitting. In this stage, five optotypes are examined at each letter size. The tested character sets comply with those used in the ETDRS 2000 charts,13 and are displayed together in five-letter lines. The spacing between the characters equals the letter size to take the effects of letter crowding into account.6,12 As a validation, we compared the results to the visual acuity values measured by a standard ETDRS chart displayed by the same monitor to keep differences between the measurements at a minimum.
Determination of the Statistical Error:
Experiment 2
Our former laboratory measurements29,33 predict- ed significant statistical error reduction when using the correlation-based method instead of probability- based scoring. With this new experiment, our purpose was to precisely determine uncertainty in standard clinical environment as well. To analyze the variation
of relative error reduction with respect to the number of tested letters, we examined all 10 Sloan characters per letter size.
The protocol starts with the same rough estimation stage as experiment 1. During the second stage, there is not enough space to display all 10 letters in a single line. So, the letters are presented individually, one after another in random order, in the middle of a constant white background. Because the ETDRS charts have only five letters per line, in this experiment we could not use those as reliable reference. Instead, to eliminate any bias, we deter- mined the visual acuity value from the same raw data both by probability- and correlation-based scorings and used the former result as reference.
Subject Pool
The clinical experiments were performed at the Department of Ophthalmology, Semmelweis Univer- sity, Budapest, Hungary, by a qualified ophthalmic clinical officer. The subjects were free of any known eye disease; they had no history of eye trauma, surgery, or any ophthalmic diagnosis other than refractive power error. During the measurements, subjects watched the monitor with one eye, while the other was covered by a transparent but opaque shield (i.e., a diffuser) to keep the pupil diameter at the specific value it is naturally adapted to with both eyes open. Because the two eyes of a person are often strongly correlated,39–41 we determined the monocu- lar visual acuity value only for one eye per subject. We followed the tenets of the seventh revision of the Declaration of Helsinki (2013) in our study.
Experiment 1 was made with the cooperation of 25 subjects (16 women and 9 men, average age of 30 years within a range of 18 to 56 years). For all tests, uncorrected visual acuity was measured, and the subjects were classified into three categories based on their refractive power error: group I, 0 to0.5 D;
group II,0.5 to1.5 D; and group III,1.5 to2.5 D. Group I had 15 members, while group II and III both contained 5 subjects each.
Experiment 2 was made with the cooperation of 14 other subjects (9 women and 5 men, average age of 36 years within a range of 24 to 60 years). For all tests,best-correctedvisual acuity was measured. The refractive power error of the subjects covered the þ1.5 to 6.0 D interval. The refractive power error measurements were taken by a TopCon autorefrac- tor.
Results
Investigation of Systematic Errors:
Experiment 1
The primary objective of this experiment was to compare the visual acuity values provided by prob- ability- and correlation-based scorings (VP and VRR, respectively). To exclude any differences except for the scoring method, we calculatedboth visual acuity values for each subject from the same raw data of experiment 1.VPwas determined by the standardP0¼ 0.5 recognition threshold, whereas in case of correla- tion-based scoring, we applied the formerly calibrated RR0¼0.68 threshold.29 The two acuity values were compared for each person by Bland-Altman analysis, the result of which is shown inFigure 5.
Based on the individual measurement results of all subjects, the average difference between the VP and VRR visual acuity values is 0.01 logMAR (with 60.01 standard deviation), which gives an estimation of the systematic error of correlation-based scoring. A comparative error analysis is presented in the next subsection, revealing that the TRV of the measure- ment equals 0.036 logMAR. From this result, we conclude that the visual acuity values determined by the two scoring methods are equal within the margin of error, which supports the applicability of our method and the adequacy of theRR0threshold in the conventional clinical environment too.
In experiment 1, the tested five-letter lines were displayed separately, whereas in standard ETDRS trials the entire chart is shown to the subject. This may cause some further offset error, so we still have to compare the results of experiment 1 to the
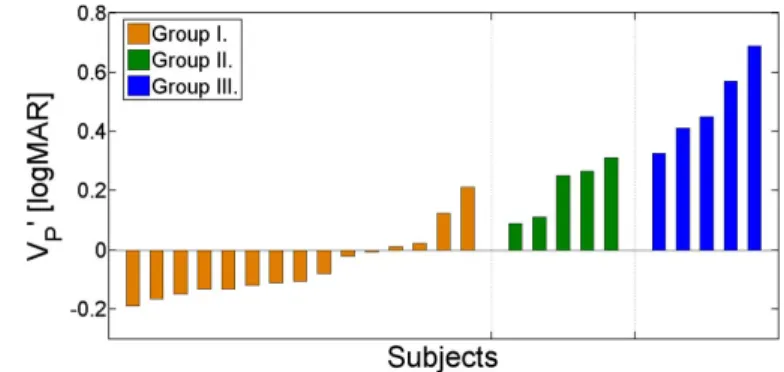
outcomes of the standard ETDRS test. From the Introduction section we know that logistic regression provides the highest accuracy, so we evaluated the ETDRS tests by curve-fitting and used the resulting VP0 visual acuity value as a reference.Figure 6depicts the individual test results for all subjects, grouped by their refractive power error.
To estimate the overall systematic error of experiment 1, we compared the VRR visual acuity values to those obtained by the standard ETDRS test (VP0). The result of the Bland-Altman analysis performed on the VRR and VP0 values is shown in Figure 7.
Based on these results, the average difference between VP0 and VRR equals 0.008 logMAR (with 60.044 standard deviation), which estimates the systematic error of experiment 1 relative to the standard ETDRS test. According to the TRV of standard probability-based visual acuity measure- ments,4,22,23 the values are equal within the margin of error, which means that eliminating interline crowding in our experiment 1 has no effect on the visual acuity results.
Statistical Error of the Correlation-Based Scoring Method: Experiment 2
The primary purpose of experiment 2 was to determine the repeatability error of our new scoring scheme in standard clinical environment. To compare the benefits of correlation-based scoring to the statistical improvement due to the larger number of tested letters, we evaluated our results in four different ways. First, a set of five characters (ran- domly selected from the standard ETDRS quintets) was analyzed by recognition probability at each letter size, which corresponds to the conventional determi- nation of visual acuity (test A1). Second, the same five
Figure 5. Bland-Altman plot of the probability- and correlation- based visual acuity values determined by logistic regression based on experiment 1 (P0 ¼ 0.5 and RR0 ¼ 0.68). Different markers distinguish the examined subject groups, and the mean 6 standard deviation apply for all tested subjects.
Figure 6. IndividualVP0visual acuity values resulted by standard ETDRS trials. Subjects are grouped by their refractive power error and arranged in ascending order by their acuity value.
letters were examined again but with RR taken into consideration (test B1). Third, all 10 original Sloan optotypes were investigated by recognition probabil- ity again (test A2). Finally, all 10 letters were analyzed by taking advantage of RR(test B2). To quantify the precision of the different methods, we compared them by the TRV calculated from the results of 10 consecutive measurements. We performed the error analysis for each subject individually, then averaged the results, which are presented in Table 1.
The decreasing TRV value of the methods indi- cates a well-observable improvement from A1!B1!A2!B2. The error of test A1 (i.e., the conventional approach: five tested letters at each letter size, evaluated by probability-based curve- fitting) is in good agreement with repeatability data presented in the literature: TRV ’ 0.04 logMAR.3,4 The other results demonstrate that both the increased number of tested letters and the application of RR reduce the repeatability error. The former statistically decreases the error by a factor of 21/2 as expected because tests A2 and B2 contain two times as many optotypes at each letter size as tests A1 and B1. The
most important outcome of the experiments is that the application of the correlation-based scoring in itself reduces the error by 19%. Based on our results, by replacing the conventional A1 evaluation with B1, the uncertainty error decreases by 0.0083 logMAR thanks to RR. This significant improvement justifies the extra requirements of the correlation-based approach in the clinical practice.
According to Table 1, the test-retest variability of test B1 approximately equals that of test A2, that is TRV(B1) ’ TRV(A2). This confirms our former statement that the utilization of the correlation-based scoring affects the results in the same way as the duplication of the number of tested letters; however, it does not increase the duration of the test proportion- ally (see next subsection). In our former laboratory measurements,29we examined 26 letters per size, which predicted 28% statistical error reduction when using the correlation-based method instead of probability- based scoring. Now we see that the error reduction is 21%in case of 10 letters and it is 19%with five letters per line. From this finding, we conclude that replacing probability- with correlation-based scoring reduces the repeatability error in a larger extent when more letters are tested at a given letter size.
Duration of the Experiments
When assessing any kind of medical examination performed in vivo on human subjects/patients, the duration of the test is also a key factor, which can even affect the measurement results. To investigate the clinical relevance of our acuity tests, we measured the duration of our computer-based trials and that of the standard ETDRS test. The results together with the main features of the measurements are summarized inTable 2.
One can see that the duration of experiment 1 is increased by only ~10% relative to that of the ETDRS test. Because we gain ~20% improvement in the statistical error with no apparent bias in exchange for only~10%time increment, we infer that our correlation-based scoring scheme implemented in
Figure 7. Bland-Altman plot of the visual acuity values measured by experiment 1 and the standard ETDRS test. The different colors and markers indicate the three examined subject groups, while the mean6standard deviation apply for all tested subjects.
Table 1. Test-Retest Variability (13 Standard Deviation) of the Measurements Corresponding to the Four Different Evaluation Methods
Test ID
Scoring Method
Number of Letters per Sizes
TRV (logMAR)
A1 Probability 5 0.045
B1 Correlation 5 0.036
A2 Probability 10 0.034
B2 Correlation 10 0.027
ID, identifier.
Table 2. Main Features of the Standard ETDRS Test and Our Personal Computer-Based Experiments
Test
Number of Letters
per Sizes Layout
Average Duration
(sec)
ETDRS chart 5 Lines 60
Experiment 1 5 Lines 65
Experiment 2 10 One by one 115
the form of experiment 1 is a useful alternative of standard visual acuity tests. Not surprisingly, exper- iment 2 almost doubles the required time, because these tests were performed by 10 letters per size.
Discussion
Average Psychometric Function of Vision
In experiment 1, we determined the psychometric function (see Eq. [5] and Eq. [6]) of all subjects by logistic regression both for probability- and correlation- based scoring. Curve-fitting performed on the sparse data that visual acuity tests produce (each trial tests five letters per line with 0.1 logMAR size progression) often results in false Heaviside step-like functions forL0(x).
To avoid this, we constrained the maximum steepness bykmax¼35 logMAR1in the regression.22,23Table 3 contains the most important parameters of the average curves together with the mean visual acuity values of the three subject groups we investigated.
As can be seen, the xmp lateral shift parameter nicely correlates to the visual acuity value. According to the definition of the logistic function described in Eq. (5) and Eq. (6), the slope of the L0(x) psycho- metric function is 25/26/4k. Based on the above results, the slope values obtained for the probability- fits are in good agreement with those presented in the literature: 3 to 10 logMAR1.21,24,42 In addition, the shape of the psychometric function definitely flattens with increasing refractive power error, which implies a deterioration in measurement accuracy.22,23Based on the individual results, the slope of the average correlation-based psychometric curve is 1.23 6 0.27 times larger at the 0.5 threshold value than that of the probability-based function. This means that correla- tion-based scoring would exhibit an even smallerTRV if usingRR0¼0.5 as a threshold; however, that would
result in a small offset relative to conventional measurements.
Refractive Power Error and Visual Acuity
To confirm the widespread clinical applicability of the correlation-based scoring method, we also exam- ined the unaided visual acuity value with respect to the refractive power error of the subject’s eye. Based on the results of experiment 1, we depicted the correlation- based visual acuity values of all our subjects as a function of their refractive power error (seeFig. 8).
By applying linear regression to the data, we determined the relationship between the visual acuity value and the RErefractive power error expressed in diopters:
VRR½log MAR ¼mRE½D þc: ð8Þ The parameters of the best-fit line are m¼ 0.34 6 0.02 logMAR/D andc¼ 0.1360.01 logMAR. The m slope parameter that describes the alteration of visual acuity with respect to refractive power error is in good agreement with the numerical value presented in the literature (m¼0.36 logMAR/D),6 which also supports the relevance of the method.
Table 3. Parameters of the Average Best-Fit Logistic Psychometric Functions,awith the AverageVVisual Acuity Value, Both for Probability- and for Correlation-Based Scorings
Subject Group Scoring Method k(logMAR1) xmp(logMAR) V (logMAR)
Group I (RE ¼0 to 0.5 D) Probability 31.3 0.07 0.07
Correlation 32.8 0.08 0.06
Group II (RE ¼ 0.5 to 1.5 D) Probability 27.7 0.23 0.23
Correlation 30.6 0.21 0.23
Group III (RE ¼ 1.5 to 2.5 D) Probability 19.6 0.45 0.45
Correlation 27.1 0.43 0.46
a25/26/4k¼steepness andxmp¼midpoint.
Figure 8. Visual acuity value of the subjects with respect to the refractive power error of their eyes. The different colors and markers indicate the three examined subject groups.
Limitations
For the sake of completeness, the cost of the applied resources has been taken into account. Although our setup requires a computer, it can be almost any kind of personal computer, laptop, or tablet. The experiment does not have high computational demands. Besides, an ultra-high-definition resolution monitor/ophthalmic projector with a maximum pixel pitch of 0.15 mm and a minimum diagonal size of 600 mm is required to test complete five-letter lines from 0.9 to 0.5 logMAR letter sizes from the European standard 4 meters viewing distance, which may slightly raise the costs.
Furthermore, luminance and contrast calibrations have to be performed to fulfill the International Council of Ophthalmology (ICO) standard.17 Along with it, the price of the whole system is about the same as or less than that of an ETDRS chart, which can cost up to $1000.43
Over and above, we have to note that there are always some subjects/patients who do realize that only a limited number of letters are displayed during the visual acuity tests. In their cases, the measurement accuracy could be further enhanced by modifying the 10326-OC matrix to a smaller one containing only the letters really used as responses (down to 10310) and adjusting the theoretical limits, as well as the linear transformation of the psychometric function accordingly (see Eq. [6]). However, because this problem rarely occurs, it is very hard to quantify the resulting residual error. This represents the final limitation of our method, similarly to any curve- fitting evaluation.
Conclusions
To demonstrate and verify the clinical applicability of our correlation-based scoring method, we devel- oped a new computer-controlled measurement setup aligned with the ophthalmological standard for visual acuity testing. As a special feature of our approach, the subject’s individual guesses are recorded during the test. From the OC of the presented-answered letter pairs, the system calculates the subject’s psychometric function by logistic regression and then determines their visual acuity value by thresholding.
Our new method provides more detailed information about the quality of vision than standard recognition- probability-based measurements. We applied differ- ent protocols to determine the systematic error of our scoring method (experiment 1) and to demonstrate its
statistical error reduction relative to the conventional tests (experiment 2).
According to the results of experiment 1, we estimate the systematic error of the correlation-based scoring method relative to probability-based scoring to be 0.01 logMAR. It is significantly smaller than the TRV of the measurements (0.036 logMAR, see experiment 2). This supports the applicability of our new scoring scheme and confirms the adequacy of the formerly calibrated RR0 ¼ 0.68 threshold under clinical conditions. The primary purpose of experi- ment 2 was to assess the formerly predicted repeat- ability error reduction of the correlation-based method in a standard clinical environment too. As logistic regression is the most precise currently existing method, we evaluated our data by curve- fitting. The results indicate that the application of correlation-based scoring further decreases the statis- tical error by~20%relative to standard probability- based approach, which corresponds to the same improvement of repeatability as if the number of letters was doubled in traditional tests.
In conclusion, the protocol we suggest for visual acuity testing decreases the uncertainty by ~20%
without any perceivable systematic error in exchange for only~10%increase in examination time. Thus, it might be a useful alternative in cases when high- precision visual acuity measurements are required, for example IOL design and implantation.
Acknowledgments
We thank the anonymous reviewers for their very constructive comments by which they greatly contrib- uted to the understandability and scientific value of our paper. We thank the Ministry of National Develop- ment (NFM) for the support granted as a competitive- ness and excellence contract for the project ‘‘Medical technological research and development on the efficient cure of cataract’’ number VKSZ-12-1-2013-80.
Supported by the UNKP-18-3 New National´ Excellence Program of the Ministry of Human Capacities.
Disclosure: C. Fulep, (2016). Measuring visual¨ acuity of a client. World Intellectual Property Organization, WO/2018/020281 A1, PCT/HU2016/
000050, patent pending (P); I. Kova´cs, None; K.
Kra´nitz, None; Z.Z. Nagy, None; G. Erdei, (2016).
Measuring visual acuity of a client. World Intellectual
Property Organization, WO/2018/020281 A1, PCT/
HU2016/000050, patent pending (P)
References
1. Shah N, Dakin SC, Whitaker HL, Anderson RS.
Effect of scoring and termination rules on test–
retest variability of a novel high-pass letter acuity chart. Invest Ophthalmol Vis Sci. 2014;55:1386–
1392.
2. Koskin SA, Boiko EV, Shelepin YE. Modern methods of measuring the resolving power of the visual system.J Opt Technol. 2008;75:17–20.
3. Arditi A, Cagenello R. On the statistical reliabil- ity of letter-chart visual acuity measurements.
Invest Ophthalmol Vis Sci. 1993;34:120–129.
4. Vanden Bosch ME, Wall M. Visual acuity scored by the letter-by-letter or probit methods has lower retest variability than line assignment method.
Eye (London, England), 1997;11:411–417.
5. Ferris FL, III, Kassoff A, Bresnick GH, Bailey IL. New visual acuity charts for clinical research.
Am J Ophthalmol. 1982;94:91–96.
6. Rabbetts RB. Bennett and Rabbetts’ Clinical Visual Optics. Oxford, UK: Butterworth-Heine- mann, Elsevier; 2007.
7. Colenbrander A. The historical evolution of visual acuity measurement. Vis Impair Res.
2008;10:57–66.
8. Bailey IL, Lovie JE. New design principles for visual acuity letter charts. Am J Optom Physiol Opt. 1976;53:740–745.
9. Bailey IL, Lovie-Kitchin JE. Visual acuity testing.
From the laboratory to the clinic.Vis Res. 2013;
90:2–9.
10. Levi DM. Crowding—an essential bottleneck for object recognition: a mini review.Vis Res. 2008;
48:635–654.
11. Whitney D, Levi DM. Visual crowding: a fundamental limit on conscious perception and object recognition.Trends Cogn Sci. 2001;15:160–
168.
12. Duane T. Duane’s Clinical Ophthalmology. Phil- adelphia, PA: Lippincott Williams & Wilkins;
2006.
13. Ryan SJ, Sadda SR. Ryan’s Retinal Imaging and Diagnostics. Philadelphia, PA: Saunders, Elsevier;
2013.
14. Kaiser PK. Prospective evaluation of visual acuity assessment: a comparison of Snellen versus ETDRS charts in clinical practice (An AOS
Thesis). Trans Am Ophthalmol Soc. 2009;107:
311–324.
15. Bailey IL, Bullimore MA, Raasch TW, Taylor HR. Clinical grading and the effects of scaling.
Invest Ophthalmol Vis Sci. 1991;32:422–432.
16. Carkeet A. Modeling logMAR visual acuity scores:
effects of termination rules and alternative forced- choice options. Optom Vis Sci. 2001;78:529–538.
17. International Council of Ophthalmology, Visual Functions Committee. Visual acuity measure- ment standard.Ital J Ophthalmol. 1988;II/I:1–15.
18. Westheimer G. Scaling of visual acuity measure- ments. Arch Ophthalmol. 1979;97:327–330.
19. Siderov J, Tiu AL. Variability of measurements of visual acuity in a large eye clinic. Acta Ophthalmol Scand. 1999;77:673–676.
20. Raasch TW, Bailey IL, Bullimore MA. Repeat- ability of visual acuity measurement. Optom Vis Sci. 1998;75:342–348.
21. Hazel CA, Elliott DB. The dependency of logMAR visual acuity measurements on chart design and scoring rule.Optom Vis Sci. 2002;79:788–792.
22. Carkeet A, Lee L, Kerr JR, Keung MM. The slope of the psychometric function for Bailey- Lovie letter charts: defocus effects and implica- tions for modeling letter-by-letter scores. Optom Vis Sci. 2001;78:113–121.
23. Carkeet A, Bailey IL. Slope of psychometric functions and termination rule analysis for low contrast acuity charts. Ophthalmic Physiol Opt.
2017;37:118–127.
24. Norton TT, Corliss DA, Bailey JE. The Psycho- physical Measurement of Visual Function. Ridge- vue Publishing; 2014.
25. Wallis SA, Baker DH, Meese TS, Georgeson MA. The slope of the psychometric function and non-stationarity of thresholds in spatiotemporal contrast vision.Vis Res. 2013;76:1–10.
26. Wichmann FA, Hill NJ. The psychometric function: I. Fitting, sampling, and goodness of fit. Percept Psychophys. 2001;63:1293–1313.
27. Tinning S, Bentzon MW. A new method for exact measurements of visual acuity: determination of threshold curves for the resolving power of the eye by computerized curve fitting.Acta Ophthal- mol. 1986;64:180–186.
28. Horner DG, Paul AD, Katz B, Bedell HE.
Variations in the slope of the psychometric acuity function with acuity threshold and scale. Am J Optom Physiol Opt. 1985;62:895–900.
29. F¨ulep C, Kova´cs I, Kra´nitz K, Erdei G.
Correlation-based evaluation of visual perfor- mance to reduce the statistical error of visual acuity.J Opt Soc Am A, 2017;34:1255–1264.
30. Watson AB, Ahumada AJ, Jr. Modeling acuity for optotypes varying in complexity. J Vis. 2012;
12:19.
31. Shah N, Dakin SC, Anderson RS. Effect of optical defocus on detection and recognition of vanishing optotype letters in the fovea and periphery. Invest Ophthalmol Vis Sci. 2012;53:
7063–7070.
32. McMonnies CW, Ho A. Letter legibility and chart equivalence. Ophthalmic and Physiol Opt.
2000;20:142–152.
33. Erdei G, F¨ulep C. Measuring visual acuity of a client. World Intellectual Property Organization, WO/2018/020281 A1, PCT/HU2016/000050, pat- ent pending.
34. Pelli DG, Robson JG, Wilkins AJ. The design of a new letter chart for measuring contrast sensi- tivity. Clinical Vision Sciences. 1988;2:187–199.
35. Liu L, Klein SA, Xue F, Zhang JY, Yu C. Using geometric moments to explain human letter recognition near the acuity limit.J Vis. 2009;9:26.
36. Hui Z, Guiliang Z, Wang D. Super-Gaussian window function and its applications. In: IEEE Proceedings of 1991 International Conference on Circuits and Systems. Shenzen, China: IEEE;
1991:595–598.
37. Rosser DA, Murdoch IE, Fitzke FW, Laidlaw DA. Improving on ETDRS acuities: design and results for a computerized thresholding device.
Eye (London, England). 2013;17:701–706.
38. Beck RW, Moke PS, Turpin AH, et al. Comput- erized method of visual acuity testing: adaptation of the early treatment of diabetic retinopathy study testing protocol. Am J Ophthalmol. 2003;
135:194–205.
39. Glynn RJ, Rosner B. Regression methods when the eye is the unit of analysis. Ophthalmic Epidemiol. 2012;19:159–165.
40. Rosner B. Statistical methods in ophthalmology:
an adjustment for the intraclass correlation between eyes.Biometrics. 1982;38:105–114.
41. Murdoch IE, Morris SS, Cousens SN. People and eyes: statistical approaches in ophthalmology.Br J Ophthalmol. 1998;82:971–973.
42. Alexander KR, Xie W, Derlacki DJ. Visual acuity and contrast sensitivity for individual Sloan letters.Vis Res. 1997;37:813–819.
43. Brady CJ, Eghrari AO, Labrique AB. Smart- phone-based visual acuity measurement for screening and clinical assessment. JAMA. 2015;
314:2682–2683.
Appendix A
The numerical values of OC, arranged in alpha- betical order, are presented in Table A1. The matrix consists of 10326 cells because the standard ETDRS chart contains 10 different characters, but the subjects
are not supposed to know about this restriction, so they can theoretically identify any character of the 26- letter English alphabet. These numbers are more adequate for clinical practice than those presented in our previous paper,29 where all 26 letters were involved in the measurement.
Table A1. The Numerical Optotype Correlation Values Calculated between the 10 Original Sloan Letters and All 26 Letters of the Extended Sloan Font Type. The Table is Arranged in Alphabetical Order, where Columns Represent the Displayed Letters and Rows Indicate the Potential Identifications
C D H K N O R S V Z
A 0.539 0.592 0.380 0.033 0.343 0.558 0.057 0.255 0.429 0.150
B 0.227 0.695 0.468 0.117 0.253 0.320 0.685 0.798 0.226 0.322
C 1.000 0.435 0.467 0.344 0.251 0.861 0.046 0.152 0.456 0.076
D 0.435 1.000 0.091 0.079 0.172 0.567 0.351 0.448 0.523 0.171
E 0.005 0.497 0.388 0.214 0.166 0.125 0.565 0.629 0.228 0.430 F 0.290 0.218 0.461 0.212 0.148 0.146 0.662 0.333 0.351 0.011
G 0.883 0.441 0.433 0.264 0.142 0.827 0.013 0.165 0.385 0.096
H 0.467 0.091 1.000 0.124 0.583 0.299 0.522 0.172 0.382 0.253 I 0.276 0.090 0.438 0.076 0.252 0.298 0.081 0.167 0.369 0.583 J 0.045 0.271 0.122 0.709 0.067 0.162 0.414 0.023 0.601 0.181 K 0.344 0.079 0.124 1.000 0.320 0.371 0.343 0.068 0.449 0.218 L 0.115 0.343 0.029 0.035 0.018 0.123 0.117 0.012 0.641 0.019 M 0.138 0.193 0.537 0.009 0.437 0.017 0.257 0.119 0.388 0.063 N 0.251 0.172 0.583 0.320 1.000 0.110 0.367 0.019 0.379 0.264
O 0.861 0.567 0.299 0.371 0.110 1.000 0.014 0.209 0.485 0.108
P 0.147 0.296 0.463 0.163 0.152 0.078 0.824 0.369 0.318 0.016
Q 0.789 0.534 0.242 0.274 0.005 0.913 0.081 0.219 0.445 0.069
R 0.046 0.351 0.522 0.343 0.367 0.014 1.000 0.433 0.333 0.081
S 0.152 0.448 0.172 0.068 0.019 0.209 0.433 1.000 0.219 0.287
T 0.439 0.266 0.671 0.301 0.512 0.474 0.228 0.131 0.268 0.167
U 0.146 0.572 0.267 0.244 0.282 0.316 0.038 0.140 0.463 0.172
V 0.456 0.523 0.382 0.449 0.379 0.485 0.333 0.219 1.000 0.162 W 0.141 0.194 0.537 0.261 0.436 0.018 0.458 0.113 0.365 0.064 X 0.498 0.495 0.502 0.045 0.053 0.531 0.241 0.284 0.100 0.167 Y 0.583 0.613 0.708 0.347 0.394 0.612 0.548 0.389 0.049 0.079 Z 0.076 0.171 0.253 0.218 0.264 0.108 0.081 0.287 0.162 1.000