Full Terms & Conditions of access and use can be found at
https://www.tandfonline.com/action/journalInformation?journalCode=rcit20
Current Issues in Tourism
ISSN: (Print) (Online) Journal homepage: https://www.tandfonline.com/loi/rcit20
Impact of COVID-19 on different business models of European airlines
László Kökény, Zsófia Kenesei & Gábor Neszveda
To cite this article: László Kökény, Zsófia Kenesei & Gábor Neszveda (2021): Impact of COVID-19 on different business models of European airlines, Current Issues in Tourism, DOI:
10.1080/13683500.2021.1960284
To link to this article: https://doi.org/10.1080/13683500.2021.1960284
© 2021 The Author(s). Published by Informa UK Limited, trading as Taylor & Francis Group
Published online: 11 Aug 2021.
Submit your article to this journal
Article views: 183
View related articles
View Crossmark data
Impact of COVID-19 on different business models of European airlines
László Kökény , Zsófia Kenesei and Gábor Neszveda Corvinus University of Budapest, Budapest, Hungary
ABSTRACT
In addition to social damage, thefirst wave of the COVID-19 pandemic also caused huge economic losses in the beginning of 2020, especially for companies in the tourism sector. The airline market was no exception.
This study examines the significance of the business model of European listed airlines –low cost carriers (LCCs), full service carriers (FSCs)–for stock market performance. We use event study on the 11 airlines included in the sample. In terms of cumulative average abnormal returns, i.e. the most significant deviations from expected returns, negative phases can be detected in the entire and third stage of the pandemic.
FSCs performed significantly better than LCCs at the time of the pandemic on 24 February, when European stock markets suffered the most damage; the business model overwrotefinancial indicators during the toughest period of the crisis. Although most LCCs had higher cash/
assets ratios, they still produced worse results than the average performance of companies with lower cash/assets ratios. This analysis helps to ensure that, in addition to examining financial indicators, the enumeration of the business model in this industry can also be decisive.
The future possibilities of the research are discussed at the end of the study.
ARTICLE HISTORY Received 14 May 2021 Accepted 21 July 2021
KEYWORDS
COVID-19; low-cost carriers;
full-Service carriers; business model; cash; event study
1. Introduction
In addition to its wider human and societal impact, the COVID-19 pandemic also caused serious economic damage. Due to the high volume of human transactions involved, the travel industry has always been highly susceptible to social and economic upheaval, and the effects of the current crisis have been dramatic. Safety and security are among the most important factors affecting travellers’ decisions. With the decrease in the perceived safety of travel due to health risk concerns, the volume of travel decreased rapidly even in the opening stages of the pandemic (Iacus et al.,2020). In the United States,firms active in the travel industry were among those that suffered the strongest stock price declines in the earliest stages of the crisis (Ramelli & Wagner, 2020). This period was characterized by the cancellation of international conferences and long-dis- tance travel engagements. Later on, more and more countries closed their borders to travellers from COVID-19-afflicted countries.
In investment markets, information is one of the most important factors. Investors take present and past information into account to estimate expected future returns. In many scenarios, such 9/
11, the collapse of Lehman Brothers, or simply the publication of a quarterly report, examining inves- tor behaviour is straightforward, as the event concerned (whether positive or negative) is obviously
© 2021 The Author(s). Published by Informa UK Limited, trading as Taylor & Francis Group
This is an Open Access article distributed under the terms of the Creative Commons Attribution-NonCommercial-NoDerivatives License (http://
creativecommons.org/licenses/by-nc-nd/4.0/), which permits non-commercial re-use, distribution, and reproduction in any medium, provided the original work is properly cited, and is not altered, transformed, or built upon in any way.
CONTACT László Kökény laszlo.kokeny2@uni-corvinus.hu https://doi.org/10.1080/13683500.2021.1960284
anchored to a well-defined point in time. The terror attacks on 11 September 2001, for example, have been shown to have had ripple effects in Europe, Asia, and Australia and an instantaneous, direct effect on North America (Alderighi & Cento, 2004; Carter & Simkins,2004; Drakos,2004; Flouris &
Walker,2005; Gillen & Lall, 2003; Kim & Gu,2004). The Ebola and SARS pandemics have mostly had indirect effects on the travel industries of America, Europe, Asia, and Australia (Henderson, 2004; Zeng et al.,2005).
The effect of the COVID-19 crisis on the European airline market has a very different and more complicated temporal signature. Due to an abundance of information and the incremental spread of the virus, it is hard to identify a single point in time where investors might have received a strong information shock that would have informed their business decisions. Instead of a single event, we mostly have a chain of events. Based on the magnitude of their effects, the whole obser- vation period can be divided into subperiods. As previous crises did not have this kind of periodicity, such afine-grained analysis is a novel approach.
The focus of this paper is thefinancial analysis of the economic crisis caused by thefirst news of the pandemic in 2020, in a specific part of the economy, namely the airline industry. Applying the methodology of event study, we analyse the difference between expected and actual stock price returns of European-listed airlines. All 11 European-listed airlines are included in the sample.
Thesefirms are regional or intercontinental multinational companies, each with several subsidiaries.
Our analysis of thefirst pandemic period 2 January to 20 March 2020 revealed a key date (24 Feb- ruary 2020), when the whole European stock market collapsed.
The key date of the study is primarily connected to events in Italy. On 21 and 22 February 2020, mass outbreaks were reported from Lombardy (https://www.businessinsider.com/coronavirus- airlines-that-failed-bankrupt-covid19-pandemic-2020-3; https://samchui.com/2020/05/10/covid-19- a-list-of-retired-aircraft/#.XtUF4jozZhE). In addition to looking at the effects of a single event (24 Feb- ruary 2020), following Ramelli and Wagner’s (2020) suggestions that the COVID-19 crisis should be analysed as a chain of events, we divided the timeframe of our analysis (2 January 2020–20 March 2020) into three subperiods, hereafter Incubation, Outbreak, and Fever. This division enabled us to measure the various effects of the crisis in its different stages. It is the unique nature of the current crisis that makes thefindings of this investigation a significant new contribution to the exist- ing literature, as the COVID-19 crisis displayed both ripple effects and direct effects with regard to the travel industry in Europe (Maneenop & Kotcharin, 2020; Ramiah & Graham, 2013; Zopiatis et al., 2019).
We divided our sample offirms into subsamples based onfinancial and business model aspects.
Thefinancial clustering is based on the cash/assets ratio (which is a proxy for liquidity), while the business-model-based clustering reflects whether the airline is a full-service carrier (FSC) or a low- cost carrier (LCC). In this paper, we explore variations in the abnormal and actual stock returns, as well as the differences between the clusters defined using thefinancial-based factors and business model.
In Section 2, we introduce our set of hypotheses, focusing on the potential clustering of airlines based onfinancial and business-specific characteristics, and also on the experiences and lessons of earlier crises and their effects on the airline industry. In Section 3, we discuss the applications and previous results of event studies applied to the airline market. After this, we present our database, the methodology of sampling, the variables examined, and the equations representing the under- lying calculations. In Sections 4, 5, and 6, we summarize the most importantfindings and their implications.
2. Theoretical background and hypotheses
This section includes a summary of the literature of the effects that COVID-19 has had on the travel industry and of the effects of previous crises on airline markets. We introduce our set of hypotheses and discuss the characteristics of airlines and how these can be utilized to create clusters of airlines.
2.1. The effects of the pandemic on the stock market performance of airlines
In this section, we introduce our set of hypotheses and discuss them in light of the literature on the economic effects of earlier crises. The majority of relevant studies explore the effects of the 9/11 ter- rorist attacks in the USA and their aftermath, either looking at individual airlines or specific categories of airlines (defined in terms of operational,financial, or risk indicators). On thefirst trading day after the attacks, 17 September 2001, stock markets took a dive, and airline shares were heavily traded. In this period, Carter and Simkins (2004) found significant negative abnormal returns in the case of all domestic carriers in their sample, and smaller negative abnormal returns in the case of air cargofirms and international carriers. Thesefindings suggest that the market consensus was that the long-term effects of the attacks would be more significant for US domestic carriers, and less significant for inter- national air cargofirms and airlines. A crisis can be segmented either temporally and/or geographi- cally in terms of the losses caused. Gillen and Lall (2003)find that in thefirst months after the 9/11 attacks, stock returns of airlines fell very heavily in North America, less heavily in Asia, and some- where in between these two extremes in Europe. The trajectory of recovery was also closely con- nected to regional exposure.
While the impact of the crises of recent decades on capital market performance has been ana- lysed by many, the effects of COVID-19 are still being explored. One of the few studies to address the impact of the pandemic on stock markets (not only airlines) is Ding et al.’s (2021) research on the connection between corporate characteristics and stock price reactions. They found that the drop in stock prices was more severe for companies with weakerfinances (less cash, more debts) and with global supply chains and customer locations. Ru et al. (2021) realized that in countries where the SARS experience was stronger, stock market drops were steeper. One of the first studies that examined the effect of COVID-19 on airlines’stock market prices, is the study by Man- eenop and Kotcharin (2020), which examined the performance of airlines with event study. Based on their results, to examine the impact of the pandemic, it is indeed worthwhile to break down the period of the pandemic and that the end of February 2020 was the time when the most dramatic impact was detected.
Ramelli and Wagner (2020) also argue that the COVID-19 pandemic should be analysed as a chain of events rather than a single event, and should be divided into periods. As far as the effects on Europe are concerned, they divided the pandemic into three periods. Thefirst is the period of Incu- bation (2–17 January 2020). Cases of COVID-19 in Wuhan, China, werefirst reported to the World Health Organization (WHO) on 31 December 2019. Thefish market suspected to be the source of the virus was closed on 1 January 2020, and thefirst day of trading following these events was 2 January 2020. The closing date of the first period can be connected to several landmark events.
On 17 January, an elderly lady arriving from China was diagnosed in Bangkok with COVID-19, marking the spread of the pandemic beyond China’s borders (https://www.flightglobal.com/
strategy/iata-deepens-projected-airline-revenue-loss-to-314-billion/137872.article). On the same day, a high-ranking regional official, the head of the Hubei State-owned Assets Supervision and Administration Commission (SASAC), succumbed to the disease (https://www.nytimes.com/2020/
01/15/world/asia/coronavirus-japan-china.html), and on 19 January, the first COVID-19 patient outside Hubei province was diagnosed in China (https://www.rfa.org/english/news/china/flights- 01292020125033.html/). The identification of the first patient in Europe was announced on 21 January in France (this preliminary announcement was confirmed on 24 January) (https://news.
sina.com.cn/c/2020-01-20/doc-iihnzahk5231837.shtml). The second subperiod, Outbreak, lasted from 20 January to 21 February 2020. The endpoint is primarily connected to events in Italy. On 21 and 22 February, mass outbreaks were reported from Lombardy (https://www.lefigaro.fr/
sciences/coronavirus-trois-premiers-cas-confirmes-en-france-20200124; https://www.reuters.com/
article/us-china-health-italy/coronavirus-outbreak-grows-in-northern-italy-16-cases-reported-in- one-day-idUSKBN20F0UI; https://www.corriere.it/cronache/20_febbraio_22/coronavirus-italia-nuovi- contagi-lombardia-veneto-245e72d4-5540-11ea-8418-2150c9ca483e.shtml). Finally, the third period,
Fever, lasted from 24 February until 20 March 2020. In mid-March, national borders within Europe were practically closed down, which brought cross-border air travel to a halt (EC,2020). In our analysis, we will examine the entire pandemic period as well as the three subperiods separately.
As a starting point of our research, we propose that airlines exhibited significant negative abnor- mal returns within the period of the pandemic (2 January to 20 March 2020), while the third subper- iod, Fever,caused the highest drop, thus, 24 February will be examined as the event day.
Event studies usually observe the effect of the specific event on the whole market (Maneenop
& Kotcharin,2020). On the other hand, Gong et al. (2006) suggest that it is possible that the sample as a whole does not possess significant content, thus it is worth differentiating the sample companies on the basis of relevant characteristics. Following this suggestion and based onfindings from past crises, we believe that the effect of the COVID-19 events should be separ- ated for different types of airlines. In our analysis, we selected two criteria for clustering airlines.
Thefirst is afinancial-model-based characteristic, the second is a business-based one. In the next section, we present howfinancial and business characteristics effect the performance of airlines during and after crises.
2.2. The effect offinancial indicators of carriers on stock market performance
The airline industry is very capital-intensive. As a result, several carriers have a leverage above 50%, which means that their exposure to externalfinancing is very high. Researchers have pointed out that airlines with higher adjustment costs are less flexible in their reaction to a crisis and their focus is more long-term, whereas airlines in a bad generalfinancial situation shift their focus to the short-term (Alderighi & Cento, 2004). The authors argue that following the 9/11 terrorist attacks, short-term losses were due to a decrease in demand, the cancellation of certain destinations, and the resulting decrease in the number offlights. In the longer term, however, the pre-crisis level of profitability was the strongest predictor of the degree of decline or regeneration. Smit (1997) points out that long-term profitability is the function of the following critical factors: financial strength, cost structure, domestic market participation, the size of the operation, internationaliza- tion, and political support. Keown et al. (2001) show that higher leverage (combined with a higher level offixed costs resulting in a more rigidfinancing structure) leads to an increased level of overall risk. Kim and Gu (2004) argues that the most important goal of airlines should be decreas- ing their leverage, as this is a key determinant of their chances of a swift rebound on the stock market. Kim and Gu (2004) claim that the significant increase in total and systemic risks of airlines after the 9/11 terrorist attacks is due to potential investors having increased the risk premium on airline stocks, thereby placing additional pressure on stock prices, increasing leverage, and making a rebound even more difficult. Drakos (2004) also registered an increase in systemic risk, pointing out that firms that are more exposed to external risks are typically the first to be affected by a crisis and among the last to recover from it, whether the external risks are of a financial (high leverage) or an operational nature (inflexible cost structure, a broad palette of additional services, etc.). In sum, the literature discussed points out that the key to aflexible reaction to a crisis is maintaining aflexible, simple, and transparent cost structure and relatively low leverage (i.e. a higher degree of internalfinancing, including adequate cash reserves). As afirst result on the pandemic situation, Ding et al. (2021)find that companies that have weakerfinancing (lower cash, higher debt) suffer a more severe stock price drop. In times of crisis, companies are more willing to increase their cash holdings (Ozkan & Ozkan,2004); on the one hand, as a precautionary measure, to be able to respond moreflexibly to the constraints of the emergingfinancial crises, and on the other hand, to avoid transaction costs. Corporate cash/assets ratios are used to seize emerging profitable investment opportunities and meet unforeseen events (Bates et al.,2009). Caution is also important because capital markets do not function effectively during such transition periods and bank lending also winds down (Lian et al.,2011). Prosperity may also be higher for those who increase their cash holdings, as thesefirms increase their role in research and development, which is strongly linked to
mitigation of uncertainty, especially in the long run (Sánchez & Yurdagul,2013). This feature can have a positive effect on investors.
These results and considerations lead us to assume that airlines with a higher cash ratio have suffered smaller losses than their peers in the observation period of the pandemic.
H1: Airlines with a higher cash ratio had a better performance than their peers in terms of cumulated average abnormal daily stock returns on the event day.
2.3. The effect of the carrier’s business model on stock market performance
In terms of business models, airlines can be divided into two main categories: FSCs and LCCs. Due to a policy of deregulation, competition has increased dramatically within the EU since around 2000 (Gillen & Ashish,2004), which has resulted in a decrease in costs, fees, and prices (Hunter, 2006).
FSCs and LCCs differ markedly in terms of their business model (Dobson & Piga,2013). FSCs are typi- cally used by organized travellers who make their bookings indirectly through travel agencies, while LCCs are favoured by those involved in mass tourism who manage their bookings individually in search of bargain prices (Barrows,2019). Because of this, LCCs pursue a strategy of cost minimization and aggressive pricing, with a streamlined palette of supplementary services.
Air travel is a dynamically growing industry, especially due to the explosive growth of the low-cost segment. In the 28 countries that made up the European Union in 2018 (EU28 with the UK), there were about 1.1 billion passenger journeys that year (Eurostat, 2019), out of which a little more than 500 million journeys were with LCCs, which represents a year-on-year growth of 7.4%. This segment is growing dynamically. Between 2013 and 2018, the number of journeys per annum with LCCs increased by more than 300 million, with year-on-year growth ranging between 11%
and 13%, and only slowing to a still significant 7.4% in 2018 (Anna Aero, 2018). In terms of revenue, the LCC market share is somewhat lower: 36.3% as of 2018. The largest players are Ryanair (139 million passengers), easyJet (98 million passengers), and Norwegian Air Shuttle (42 million passengers). The LCC market share is especially high in Eastern and South-Eastern Europe (North Macedonia, Slovakia, Hungary, Romania, Lithuania, and Bosnia–Herzegovina) where it exceeds 60% (Anna Aero,2018).
Flouris and Walker (2005) argue that analysing FSCs and LCCs separately is justified as they are markedly different in their operation and management practices, such as adopting a viable strategic position, leveraging organizational capabilities, and reconceiving the value equation. LCCs have an advantage in all three dimensions as their pricing strategies are more efficient and theirfleets are highly standardized (typically a single type of either Boeing or Airbus aircraft). Their destination struc- ture and their use of secondary airports result in significant cost savings and their sales strategies are more efficient. Zorn (2001) proposes that LCCs are more recession-proof due to their lower cost levels and the higher share of variable costs within their cost structure, and also because LCCs are increas- ingly used by professional travellers in addition to tourists. However, Zorn (2001) only compared one LCC (Southwest) with two FSCs (Northwest and Continental), thus, based on this small sample, it is not clear, whether this result is the effect of the strongfinancial position (higher cash/assets ratio, lower level of external financing) or the business model. Contrary to Zorn (2001), Zhang et al.
(2021) emphasize that it is important to differentiate between operational andfinancial performance.
They conclude that while LCCs maintain higher business-based performance, FSCs earn higher per- formance scores based on stock market indicators. Yun and Yoon (2019) confirm this result. They state that increases in petroleum prices have a significantly higher negative affect on smaller-sized airlines, as they are more exposed to such external shocks.
Thesefindings led us to formulate the following hypothesis. While both LCCs and FSCs suffered significant negative abnormal returns in the whole observation period of the pandemic (2 January to 20 March 2020), LCCs suffered higher negative abnormal returns than FSCs as a result of the selected event day, 24 February 2020.
H2: Low-cost airlines suffered significantly higher losses than full-service airlines on the event day, as expressed in cumulated average abnormal daily stock returns.
3. Methodology
In this section, we present the data and variables which form the basis of the analysis. We also discuss the method of sampling and the main characteristics of our sample. This is followed by a discussion of the analytical tools and techniques applied. Central to our analysis is the methodology of event study.
3.1. Applying event study to the air travel market
To investigate the effects on afirm of a certain event or piece of information, stock markets provide an ideal observatory in many ways. In the course of the event study, the time period under investi- gation is divided into two parts: the estimation window and the event window. The estimation window is used to model the normal behaviour of a stock return, while the event window is the time period observe the stock returns compared to its normal behaviour. These two time windows must not overlap and the event window usually starts a few days before the actual event. Thefirst detailed and complete description of methodology of event study is due to Fama et al. (1969). Later Mackinlay (1997) and Binder (1998) provide a detailed survey of the method. A cornerstone of the event study method is the assumption of the efficient market hypothesis [famously not shared by the behavioural finance school of thought (Hirshleifer, 2001)], which states that stock prices reflect all the available information to market participants. Event studies are applicable to the measurement to any kind offinancial or accounting performance and have been used widely in recent decades (e.g. Carter & Simkins,2004; Gillen & Lall,2003; Gong,2007; Man- eenop & Kotcharin,2020; Tsai et al.,2008).
Airline markets have also been analysed using event studies. Gong (2007) found that airlines that filed for bankruptcy protection exhibited significant positive average abnormal returns in the three- year period after thefiling, which suggests that it might actually be rational to invest in such airlines.
Tsai et al. (2008) showed that the announcement of a newflight route has a significant positive abnormal return effect, especially in the short run. If several carriers announce the same new flight route, it also matters which of them is the first to make the announcement. The aftermath of the 9/11 terrorist attacks was also examined in an event study framework by (Carter & Simkins, 2004). The authors found that generally speaking, airlines with higher cash reserves suffered smaller losses in terms of abnormal returns; however, this effect practically disappears if one looks at smaller firms, which suffered significant negative abnormal returns even if their cash ratios were high. Gillen and Lall (2003) looked at abnormal returns and found that the 9/11 terrorist attacks had an immediate negative impact on US airlines and indirect ripple effects on the inter- national air traffic market. Additionally, the authors also pointed out that LCCs (e.g. Ryanair) recov- ered significantly faster (in terms of returning to the pre-crisis level of expected returns) than FSCs (e.g. United Airlines or American Airlines). Maneenop and Kotcharin (2020) also examined the per- formance of airlines during thefirst wave of the COVID-19 pandemic with event study. Globally, attempts were made tofind significant abnormal returns at three different times of events. It was seen that the March airspace block announced by President Donald Trump had the strongest impact, causing airlines to perform significantly negatively.
3.2. Data
For the research, we compiled a database of the end-of-day stock prices of airlines headquartered in Europe and primarily registered in the European stock exchange from 2 January 2019 until 20 March 2020. For each airline, we included three variables: unadjusted price, total volume, and total
return index. To derive market return for each airline, we used the share index of its primary exchange for the same period with daily frequency. Non-trading days and days when the shares of the given company registered no trading were excluded. We registered 249 trading days per company in 2019 for the estimation window. The event day was 24 February 2020. We measured five different event windows [0;0], [−2;2], [0;2], [0;5], [1;5] and one window before the event [−5;
−1]. The data were drawn from Thomson Reuters Refinitive Eikon.
Additionally, we also collectedfinancial variables to characterize the underlyingfinancing profile of each airline, and test our hypotheses. We downloaded the balance sheet, profit and loss, and cash flowfigures as well as otherfinancial ratios from investing.com for the year 2019 in a quarterly break- down. The balance sheet variables used included total assets, total current assets, cash, cash and short-term investments, and cash and cash equivalents from the assets side. From these indicators, we derived the cash/assets ratio (%).
3.3. Sample characteristics
The sampling was based on airlines headquartered in Europe and primarily registered in a Euro- pean stock exchange. The sample included 11 companies (Air France-KLM, Wizz Air Holdings, Ryanair Holdings, International Airlines Group, easyJet, Deutsche Lufthansa, Aeroflot Russian Air- lines, Norwegian Air Shuttle, SAS, Aegean Airlines, and Finnair), whose returns were available for the period considered. Some of these companies own more subsidiary airlines, even if these sub- sidiaries do not use the parent company’s brand name. The parent companies that own such sub- sidiaries are Air France-KLM, Ryanair Holdings, International Airlines Group, Deutsche Lufthansa, Aeroflot Russian Airlines, and Aegean Airlines. In the analysis we took into consideration the parent company’s stock results.
In the interpretation of the results, it is important to take into account thefinancial situation of the companies in 2019, on the basis of which additional clusters can be formed within the sample.
During the analysis, clusters formed on the basis of the calculated indicator (cash/assets ratio) are calledfinancial-based clusters. Thefinancial characteristics are summarized inTable 1.
Based on the second hypothesis of the research, the differentiating element is the LCC and FSC nature of the airlines that serves as a segmentation criterion in the analysis. The LCCs include four European companies (Wizz Air Holdings, Ryanair Holdings, easyJet, and Norwegian Air Shuttle) based on the International Civil Aviation Organization 2020 list (ICAO,2004).
Regardless of clustering, we took the price index of the primary stock exchange market return, as mentioned earlier. Based on the sampling, we assigned the market returns to the 11 companies.
Most are listed on the London Stock Exchange (FTSE All Share), while Ryanair Holdings, which is Irish-based, is listed on another UK market. Overall, most companies are listed on a stock exchange appropriate to their nation.
Table 1.Sample characteristics by mainfinancial indicators.
Company Cash/assets ratio overall average, 2019 Market index
Aegean 0.4 ATHEX COMPOSITE
Aeroflot 0.04 MOEX RUSSIA INDEX
Air France-KLM 0.15 FRANCE CAC 40
easyJet 0.2 FTSE ALL SHARE
Finnair 0.25 OMX HELSINKI (OMXH)
International Airlines Group 0.22 FTSE ALL SHARE
Lufthansa 0.08 DAX
Norwegian Air Shuttle 0.04 OSLO ex
Ryanair 0.26 EURO STOXX
SAS 0.21 OMX STOCKHOLM (OMXS)
Wizz Air 0.35 FTSE ALL SHARE
Note: Cash/assets ratio is calculated by dividing the amount of cash and short-term investments by the total assets based on the investing.com database.
To distribute companies into thefinancial-based cluster, we employed a median-split on a cash/
assets basis, according to whether they had a ratio above or below the median (22%) positioned on the average for the 2019 quarters. The groups offinancial-based and business-based clustering are summarized inFigure 1. Groups were compared with each other using industry indices instead of market indices (Mackinlay,1997). With this method we can measure the differences between the abnormal returns of one group (e.g. LCCs) and the actual return offirms with a similar industry (in this case, the FSCs). The group membership is listed inFigure 1.
3.4. Measuring instruments
First, daily returns were calculated in natural logarithm (Equation 1) based on the total return index (adjusted with dividends and change in the number of common shares outstanding). Second, market returns are calculated in a similar way from the stock market indices of an exchange (Equation 2).
Third, we also create industry group indices (Equation 3) of the relevant benchmark groups’daily returns (e.g. for the higher than the median C/A ratio group, the benchmark was the lower than median C/A ratio group’s average daily returns (for the LCCs it was the FSCs’daily returns)).
Ri,t=ln TRIi,t
TRIi,t−1
(1)
Rm,c,t=ln Pc,t
Pc,t−1
(2)
Rind,t=
N
i Ri,t
N (3)
Figure 1.Financial-based and business-based clusters. Note: LCC = Low Cost Carriers; FSC = Full Service Carriers; IAG = Inter- national Airlines Group; C/A = Cash per Assets ratio.
whereRi,tis the log daily return of onefirmion dayt,TRIi,tis the total return index for companyion dayt,Rind,tis the industry group daily indices which is the average return of the stocks belonging to a given group, andRm,c,tis the stock market daily index for countrycon daytandPm,cis the market price index for countrycon dayt.
We perform the following steps to test our hypotheses. First, we estimate an expected return model for each corporate using the daily return data of the estimation window. Second, based on this model, we can generate the expected return for eachfirm during the event window. These esti- mates can capture the expected returns if the event had not occurred. Third, we define abnormal return as the difference between the realized return and the expected return during the event window. These abnormal returns capture the impact of the event compared to the case when the event had not occurred. Finally, we calculate the statistical significance for each abnormal return to show the statistical robustness of the results.
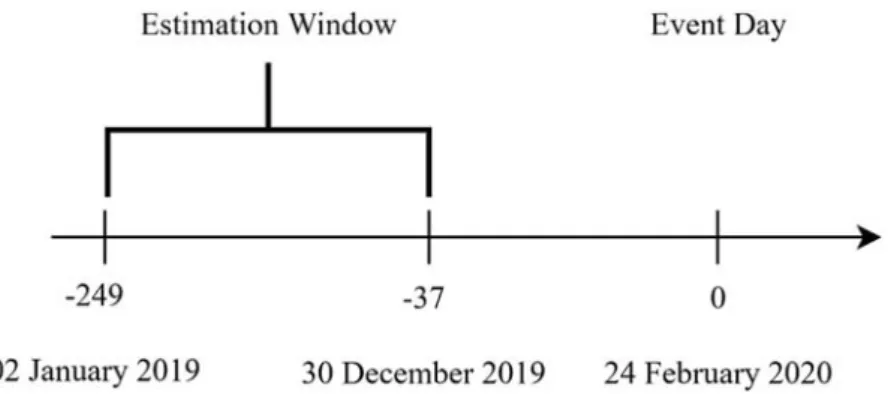
To estimate an expected return model for a corporate, we apply the market model, one of the most used expected return models in event studies (Binder, 1998; Hadi et al., 2020; Mackinlay, 1997). We also define our estimation window (T0→T1 inFigures 2and3) and event window (T1
→ T2 in Figures 2 and 3). We use the full year of 2019 for estimating the model (estimation window) and we set a−5, 5 window around the event yielding several different specification of event windows ([0], [−2;2], [0;2], [0;5], [1;5] and [−5;−1]) for providing insights on our results.
To calculate the expected corporate return (ERi,t), we calculated the parametersαandβof the regression estimation for market model using the estimation window (4).
ERi,t= ai+biRm,t+1t (4)
Figure 2.Time plane of analysis focusing on the main event day.
Figure 3.Time periods of the analysis focusing on the wholefirst wave and its periods.
We then subtracted the result of the expected return (which comes from the product of theα constant and the added multiplicatedβparameter and market return) from the actual corporate returns (5). This is how we got abnormal returns on a daily basis (Binder,1998).
ARi,t=Ri,t−ERi,t (5)
Similarly to the market model, we also generated abnormal returns compared to a reference group (industry). In this case, we use the industry return instead of the market return and we repeat the same steps described above.
To generate statistical tests, The squared abnormal returns were added and the variance (6) of this sum was calculated by including all daily data per firm (Mi) for the estimation period examined (Binder,1998). We then calculated the AR t-test (7) for the event day [0].
s2AR
t= 1
Mi−2 T1
t=T0
(ARi,t)2 (6)
tuARi,t =ARi,t
sARt
(7) To provide results and their statistical significance for more than one day time period, we created cumulative abnormal returns (CAR) by summarizing the abnormal returns of the event periods (8), where T1and T2represent the start and end of the event window. From this, significant differences per companies could already be calculated, i.e. we examined whether the cumulated abnormal returns follow a normal distribution with zero expected value (10) (Mackinlay,1997).
CARt,i=T2
t=T1
ARi,t (8)
s2CARt=L2s2ARt (9)
tuCAR=CARi
sCAR
(10) We took the full 2020 data set as the event window because Ramelli and Wagner (2020) suggest that the pandemic period can be divided into longer or shorter periods at this stage, based on which it turns into a series of events. We calculated not only abnormal returns, but we also calculated, plotted, and tested cumulative average abnormal returns (CAAR) for different corporate clusters.
The first of the three subperiods is the Incubation period, which lasted from 2 January to 17 January 2020. The second subperiod, Outbreak, lasted from 20 January to 21 February 2020, while the third subperiod, Fever, lasted from 24 February to 20 March 2020 placed according to Ramelli and Wagner (2020). Overall, this means 57 trading days. The estimation period was the full year of 2019, as previously indicated.
CAARt= T2;N
t=T1;i=1CARt,i
N (11)
s2CAARt= 1 N−1
N
i=1
(CARt,i(T1,T2)−CAARt)2 (12)
tuCAAR=
√NCAARt
sCAARt N(0, 1) (13)
Figures 2and3summarize the temporality of the research. InFigure 2, the key date is displayed, while inFigure 3, the three sections are displayed with the period dates.
4. Results
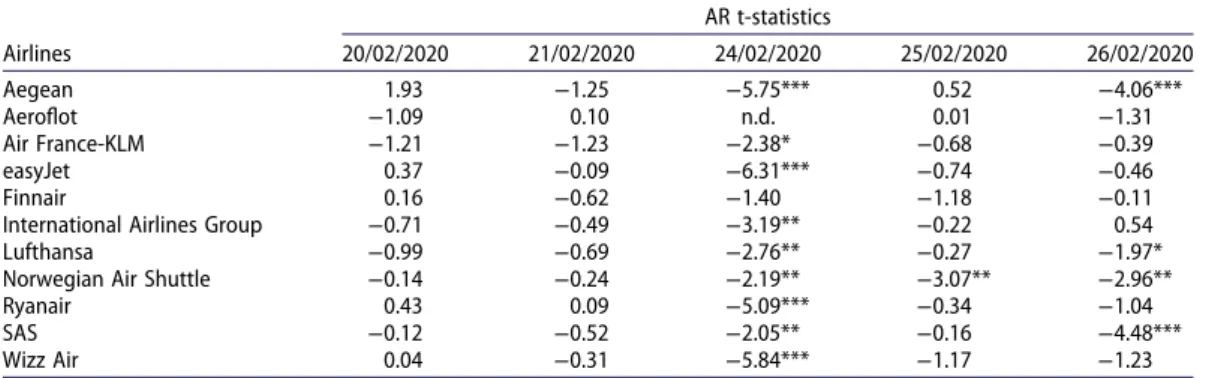
We examined the development of cumulative returns in the entire period, from 3 January 2020–20 March 2020, and in the three subperiods. Based on the data, it can be seen that on thefirst day of the third subperiod, 24 February 2020, a more significant fall occurs (Tables 2and3). Based on an exam- ination of the cumulative average abnormal returns for each stage (Table 3), the third subperiod is critical. It determines the performance of the entire period, while in thefirst subperiod there were significantly positive performances compared to expectations.
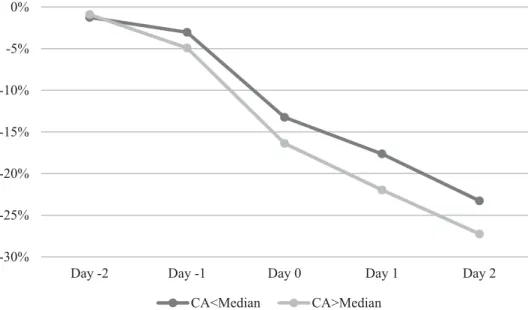
Based on these calculations, it can be said that in the case of thefinancial-based grouping, almost every member of the high-cash group produced significantly worse abnormal returns on 24 February and in subsequent periods of different lengths (Table 4). IAG, Finnair (both FSCs) and Ryanair have relatively fewer significant differences or none at all. In addition, it is even more striking that the picture is not so negative in the intervals viewed from 25 February (day 1), and the larger the interval we look at from day 0, the more the situation improves (Figure 4). This may be because some lower- cash/assets ratios FSC airlines (e.g. Lufthansa and SAS) produced significantly negative abnormal returns a few days after the key date. In addition, this result confirms the assumption that companies with higher cash/assets ratios performed better than those with lower cash/assets ratios in the long term, but in the short term, this is not true. Indeed, among LCCs, both Ryanair and Wizz Air suffered significantly negative abnormal returns for a shorter period of time (Table 5) than easyJet, which had a smaller cash/assets ratio, or Norwegian Air Shuttle, which had a very low cash/assets ratio and pro- duced the worst results (Table 1).
We performed additional calculations, based on which it can be concluded that LCCs, both indi- vidually and collectively, performed significantly worse than FSCs (Table 5). As shown inFigure 5, LCCs were able to post larger losses on the key date than FSCs in terms of cumulative returns.
This result stabilized in the next few days; it did not bounce back. Norwegian Air Shuttle’s
Table 2.AR t-test statistics around the key date (24 February) for the total sample.
AR t-statistics
Airlines 20/02/2020 21/02/2020 24/02/2020 25/02/2020 26/02/2020
Aegean 1.93 −1.25 −5.75*** 0.52 −4.06***
Aeroflot −1.09 0.10 n.d. 0.01 −1.31
Air France-KLM −1.21 −1.23 −2.38* −0.68 −0.39
easyJet 0.37 −0.09 −6.31*** −0.74 −0.46
Finnair 0.16 −0.62 −1.40 −1.18 −0.11
International Airlines Group −0.71 −0.49 −3.19** −0.22 0.54
Lufthansa −0.99 −0.69 −2.76** −0.27 −1.97*
Norwegian Air Shuttle −0.14 −0.24 −2.19** −3.07** −2.96**
Ryanair 0.43 0.09 −5.09*** −0.34 −1.04
SAS −0.12 −0.52 −2.05** −0.16 −4.48***
Wizz Air 0.04 −0.31 −5.84*** −1.17 −1.23
Note: ***:p< 0.001; **:p< 0.01; *:p< 0.05. n.d.: No data was released for that day, only 02.21 was left in place.
Table 3.Cumulative average abnormal daily returns and standard deviations of total sample, and CAAR t-test statistics with critical values over the entire and three periods of the pandemic.
T1 T2 CAAR% sCAAR% tθ
03/01 20/03 −32.9 6.29 −5.23***
03/01 17/01 4.21 1.62 2.61*
20/01 21/02 −1.98 1.61 −1.23
24/02 20/03 −35.13 7.58 −4.63***
Note: ***:p< 0.001; **:p< 0.01; *:p< 0.05. T1and T2are the start and end dates of the full and three periods of the event window. CAAR% = Cumulated average abnormal return per group over different periods, as a percentage. SCAAR% = Standard deviations of cumulative average abnormal returns over groups over different periods, as a percentage.
performance alone was very poor in each of the event windows examined. The robustness of the events is shown by the fact that there were no significant differences or standard deviations [−5;
−1] before the event, and it seems that we are not talking about an effect before it, because the fall begins from [0; 0], 24 February.
Based on the results (Tables 4and5), we were able to accept Hypothesis 2, while we were not able to accept Hypothesis 1. While the LCCs actually performed worse than the FSCs as we expected, the airlines with higher cash performance did not perform better on the day of the event than the airlines with lower cash/assets ratios. Most of all, the nature of the business model seems to have overstated our expectations in terms of the level of cash/assets ratios. Other- wise, among the LCCs, those with higher cash/assets ratios (e.g. Ryanair) also suffered smaller losses than the others.
Table 4.Cumulated average abnormal returns of individual elements, averages of the sample with a cash/assets ratio above the median and standard deviations of these returns, and test statistics compared to the index of the average returns of airlines with a cash/assets ratio below the median, compared to time 0 on 24 February.
Sample τ1,τ2 CAR (%) Std. deviation (%) T stat (CAR)
CA > median R2=0.380
(0;0) −3.43 0.01 −3.00**
(0;2) −6.29 0.04 −3.18**
(0;5) −5.22 0.08 −1.86
(1;5) −1.79 0.07 −0.70
(−2;2) −8.62 0.07 −3.37***
(−5;−1) −3.46 0.07 −1.35
τ1,τ2 CAR (%) Std. deviation (%) T stat (CAR)
Wizz Air R2=0.215
(0;0) −7.10 0.02 −4.59***
(0;2) −7.51 0.07 −2.80**
(0;5) −12.12 0.14 −3.20**
(1;5) −5.02 0.12 −1.45
(−2;2) −7.03 0.12 −2.03*
(−5;−1) −0.76 0.12 −0.22
τ1,τ2 CAR (%) Std. deviation (%) T stat (CAR)
Ryanair R2=0.285
(0;0) −7.42 0.03 −4.10***
(0;2) −5.36 0.10 −1.71
(0;5) −4.05 0.20 −0.91
(1;5) 3.37 0.16 0.83
(−2;2) −4.36 0.16 −1.08
(−5;−1) −0.12 0.16 −0.03
τ1,τ2 CAR (%) Std. deviation (%) T stat (CAR)
IAG R2=0.229
(0;0) −3.38 0.03 −1.84
(0;2) 1.51 0.10 0.48
(0;5) −15.67 0.20 −3.48***
(1;5) −12.30 0.17 −2.99**
(−2;2) 0.22 0.17 0.05
(−5;−1) −0.72 0.17 −0.18
τ1,τ2 CAR (%) Std. deviation (%) T stat (CAR)
Aegean R2=0.039
(0;0) −10.29 0.02 −7.67***
(0;2) −13.39 0.05 −5.77***
(0;5) −21.54 0.11 −6.56***
(1;5) −11.25 0.09 −3.75***
(−2;2) −13.87 0.09 −4.63***
(−5;−1) −0.85 0.09 −0.28
τ1,τ2 CAR (%) Std. deviation (%) T stat (CAR)
Finnair R2=0.131
(0;0) −1.37 0.04 −0.69
(0;2) −0.40 0.12 −0.12
(0;5) −6.95 0.24 −1.42
(1;5) −5.58 0.20 −1.25
(−2;2) −0.78 0.20 −0.18
(−5;−1) −4.31 0.20 −0.96
Note: Time 0 is 02.24, Monday. Critical values for t-test were 1.96 at 5%, 2.58 at 1%, and 3.3 at 0.1%. ***:p< 0.001; **:p< 0.01; *:
p< 0.05.
Figure 4.Evolution of total cumulative returns around the key-date (24 February) according to thefinancial-based clusters.
Table 5.Cumulated average abnormal returns of individual elements, averages of the sample of LCCs and standard deviations of these returns, and test statistics compared to the index of average returns of FSCs, compared to time 0 on 24 February.
Sample τ1,τ2 CAR (%) Std. deviation (%) T stat (CAR)
LCCs average R2=0.327
(0;0) −8.73 0.03 −5.32***
(0;2) −14.13 0.08 −4.98***
(0;5) −9.03 0.16 −2.25*
(1;5) −0.30 0.13 −0.08
(−2;2) −12.68 0.13 −3.46***
(−5;−1) 0.14 0.13 0.04
τ1,τ2 CAR (%) Std. deviation (%) T stat (CAR)
Wizz Air R2=0.258
(0;0) −7.31 0.02 −4.87***
(0;2) −8.36 0.07 −3.21**
(0;5) −7.57 0.14 −2.06*
(1;5) −0.25 0.11 −0.08
(−2;2) −7.48 0.11 −2.23*
(−5;−1) −0.13 0.11 −0.04
τ1,τ2 CAR (%) Std. deviation (%) T stat (CAR)
Ryanair R2=0.307
(0;0) −8.10 0.03 −4.55***
(0;2) −7.27 0.09 −2.36*
(0;5) 0.75 0.19 0.17
(1;5) 8.85 0.16 2.23*
(−2;2) −5.85 0.16 −1.47
(−5;−1) 0.58 0.16 0.15
τ1,τ2 CAR (%) Std. deviation (%) T stat (CAR)
easyJet R2=0.377
(0;0) −10.03 0.04 −5.11***
(0;2) −7.32 0.12 −2.15*
(0;5) 5.03 0.23 1.05
(1;5) 15.06 0.19 3.43***
(−2;2) −4.18 0.19 −0.95
(−5;−1) 4.04 0.19 0.92
τ1,τ2 CAR (%) Std. deviation (%) T stat (CAR)
Norwegian Air Shuttle R2=0.058
(0;0) −9.51 0.21 −2.06*
(0;2) −33.69 0.64 −4.21***
(0;5) −34.62 1.28 −3.06**
(1;5) −25.10 1.07 −2.43*
(−2;2) −33.37 1.07 −3.23**
(−5;−1) −4.03 1.07 −0.39
Note: Time 0 is 02.24, Monday. Critical values for t-test 1.96 at 5%, 2.58 at 1%, 3.3 at 0.1%. ***:p< 0.001; **:p< 0.01; *:p< 0.05.
5. Discussion and conclusion
The COVID-19 pandemic has caused immense societal and economic damage. The travel industry and air travel especially were hit particularly hard in the period of the pandemic under investigation.
In our study, we examined thefinancial performance of European-based airlines listed primarily on European stock exchanges in thefirst phase of the COVID-19 pandemic from 2 January to 20 March 2020. Using an event study method, we looked at the significance of the types offinancial-based characteristics (based on cash/assets ratios) and business model (LCC vs. FSC) for stock market per- formance at the most critical time of the crisis (24 February 2020) and whether significant differences in abnormal returns could be detected over the period in each stage and between the subgroups.
Thefirstfinding of our research is that stock markets reacted with different intensities at different stages of the crisis; the most significant drop from the expected return occurred at the beginning of the third phase, on 24 February, a key date that was confirmed by event study. This is the date when the effects of the virus massively reached Europe and border crossings within Europe were restricted as a result of the mass deaths in Italy.
One of the main contributions of our research is that we not only examined the impact of the designated event on the entire market, but also formed segments based onfinancial indicators and business models, and examined how each segment reacted to the given event. Financial group- ing was performed based on the cash/assets ratio. The effect was demonstrable, but contrary to our expectations, it was not the airlines with higher cash/assets ratios that performed better, but those with lower cash/assets ratios. The business model may explain this surprising result.
Regarding the business model, our hypothesis that the average abnormal returns of LCCs are lower than expected has been accepted. At the most critical time, LCCs performed significantly worse than FSCs. This phenomenon has already been noted by Zhang et al. (2021), Carter and Simkins (2004), and Yun and Yoon (2019): smaller airlines, possibly including LCCs, might be more vulnerable to a serious crisis than FSCs. When the crisis reaches a higher magnitude, then smaller airlines (including LCCs) decline sharply. This general finding is reinforced by our results that in the Fever period, airlines that until then had held up relatively well exhibited a drastic decline.
This means that our results corroborate the findings in the relevant literature and indeed, take them one step further. In addition, we found quite serious differences in the key date, so at the most critical moment of the crisis, the nature of the business model mattered the most.
Figure 5.Evolution of total cumulative returns around the key-date (24 February) according to the business-based clusters.
Another reason why FSCs proved to provide better results in this period, is that government support was directed mainly to these carriers. As Albers and Rundshagen (2020) found easyJet and Ryanair received much less support than Air-France-KLM, IAG, or the Lufthansa Group.
That LCCs felt the negative effects of the pandemic later might also be related to the fact that these airlines have a higher market share in Central and Eastern Europe, a region where the pan- demic arrived later and proved to be less disruptive. This shows that geography has to be taken into account when analysing the effects of a crisis, as has been shown earlier (Ramiah et al., 2010). FSCs (which also tend to be larger than LCCs) might have been hit in the Incubation period by the cancellation of conferences (as well as an expectation of later cancellations) (Ramelli & Wagner,2020). These results might be connected to the ripple effect which seems rel- evant when analysing the economic effects of the COVID-19 pandemic. Government subsidies will strengthen large national airlines, giving them even stronger market positions and crowding out smaller companies that are less attractive to either private or public investors. The principle of
‘too big to fail’applies, meaning that larger, traditional companies, backed by the state, are less likely to perform poorly in the long run and the investors have more confidence in them.
Overall, we see that the result in terms of cash/assets ratios is mainly due to the fact that LCCs, despite having higher cash/assets ratios, performed significantly worse than the other group.
Thus, although research to date links high cash/assets ratios to better market performance, the business model has overwritten this hypothesis.
6. Limitation and directions for further research
A limitation of the research reported here is that relatively few European airlines are listed on a stock exchange. This means that our sample size was small, and extreme stock price movements of a single airline were able to move the average, leading to potential bias. The decline in the performance of LCCs in the Fever subperiod may be attributable to the collapse of mass tourism. In practical terms, our results can inform investors about what kind of market reactions to expect in different stages of a crisis, and also help them to apply the relevant criteria andfinancial indicators when making their investment decisions. An important lesson is that in addition to financial indicators, business- specific considerations (LCC vs. FSC) are also important inputs to clustering airlines. We have also shown that the relevance of the indicators is variable and changes from one stage of the crisis to the next. In the future, it might be instructive to extend the analysis to overseas airlines, as well.
As the pandemic recedes, borders reopen, and air travel restarts, it becomes possible to observe the period of post-crisis rebound and to examine how and to what extent stock returns reach their pre-crisis levels, and whether there is any difference between the clusters defined in this paper. The role of state intervention should also be subject to scrutiny. Such steps may have increased investor confidence, especially in the case of larger airlines with higher leverage. This might have contributed to the relatively stable performance of such airlines in 2020 March.
Finally, regional variation deserves further study for two reasons: on the one hand, LCCs have a much higher market share in Eastern Europe than in Western Europe; on the other, the COVID-19 pandemic hit Western Europe much earlier and harder than Eastern Europe in the given period.
Disclosure statement
No potential conflict of interest was reported by the author(s).
Funding
This work supported by the ÚNKP-20-3-II-CORVINUS-19 New National Excellence Program of The Ministry for Innovation and Technology from the source of the National Research, Development and Innovation Fund.Gábor Neszvedawas sup- ported by the Higher Education Institutional Excellence Program 2020 of the Ministry of Innovation and Technology in
the framework of the‘Financial and Public Services’ research project (TKP2020-IKA-02) at Corvinus University of Budapest.
ORCID
László Kökény http://orcid.org/0000-0001-5375-4082 Zsófia Kenesei http://orcid.org/0000-0002-1908-8300 Gábor Neszveda http://orcid.org/0000-0002-6499-7191
References
Albers, S., & Rundshagen, V. (2020). European airlines′strategic responses to the COVID-19 pandemic (January-May, 2020).Journal of Air Transport Management,87, 7.https://doi.org/10.1016/j.jairtraman.2020.101863
Alderighi, M., & Cento, A. (2004). European airlines conduct after September 11.Journal of Air Transport Management,10 (2), 97–107.https://doi.org/10.1016/S0969-6997(03)00053-X
Anna Aero. (2018). LCC capacity in Europe set for half a billion seats in 2018; nine nations already at 50% market share;
European share forecast for 50% in 2027.https://www.anna.aero/2018/07/18/lcc-capacity-in-europe-set-for-half-a- billion-seats-in-2018/
Barrows, S. D. (2019). Assessing the stock market performances of Eu low-cost airlines.International Journal of Economics and Financial Issues,9(4), 95–100.https://doi.org/10.32479/ijefi.8160
Bates, T. W., Kahle, K. M., & Stulz, R. M. (2009). Why do U.S.firms hold so much more cash than they used To?The Journal of Finance,64(5), 1985–2021.https://doi.org/10.1111/j.1540-6261.2009.01492.x
Binder, J. J. (1998). The event study methodology since 1969.Review of Quantitative Finance and Accounting,11(2), 111– 137.https://doi.org/10.1023/A:1008295500105
Carter, D. A., & Simkins, B. J. (2004). The market’s reaction to unexpected, catastrophic events: The case of airline stock returns and the September 11th attacks.The Quarterly Review of Economics and Finance,44(4), 539–558.https://doi.
org/10.1016/j.qref.2003.10.001
Ding, W., Levine, R., Lin, C., & Xie, W. (2021). Corporate immunity to the COVID-19 pandemic.Journal of Financial Economics, 141(2), 802–830.https://doi.org/10.1016/j.jfineco.2021.03.005
Dobson, P. W., & Piga, C. A. (2013).: The impact of mergers on fare structure: Evidence from European low-cost airlines.
Economic Inquiry,51(2), 1196–1217.https://doi.org/10.1111/j.1465-7295.2011.00392.x
Drakos, K. (2004). Terrorism-induced structural shifts infinancial risk: Airline stocks in the aftermath of the September 11th terror attacks.European Journal of Political Economy,20(2), 435–446.https://doi.org/10.1016/j.ejpoleco.2003.12.
010
EC. (2020).Communication from the commission COVID-19: Temporary restriction on non-essential travel to the EU, Brussels. https://eurlex.europa.eu/legal-content/EN/TXT/?uri=CELEX%3A52020DC0115
Eurostat. (2019). Air transport statistics. https://ec.europa.eu/eurostat/statistics-explained/index.php/Air_transport_
statistics#Progressive_growth_in_air_transport_of_passengers_in_the_course_of_2018
Fama, E. F., Fisher, L., Jensen, M. C., & Roll, R. (1969). The adjustment of stock prices to new information.International Economic Review,10(1), 1–21.https://doi.org/10.2307/2525569
Flouris, T., & Walker, T. J. (2005). Thefinancial performance of low-cost and full-service airlines in times of crisis.Canadian Journal of Administrative Sciences / Revue Canadienne Des Sciences de L’Administration,22(1), 3–20.https://doi.org/10.
1111/j.1936-4490.2005.tb00357.x
Gillen, D., & Ashish, L. (2004).: Competitive advantage of low-cost carriers: Some implications for airports.Journal of Air Transport Management,10(1), 41–50.https://doi.org/10.1016/j.jairtraman.2003.10.009
Gillen, D., & Lall, A. (2003). International transmission of shocks in the airline industry. Journal of Air Transport Management,9(1), 37–49.https://doi.org/10.1016/S0969-6997(02)00068-6
Gong, S. X. H. (2007). Bankruptcy protection and stock market behavior in the US airline industry.Journal of Air Transport Management,13(4), 213–220.https://doi.org/10.1016/j.jairtraman.2007.03.003
Gong, S. X. H., Firth, M., & Cullinane, K. (2006). The information content of earnings releases by global airlines. Journal of Air Transport Management,12(2), 82–91.https://doi.org/10.1016/j.jairtraman.2006.01.001
Hadi, D. M., Katircioglu, S., & Adaoglu, C. (2020). The vulnerability of tourismfirms’stocks to the terrorist incidents.
Current Issues in Tourism,23(9), 1138–1152.https://doi.org/10.1080/13683500.2019.1592124
Henderson, J. C. (2004). Managing a health-related crisis: SARS in Singapore. Journal of Vacation Marketing,10(1), 67–77.
https://doi.org/10.1177/135676670301000107
Hirshleifer, D. (2001). Investor psychology and asset pricing.The Journal of Finance,56(4), 1533–1597.https://doi.org/10.
1111/0022-1082.00379
Hunter, L. (2006). Low-cost airlines: Business model and employment relations.European Management Journal,24(5), 315–321.https://doi.org/10.1016/j.emj.2006.08.001