FANNI TÓTH
HIDDEN PREFERENCES IN SOCIAL RESPONSIBILITY – THE ANALYSIS OF ERSTE SEEDS CORPORATE SOCIAL RESPONSIBILITY PROGRAMME
REJTETT PREFERENCIÁK A TÁRSADALMI FELELŐSSÉGVÁLLALÁSBAN – AZ ERSTE SEEDS VÁLLALATI TÁRSADALMI FELELŐSSÉGVÁLLALÁSI PROGRAMJÁNAK ELEMZÉSE
Banks are usually active in creating and operating corporate social responsibility (CSR) programmes for different reasons.
This paper analyses the Erste Bank SEEDS programme, which is dedicated to entrepreneurs promoting social welfare in Hungary. A total number of 68 social entrepreneurs were selected from 203 applicants to participate in the programme.
To detect the success factors, the paper examines all proposals with content analysis. Then, using a bivariate logistic reg- ression, the research estimates the probability of getting selected and identifies three critical factors: the potential social impact, financial sustainability and the life cycle of the product or service. These results hint to the bank caring about so- cial impacts but only if financial sustainability is assured. Some social activities (community building, health or sustainable lifestyle) are less preferred than others (employment). The main contribution of the study is to present how corporate social responsibility programmes can be analysed and what hidden requirements may be incorporated within them.
Keywords: CSR, logit model, social entrepreneurship, content analysis
A bankok vállalati társadalmi felelősségvállalása (CSR) különböző okokra vezethető vissza. A tanulmány az Erste Bank SE- EDS programját vizsgálja, amely szociális jólétet elősegítő vállalatoknak szól Magyarországon. A 203 jelentkezőből össze- sen 68 társadalmi vállalkozás került a programba. A bekerülés sikertényezőinek felderítése a jelentkezők pályázatainak és értékelésük tartalomelemzésével, majd logisztikus regresszió segítségével a kiválasztás valószínűségének elemzésével va- lósul meg. Az elemzés a programba kerülés szempontjából három kritikus tényezőt tár fel: a társadalmi hatást, a pénzügyi fenntarthatóságot és a termék vagy szolgáltatás életciklusát. A bank tehát valóban törődik a társadalmi hatás elérésével, de csak abban az esetben, ha a projekt megvalósíthatósága és pénzügyi fenntarthatósága biztosított. Néhány terület, mint a közösségépítés vagy a fenntartható életmód, kevésbé preferált szemben a munkahelyteremtéssel. A tanulmány fő hozzájárulása annak bemutatása, hogy hogyan lehet elemezni a vállalati társadalmi felelősségvállalási programokat, és milyen rejtett követelmények lehetnek beépítve azokba.
Kulcsszavak: CSR, logit modell, társadalmi vállalkozások, tartalomelemzés Funding/Finanszírozás:
This research was supported by the Higher Education Institutional Excellence Program 2020 of the Ministry for Innovation and Technology in the framework of the ‘Financial and Public Services’ research project (TKP2020-IKA-02) at Corvinus University of Budapest.
A kutatást az Innovációs és Technológiai Minisztérium Felsőoktatási Intézményi Kiválósági Programja támogatta a Buda- pesti Corvinus Egyetem „Pénzügyi és közszolgáltatások” kutatási projekt (TKP2020-IKA-02) keretében.
Author/Szerző:
Tóth Fanni, PhD student, Corvinus University of Budapest, toth.fanni@uni-corvinus.hu This article was received: 22. 09. 2020, revised: 30. 01. 2021, accepted: 01. 03. 2021.
A cikk beérkezett: 2020. 09. 22-én, javítva: 2021. 01. 30-án, elfogadva: 2021. 03. 01-én.
E
ngagement in a corporate social responsibility (CSR) programme can be beneficial for a bank. Gangi, Me- les, D’Angelo and Daniele (2019) analysed the relationship between the bank’s environmental engagement and its risk, and pointed out that a bank with more sensitivity towar- ds environmental issues exhibits less risk. Liang, Chang and Shao (2018) compared the banks listed on the Dow Jones Sustainability Index (DJSI) with non-DJSI banks and discovered that listed banks were more cost efficient.Miralles‐Quirós, Miralles‐Quirós and Redondo‐Hernán- dez (2019) revealed that commercial banks increased their social responsibility to reinforce creditability and stake- holders’ trust. The association between CSR and financial performance was examined by Wu and Shen (2013): they found a positive association. However, they also indicated that CSR is negatively associated with non-performing lo- ans.
If the application is a precondition for participation in the CSR programme, it is essential to define and imple- ment a selection process. Unfortunately, only a limited number of research papers on the evaluation of applica- tions are available. One of these is a comparative study published by the European Commission (2012). This pa- per analysed project selection processes in six different EU member states, for three themes, across fourteen op- erational programmes financed by the European Region- al Development Fund from 2007 to 2013. The objectives were to assess the effectiveness and efficiency of project selection processes, to identify good practice examples and to propose recommendations. According to this re- port, the eligibility criteria or exclusion criteria are clearly distinguished from the quality criteria. The quality of the projects can be evaluated by qualitative assessment in- volving external evaluators or scoring methods.
The Interreg IPA Cross-border Cooperation Pro- gramme Hungary-Serbia was approved by the European Commission in 2015, and it funded co-operation projects of non-profit organisations. According to its final evalua- tion report (Interreg IPA, 2019), the programme’s selec- tion process consisted of four parts. After checking the eligibility of applicants, a quality assessment was carried out by two external assessors, whose selection was also a strict procedure. Applicants received their final scores as an average of the two assessments. In the case of signifi- cant differences in the scores, a re-assessment process was incorporated into the phase of definition of the projects list. After approval of the final project list, the applicants got feedback about their project proposals.
The grants manual of the Horizon 2020 work pro- gramme (European Commission, 2015) also highlights the importance of external, independent experts in the eval- uation process. The evaluation extends to the following criteria in this programme: excellence, impact and quality and efficiency of implementation. For each criterion, the assessors graded applicants from 0 to 5, with 5 being the best score.
In this paper, binary logistic regression is used to pre- dict the probability of applicants’ failure or success in the Erste SEEDs programme in Hungary. The research
also aims at identifying the “hidden” requirements, those which were not explicitly formulated in the call for appli- cations.
An excellent example of a CSR Programme is the Er- ste SEEDS’ (Social Enterprise Establishment and Devel- opment Support) non-profit enterprise development pro- gramme launched in 2017, which can be interpreted as a social innovation. The Erste SEEDS was a one-and-a-half- year long investment-readiness and social entrepreneur development programme in Hungary. It aims to support participants to develop a social business model on their own. Social entrepreneurs can also obtain investor rela- tions through the bank and are prepared for further financ- ing with bank loans. Moreover, this programme targeted reduction of inequality and improvement of the quality of life of the people in need.
Application was only possible for social entrepreneurs in 2017. There was no other prerequisite for the applica- tion. It was not only available for existing organisations, but also for those who only had an idea to create a social impact.
The practical implementation of useful concepts, for the community, is often hindered by the fact that the idea owners do not have experience in setting up, operating or developing an organisation. Therefore, the primary goal of the programme was not only the financial support, but also to enhance knowledge. The Erste SEEDS programme was created to overcome the pitfalls and challenges of new organisations and to expand the business of existing or- ganisations.
The successful applicants or participants of the pro- gramme took part in training sessions, a mentoring pro- gram and had the chance to receive a non-refundable grant to launch or develop their businesses. The social initiatives supported, until now, included aid to disabled persons and people living in extreme poverty, and developing physical and mental health. (Erste Bank Hungary Ltd., 2017a; Erste SEEDS, 2020)
The programme was founded by Erste Stiftung and received financial support from the European Union Pro- gramme for Employment and Social Innovation (EaSI).
The 36-month program offered strong strategic support for the first 18 months. During the implementation of the programme, Erste Bank was assisted by advisory firms and 91 volunteers, 13 of whom were members of student organisations of the Corvinus University of Budapest and their alumni network (Erste Bank Hungary Ltd., 2017a;
Erste Bank Hungary Ltd., 2018).
The current study aims to reveal the characteristics which have boosted the probability to be admitted suc- cessfully as a participant and examines the hidden pref- erences of the Erste SEEDS programme in 2017. In the analysis, a total of 203 applications were involved, of which 68 were successful. The evaluation was carried out with the involvement of experts, and the four-eyes prin- ciple was applied in the evaluation process. Thereby, the database comprises not only the short descriptions of the projects but also the written assessments of two reviewers for every application.
This study uses two methodological approaches. The first part is a qualitative research method, in which the content analysis is performed. Using this method allows the creation of indexes for the extension of social activities and social impact, or economic feasibility as potential suc- cess factors. Additionally, some other factors – life cycle of the products or services – were identified, which can be categorised clearly during the analysis. The second part builds on a quantitative research method, where the data generated in content analysis were examined with bivar- iate logistic regression to find the success factors of the participants in Erste SEEDS programme.
The relevance of this paper lies in the lack of similar researches, which address the relationship between the odds of enrolment in a development programme and suc- cess factors for social entrepreneurs. This study may pro- vide guidelines and a solid basis for social entrepreneurs to prepare for an application, and the case study highlights which projects have the preference of being selected. The paper is structured as follows: after introducing the re- search data in Section 2, the methodological descriptions and the results obtained will be presented in Section 3, and the paper ends with the drawing of inferences in Section 4.
Research Data
During the analysis, the table of the tender evaluation of the applicants (Erste Bank Hungary Ltd., 2017b) was ex- amined. Here, a summary of all the applicants’ ideas or projects can be found, and the judgments are also includ- ed. The judgments were formed by Hungarian experts:
they consist of two parts for each project: strengths and weaknesses or risks, which are also listed in detail, in the table.
Figure 1 shows the distribution of participants (68 suc- cessful applicants) by legal status, these data are not avail- able in case of non-participants. Seventy-five percent of the enterprises are non-profit organisations, and only one participant works as a sole proprietor. Private individuals
need to be explained, as not all participants were ready to form a legal organisation before the programme. Many ac- tivities are started from a private initiative and some peo- ple keep working in their “normal” job and besides this for social purposes. Only when there is a business case can these people quit their job and devote themselves entirely to the social activity, in which SEEDS grants can support them.
Figure 1.
Number and proportion of participants distributed by legal status
Source: own compilation, based on Erste Bank Hungary Ltd. (2017a)
Many of the participants are working in several social ac- tivities simultaneously, and most of them operate in man- ufacturing. The topic chosen by most applicants is people with disabilities. There is a wide range of ideas, which include the recruitment of people with disabilities to the development of accessible gardens and parks for people with reduced mobility. Extreme poverty is the second most-chosen topic. The primary focus here is to solve the problem of employment in different regions of Hungary.
Some other essential elements need to be highlighted:
the table (Erste Bank Hungary Ltd., 2017b) also displays Nonprofit
organisations 75%51 Nonprofit
corporations 9%6 Corporations
9%6
Private individual
6%4
Sole proprietorship
1%1
41%
24%
35%
70%
15%
15%
0% 20% 40% 60% 80%
Business idea or plan Existing prototype, including customer
feedback Continuous supply of
goods or services
Non-Participant Participant
24%
13%
10%
52%
16%
28%
13%
43%
0% 10% 20% 30% 40% 50% 60%
Budapest Limited number of municipalities
One county More than one county
Non-Participant Participant
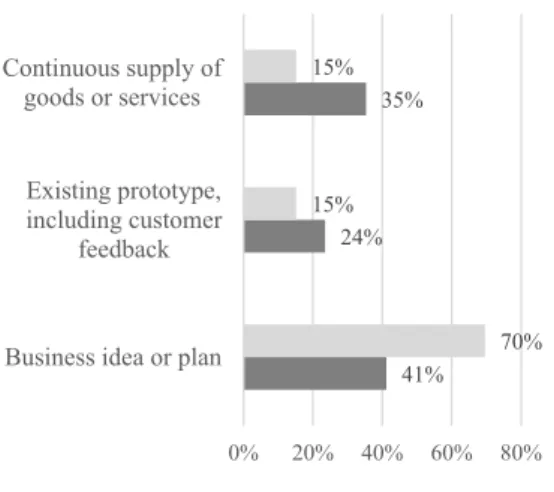
Figure 2 and 3.
The life cycle of the applicants’ projects and geographical scope of possible social impact distributed by participation
Source: own compilation, based on Erste Bank Hungary Ltd. (2017b)
the geographical scope of the potential social impact, the main topics and the life cycles of projects. The latter var- iable can be divided into three categories: first one, the business idea or plan, where the implementation phase of these projects is entirely missing; second, the existing prototype, including customer feedback; and the last one is the continuous supply of goods or services. Based on the geographical scope, the extent of the possible social impact of the implemented projects can be assessed. Fol- lowing are the geographical extension categories in this sample: Budapest, a limited number of municipalities, one county and more than one county.
Figures 2 and 3 show the distribution of participants and non-participants, based on the life cycle and geo- graphical scope of their projects. The successful partici- pants have relatively more developed projects (life cycle of the products or services) than the rest of the sample. Out of the 68 participants, 24 were already in the continuous supply of goods or services phase at the time of application and 16 had an existing prototype and customer feedback.
These represent 35.3 and 23.5 percent, successively, while 69.6 percent of non-participants still have only an idea.
According to the Chi-square test, there is a significant as- sociation between the applicants and the life cycle of their projects (p=0.01).
Related to geographical extension, it seems that the only significant difference occurs for those projects where just a narrow scope of society is affected by the possible social impact. Only 13.4 percent of the participants’ pro- jects reach a limited number of municipalities compared to the 28 percent of non-participants’ projects. The social impact is more effective when it reaches its target group on a large scale when it has a wide geographical scope.
Two categories were created: if the geographical scope of a project was broader (Budapest, one county or more than one county), the dummy value is 1 and 0 otherwise. In this case, there is a significant association between the appli- cants and the geographical scope of their projects, accord- ing to the Chi-square test (p=0.05).
Analysis and Results Content Analysis
Qualitative content analysis is “a research method for the subjective interpretation of the content of text data through the systematic classification process of coding and identifying themes or patterns” (Hsieh & Shannon, 2005, p. 1278). In this study, a qualitative research method is used to process data for further quantitative analysis, to enhance a more profound understanding of topics and draw inferences from them. The usefulness of combining the two methods was also underlined by Weber (1990).
Zhang and Wildemuth (2005) determined the process of qualitative content analysis in eight steps: (1) prepare the data, (2) define the unit of the analysis, (3) develop cat- egories and a coding scheme, (4) test your coding scheme on a sample of text, (5) code all the text, (6) assess your coding consistency, (7) draw conclusion from the coded data and (8) report your methods and findings.
The content analysis of this study is based on these eight steps; the process will be presented accordingly. The text analysis relies on the table of the tender evaluation of the applicants (Erste Bank Hungary Ltd., 2017b). The table contains the extracts of applicants’ tenders and the assessment of two reviewers per tender. Before the analy- sis, the following questions arose: (1) What is the extent of the social impact that should be reached by each project?
(2) What social topics do the projects target? (3) How de- tailed is the business plan of social organisations? (4) Are the inputs available to implement the projects? (5) Is there a potential demand for the products or services? The last two questions became interesting because of the economic feasibility of the projects.
To answer these questions, a questionnaire of IFKA NKft. (2020) (developer of a scoring system of social enterprises) was used as a coding scheme, and an own coding scheme was also developed to be able to assess the business side of the organisations. The codes of the questionnaire were transformed during the analysis. Some topics were excluded from the model, and some new ones were added due to the new themes emerging. The coding schemes of social activity and social impact extension are as follows. Relating to the aspect of content, the extension of social activity was divided into nine categories, as vis- ible in Table 1.
Table 1.
Categories of the extension of social activity Signed by Extension of social activity
A1 Employment
A2 People with disabilities, social inclusion A3 Human, social, public service A4 Education, competence development, aware-
ness-raising
A5 Protection of environment, health, sustainable lifestyle
A6 Local products, services, retail, preserving heri- tage, rural tourism
A7 Community building
A8 IT support
A9 Fundraising for charity purposes, including rein- vestment of profit
Source: own compilation, based on IFKA NKft. (2020)
If any of the above categories were found in the text, the social organisation got 1 point; if not, 0 points were given for the project. After summarising the categories, the fol- lowing calculation method was used:
(1) where Ak is the activity indicator, which takes 1 if the ac- tivity was mentioned in the application, and 0 otherwise.
In the equation, n is the number of potential activities, which is 9. Figure 4 shows the number of applicants cat- egorised by their scores, where the highest score is 6 out
𝐸𝐸𝐸𝐸𝐸𝐸𝐸𝐸𝐸𝐸𝐸𝐸𝐸𝐸𝐸𝐸𝐸𝐸 𝐸𝐸𝑜𝑜 𝐸𝐸𝐸𝐸𝑠𝑠𝐸𝐸𝑠𝑠𝑠𝑠 𝑠𝑠𝑠𝑠𝐸𝐸𝐸𝐸�𝐸𝐸𝐸𝐸� �∑������� ,
of 9 (reached by two applicants). According to the Chi- square test, there is no significant association between the success of the applicants and their social activity score (p=0.05).
The extension of social impact was based on a total of 26 subcategories within seven main categories, as visible in Table 2.
Table 2.
Categories of the extension of social impact Signed by Extension of social impact B1 Economic impact
B11 Improving labour market participation/reducing unemployment, providing income to the poor B12 Economic development
B2 Equality impact
B21 Development of equal opportunities
B22 A more inclusive/accepting/open/tolerant society B23 Poverty reduction
B24 Dissemination of social innovations B3 Community impact
B31 Development of individual/community skills B32 Better social relations
B33 Strengthening social cohesion
B34 Healthier relationships/stronger families B35 Individuals/communities able to become inde-
pendent
B36 Individuals/communities able to integrate B37 Reducing the lack of basic skills
B4 Organisational impact
B41 Development of the non-profit sector
B42 Development of social competencies B43 More transparent organisations B5 Individual social impact B51 Improving housing conditions B52 Better living conditions
B53 Easier access to food supply (better quality food) B54 Ensuring human dignity
B6 Cultural impact
B61 Preservation of cultural values B62 Preserving diversity
B63 More educated communities B64 Better health status
B7 Environmental effect B71 Healthier environment B72 Animal welfare
Source: own compilation, based on IFKA NKft. (2020)
The extension of the social impact was calculated as fol- lows:
(2) where SIj is the indicator of social impact, which takes 1 if it was mentioned in the application, and 0 otherwise.
In the equation m is the number of potential social im- pacts which is 26. Figure 5 demonstrates the distribution of applicants by their scores, where the highest score is 14 out of 26 (reached by two applicants). According to the Chi-square test, there is a significant association between the success of the applicants and their social impact score (p=0.05).
Figure 4.
Distribution of applicants categorised by their score of extension of social activity
Source: own compilation, based on Erste Bank Hungary Ltd. (2017b)
7%
32%
28%
21%
9%
3%
9%
29%
32%
22%
9%
0% 0%
5%
10%
15%
20%
25%
30%
35%
1 2 3 4 5 6
Participant Non-Participant
𝐸𝐸𝐸𝐸𝐸𝐸𝐸𝐸𝐸𝐸𝐸𝐸𝐸𝐸𝐸𝐸𝐸𝐸 𝐸𝐸𝑜𝑜 𝐸𝐸𝐸𝐸𝑠𝑠𝐸𝐸𝑠𝑠𝑠𝑠 𝐸𝐸��𝑠𝑠𝑠𝑠𝐸𝐸 �∑��������
In the case of the variables “business plan” and “inputs and demand”, the self-developed coding scheme was used.
The assessment of projects is appropriate for grouping.
Within both variables, three groups are distinguished: (1)
“Low”, (2) “Medium” and (3) “High”.
The classification of “business plan” was conducted as follows: a project was rated “Low” if the word “business plan” was not mentioned in the assessment or if it was mentioned in a negative context (e.g., very poor). “Me- dium” category meant that the “business plan” was men- tioned by the reviewer. The projects in which the phrase
“business plan” was mentioned in a positive context (e.g., very detailed) were classified as “High”. Figure 6 shows the distribution of applicants by their “business plan”. Ac- cording to the Chi-square test, there is a significant asso- ciation between the success of the applicants and the clas- sification of their business plan (p=0.01).
The variable “inputs and demand” was classified as fol- lows: “Low” meant that inputs (human capital, equipment, fund) and potential demand were missing in a large part
based on the assessment. “Medium” occurred if inputs are partially available or there is a conditional demand for the products and services. “High” was reached by those ap- plications which had all the inputs mostly available and there was a probable market demand for their products and services. Figure 7 represents the number of applicants cat- egorised by the classification of the “inputs and demand”
of their projects. According to the Chi-square test, there is a significant association between the success of the ap- plicants and their classification of “inputs and demand”
(p=0.01).
Figure 7.
Distribution of applicants categorised by the classification of inputs and demand
Source: own compilation, based on Erste Bank Hungary Ltd. (2017b)
The variable “economic feasibility” is generated from these two variables: “business plan” and “inputs and de- mand” are combined; therefore, nine categories can be distinguished. Figure 8 shows the number of applicants based on the “economic feasibility” of their projects, where the first category refers to the classification based on “business plan”, and the second based on “inputs and demand” of the projects. The variable is used as a dummy variable: if one of the two has a classification of Figure 5.
Distribution of applicants categorised by their score of extension of social impact
Source: own compilation, based on Erste Bank Hungary Ltd. (2017b)
Figure 6.
Distribution of applicants categorised by the classification of business plan
Source: own compilation, based on Erste Bank Hungary Ltd. (2017b)
4% 6%
4%
9%
6%
15%
10% 12%
9%
12%
3%
1%
7%
1%
5%
11%
17%
10%
13%
10%
11%
9%
6%
2%
4% 2%
1% 1%
0%
2%
4%
6%
8%
10%
12%
14%
16%
18%
1 2 3 4 5 6 7 8 9 10 11 12 13 14
Participant Non-Participant
28%
34% 38%
58%
28%
14%
0%
10%
20%
30%
40%
50%
60%
70%
Low Medium High
Participant Non-Participant
7%
75%
18%
27%
66%
7%
0%
10%
20%
30%
40%
50%
60%
70%
80%
Low Medium High
Participant Non-Participant
“Low”, the project got 0. According to the Chi-square test, there is a significant association between the success of the applicants and the “economic feasibility” of their projects (p=0.01).
To be consistent and objective, some checkpoints are built in the analysis. The first condition is that the pro- jects, which were included in the programme, were marked only at the end of the content analysis. Besides, some filtering was done on the data set. One of these, for example, is that if projects were grouped in cate- gory “A1” (Employment) as a social activity, then all of these projects had to be included in category “B11”
(Improving labour market participation, reducing un- employment).
Regression Analysis
In logistic regression, the dependent variable (y) is binary, the value of which can be 1 and 0. In this study, the de- pendent variable represents the selection of an applicant in the Erste SEEDS programme: selected as a participant (success), not selected (failure).
After the content analysis, the next step is to deter- mine which variables have an impact on an applicant becoming a participant. In the case of applications of so- cial entrepreneurs to a programme launched by a bank, the following aspects can play an important role in the selection and, therefore, need to be considered when building the model. Because the applicants are social entrepreneurs, social activity in which they operate and the impact they can achieve are essential. The wider the geographical scope of a project is, the larger its social impact can be. Based on the life cycle, a project operat- ing in a higher phase confirms the effort already made towards the goal of the applicant. The participants of the programme can also obtain investor relations through the bank and its programme, and are prepared for further financing with bank loans. Thus, it is necessary to take into account the economic feasibility of the projects.
Three models were constructed for the analysis. Table 3 presents the variables used for the analysis; the three models differ in the measurement level of the variables and how they are included in.
Table 3.
Explanatory variables Model
I. Model II. Model Extension of social activity (scale III.
variable) x x x
Extension of social impact (scale
variable) x
Economic feasibility (dummy variable) x x 1 (if “business plan” and “inputs
and demands” are categorised as Medium or High)
0 (otherwise)
Business plan (category variable) x
Low Medium High
Inputs and demand (category variable) x Low
Medium High
Life cycle (category variable) x x x
Business idea or plan Existing prototype, including customer feedback
Continuous supply of goods or services
Social activities “A1” to “A9”
(dummy variables) x x
1 (if the applicant is socially active in the defined field)
Figure 8.
Distribution of applicants categorised by the classification of economic feasibility
Source: own compilation, based on Erste Bank Hungary Ltd. (2017b)
6%
21%
0% 1%
25%
7%
0%
28%
10%
23%
33%
2% 4%
21%
3% 0%
11%
2%
0%
5%
10%
15%
20%
25%
30%
35%
Participant Non-participant
0 (otherwise)
Geographical scope (dummy variable) x x x 1 (Budapest; one county; more
than one county)
0 (only limited number of municipalities)
Source: own compilation
In Model I, the variables “extension of social impact” and
“extension of social activity” were included in the model, as described in the content analysis chapter; see equations (1) and (2). In the case of the variable of “geographical scope”, two categories were created: if the geographical scope of a project is broader (Budapest, one county or more than one county), it takes 1 and 0 otherwise. The variable “economic feasibility” was included as a dum- my variable and was created based on the classification of “business plan” and “inputs and demand”. If one of the two has a classification of “Low”, the project got 0, assum- ing that the lower category projects were less preferred in the selection process. The analysis is able to determine, in terms of economic feasibility, whether higher categories are more favoured compared to the lower ones.
Table 4.
Frequency and coding of categorised variable “life cycle”
Frequency Parameter coding
(1) (2)
Life cycle
Business idea or plan 114 0 0
Existing prototype, including customer
feedback 34 1 0
Continuous supply
of goods or services 43 0 1
Source: own compilation, based on Erste Bank Hungary Ltd. (2017b)
According to Hámori (2016), categorised explanatory variables can increase the explanatory power of the mod- el. The projects’ life cycle is taken into account through a category variable, where the reference category is the
“business idea or plan”. Table 4 shows the frequency and the coding of the variable “life cycle”. The collinearity di- agnostics confirm that in Model I, there are no problems with multicollinearity.
Model II highlights which of the social activities were more or less popular during the assessment. Instead of in- volving the variable “extension of social activity”, catego- ries “A1” to “A9” (Table 1) are used as dummy variables, to cover the main social activity fields. The collinearity di- agnostics confirm that in Model II, there are no problems with multicollinearity.
Model III uses more categorised variables: “business plan” and “inputs and demand” are involved separately.
Therefore, we can examine which variable plays a more significant role in the selection process in terms of the eco- nomic feasibility of the projects. For both variables, the
category “Low” was set as the reference category. Table 5 shows the frequency and the coding of both categorised variables. The collinearity diagnostics confirm that in Model III, there are no problems with multicollinearity.
Table 5.
Frequency and coding of categorised variables:
“inputs and demand” and “business plan”
Frequency Parameter coding
(1) (2)
Inputs and demand
Low 39 0 0
Medium 131 1 0
High 21 0 1
Business plan
Low 90 0 0
Medium 58 1 0
High 43 0 1
Source: own compilation, based on Erste Bank Hungary Ltd. (2017b)
In all three Models 191 projects were analysed. Twelve ap- plicants, of which one accepted participant, were excluded from the examination because of the too many missing variable values. In some cases, the entire extracts of appli- cants’ tenders were missing, which are the basis for pro- cessing data for quantitative analysis. In some other cases, the “life cycle” or the “geographical scope” of the projects were not available.
Logistic regression was conducted by applying the En- ter method. The assumptions of the binomial regression model are tested, all the assumptions are met. The results are shown in Tables 6–8. According to the omnibus tests of model coefficients, the new models (with explanatory variables included) are explaining more of the variance in the outcome over the baseline models. All the three mod- els are statistically highly significant (p<.000).
Based on Table 6, five variables are entered in the equa- tion, including the constant. The estimated coefficients of extension of social impact can be interpreted as follows:
if the value of the extension of social impact increases by one unit, which is measured as a percentage, then the odds of being a participant in the Erste SEEDS programme is multiplied by . In the case of variable “life cycle”, “only idea or plan” was selected as the reference category. The dummy “life cycle: existing prototype” is not statistically significantly different from the reference category, but the dummy “life cycle: continuous supply” is statistically sig- nificantly different with a p-value of 0.012. Compared to the reference category, being in the highest phase with the project increases the odds of being accepted significantly.
It is also shown that a more economically feasible project was more preferred in the selection process. Com- pared to the category where “business plan” or “inputs and demand” is classified as “Low”, existing demand for the products and services, available inputs, and a detailed business plan increase the odds of being accepted signif- icantly. The only beta value that is less than 0 belongs to
the variable “extension of social activity”, meaning that the more extensive the social activity is, the lower the chances of being accepted are. Table 6 shows that the variable “geographical scope” is not significant at 5%
level in Model I.
According to Model II (Table 7), five variables are significant, including the constant. In addition to Model I, using dummy variables for social activities lets us show that category “A7” was less preferred in the selection (it is shown by negative beta coefficients), so it decreases the odds of getting into the programme. (It is also possible that projects in this field were less elaborated or could not fulfil other important criteria.) Although other categories of social activities are not significant in the model, it can be assumed that some of the categories were more popular in the assessment. In other words, being socially active in the category “Employment” (A1) was worth more than
in category “Community building” (A7) in terms of the admission to the programme.
Variable “Economic feasibility” is significant in Mod- els I and II. Based on this result, those projects that were sustainable on a business basis were favoured during the assessment. This might be due to the fact that the CSR programme was launched by a bank. Within the frame- work of this programme, social entrepreneurs were also prepared for further financing with bank loans. There- fore, participants could become the customers of the bank in the future. However, a bank provides credit when the probability of default of its customer is low. This could be the reason why the sustainable business model and the opportunity of earning diversified income of social entre- preneurs played an important role in the selection of par- ticipants. This context highlights the special role of the bank in a CSR programme.
Table 7.
Variables in Model II
B S.E. Wald df Sig. Exp(B)
Extension of social impact 5.613 2.475 5.143 1 0.0233 273.92
Economic feasibility 1.171 0.405 8.354 1 0.0038 3.23
Life cycle 8.139 2 0.0171
Life cycle: existing prototype 1.015 0.521 3.801 1 0.0512 2.76
Life cycle: continuous supply 1.238 0.465 7.077 1 0.0078 3.45
Geographical scope 0.954 0.497 3.687 1 0.0548 2.60
A1 0.433 0.554 0.612 1 0.4341 1.54
A2 0.526 0.485 1.175 1 0.2783 1.69
A3 0.446 0.468 0.907 1 0.3409 1.56
A4 -0.886 0.455 3.793 1 0.0515 0.41
A5 -0.911 0.474 3.692 1 0.0547 0.40
A6 -0.453 0.415 1.193 1 0.2747 0.64
A7 -1.003 0.420 5.698 1 0.0170 0.37
A8 0.019 0.640 0.001 1 0.9762 1.02
A9 -0.939 0.787 1.423 1 0.2330 0.39
Constant -2.927 0.738 15.736 1 0.0001 0.05
Source: own compilation, based on Erste Bank Hungary Ltd. (2017b)
Table 6.
Variables in Model I
B S.E. Wald df Sig. Exp(B)
Extension of social activity -4.029 1.743 5.342 1 0.0208 0.02
Extension of social impact 7.022 1.842 14.533 1 0.0001 1 120.50
Economic feasibility 0.972 0.377 6.650 1 0.0099 2.64
Life cycle 6.559 2 0.0376
Life cycle: existing prototype 0.602 0.466 1.668 1 0.1965 1.83
Life cycle: continuous supply 1.093 0.433 6.374 1 0.0116 2.98
Geographical scope 0.696 0.455 2.333 1 0.1267 2.01
Constant -2.459 0.631 15.168 1 0.0001 0.09
Source: own compilation, based on Erste Bank Hungary Ltd. (2017b)
In Model III, we can investigate economic feasibility in more detail; see Table 8.
The added value of Model III to the analysis is that it high- lights the importance of the “business plan” of the appli- cants. The dummy “business plan: high” is statistically significantly different from the reference category (“Low”) with a p-value of 0.015. Compared to the reference catego- ry, a project where financial sustainability is confirmed by a sound business plan was significantly more preferred in
the selection process. Variable “inputs and demand” is not significant in Model III. Based on this result, in contrast
to the projects’ financial sustainability, the existence of inputs and demand did not play a significant role in the selection process. Furthermore, in addition to the variable
“A7”, variable “A5” is also significant in this model. Thus, being socially active in protecting the environment, main- taining good health and having a sustainable lifestyle also decreases the odds of being accepted significantly.
Table 8.
Variables in Model III
B S.E. Wald df Sig. Exp(B)
Extension of social impact 6.404 2.584 6.143 1 0.0132 604.26
Business plan 6.180 2 0.0455
Business plan: medium 0.411 0.487 0.714 1 0.3982 1.51
Business plan: high 1.282 0.526 5.933 1 0.0149 3.60
Inputs and demand 2.668 2 0.2634
Inputs and demand: medium 0.808 0.616 1.721 1 0.1896 2.24
Inputs and demand: high 1.330 0.826 2.595 1 0.1072 3.78
Life cycle 7.119 2 0.0284
Life cycle: existing prototype 0.996 0.534 3.481 1 0.0621 2.71
Life cycle: continuous supply 1.205 0.485 6.174 1 0.0130 3.34
Geographical scope 0.994 0.512 3.775 1 0.0520 2.70
A1 0.248 0.568 0.190 1 0.6627 1.28
A2 0.373 0.503 0.549 1 0.4589 1.45
A3 0.476 0.479 0.991 1 0.3196 1.61
A4 -0.874 0.480 3.312 1 0.0688 0.42
A5 -1.010 0.478 4.459 1 0.0347 0.36
A6 -0.379 0.426 0.791 1 0.3738 0.68
A7 -1.096 0.434 6.370 1 0.0116 0.33
A8 0.195 0.642 0.092 1 0.7618 1.21
A9 -0.930 0.823 1.278 1 0.2582 0.39
Constant -3.585 0.859 17.431 1 0.0000 0.03
Source: own compilation, based on Erste Bank Hungary Ltd. (2017b)
Figure 9a, b, c.
ROC curves for Models I, II and III
Source: own compilation, based on Erste Bank Hungary Ltd. (2017b)
Figures 9a, b, c and Table 9 show the results of receiver operating characteristic curves (ROC) and the area under the ROC curve (AUC) of the models. Curves higher away from the diagonal line correspond to a higher level of per- formance.
Table 9.
Area under the curve for Models I, II, and III
Model Area Std.
Error Asymp- totic Sig.
Asymptotic 95%
Confidence Interval Lower
Bound Upper Bound
I 0.781 0.035 0.000 0.713 0.848
II 0.821 0.030 0.000 0.763 0.879
III 0.834 0.029 0.000 0.777 0.891
Source: own compilation, based on Erste Bank Hungary Ltd. (2017b)
In the case of Model I, the AUC value is 0.781. In Models II and III, where a scale variable, “extension of social ac- tivity”, is replaced by dummy variables, “A1” to “A9”, the AUC value increased slightly. Regarding Model III, the inclusion of several categorised variables further increas- es the AUC value. According to Hosmer and Lemeshow (2000), while Model I presents an acceptable performance level, Model II and III are considered to portray excellent discrimination. Based on Hosmer and Lemeshow tests (Table 12), the models adequately fit the data.
Table 12.
Hosmer and Lemeshow Test for Models I, II, and III
Model Chi-square df Sig.
I. 9.830 8 0.277
II. 5.814 8 0.668
III. 3.596 8 0.892
Source: own compilation, based on Erste Bank Hungary Ltd. (2017b)
Three decision trees are created to find the strongest in- teractions between the dependent variable (success of the application) and the independent variables used in the three logit models above. The analysis identifies the char- acteristics of groups of applicants and the classification rules for the selection process. The CHAID (Chi-squared Automatic Interaction Detection) method uses Pearson’s Chi-squared to decide on variable splits.
Figures 10 and 11 show the tree-based classification model of the variables for Models I, II and III. Using the explanatory variables of Model I and Model II, we get the same results: the parent node containing all applicants splits only into two child nodes, one contains the projects with lower classification, the other incorporates those pro- jects which are classified as “Medium” or “High”, in terms of their economic feasibility. According to the results, a higher “economic feasibility” increases the probability of getting selected in the programme (50.5 percent). It is no- table that this is not sufficient to meet only this one condi-
tion to be a participant, as the group includes almost the same proportion of non-participants (49.5 percent).
Figure 10.
Decision tree for Models I and II
Source: own compilation, based on Erste Bank Hungary Ltd. (2017b) Figure 11.
Decision tree for Model III
Source: own compilation, based on Erste Bank Hungary Ltd. (2017b)
Based on Figure 11, only the variable “business plan”
has a strong interaction with the dependent variable (suc- cess of the application) in Model III. Results show that although the existence of a sound business plan signifi- cantly increases the chances of being a participant in the programme, but it is not guaranteed.
The third tree (Figure 12) shows the result of Model III when the variables “business plan” and “inputs and demand” (which refer to the economic feasibility of a pro- ject) are excluded from Model III. In this case, “life cycle”
is the predictor variable used for the primary split. If so- cial entrepreneurs already have an existing prototype or a continuous supply of goods or services, the probability of being a participant is 50.6 percent; otherwise, it is only 24.6 percent. However, if a social entrepreneur had only a business idea or plan, this probability is increased by
14.3 percentage points, if they are socially active in the field of employment. If the entrepreneur does not operate in this field, the probability of getting admitted is cut to 7.7 percent.
Figure 12.
Decision tree for Model III excluding the economic feasibility of the projects
Source: own compilation, based on Erste Bank Hungary Ltd. (2017b)
According to the decision tree analysis, the most impor- tant classification rule in the selection was the projects’
economic feasibility and, especially, the elaboration of the business plans. In addition, we can also see hidden prefer- ence for a specific field of activity, like employment.
Conclusion
We analyse the relationship between the odds of enrol- ment in a development programme and success factors for social entrepreneurs in the application for Erste SEEDS programme. We find three critical success factors: the ex- tension of social impact, financial sustainability and the life cycle of the projects.
For the successful selection of an applicant, it is es- sential that the extension of a project’s social impact be as wide as possible while the applicant should be socially ac- tive in a limited number of areas. Financial sustainability is also necessary, even in the case of social entrepreneurs.
Thus, it is advisable to have a detailed business plan at the time of application. The life cycle of the projects is also decisive: the more advanced the implementation of
a project, the greater the odds of being a participant. If the social entrepreneur has only a business plan or idea, the probability of getting selected is dramatically higher, especially if they are socially active in the field of em- ployment. It seems that community building, protection of environment, health and sustainable lifestyle were less preferred than the other activity areas, like employment or social integration.
Results show some hidden preferences in the review process, especially in terms of economic feasibility; these preferences were not stated directly in the call for applica- tions. These findings can be of interest not only for future applicants and for the decision-makers responsible for the fine-tuning of the Erste SEEDS programme, but also for other banks designing their own CSR schemes.
References
Erste Bank Hungary Ltd. (2017a, September 29.). Devel- opment status. [PowerPoint slides].
Erste Bank Hungary Ltd. (2017b). Összes beérkezett és bírált pályázó. [Data file and code book].
Erste Bank Hungary Ltd. (2018, June 8). Záró ünnepség, Erste SEEDS program. [PowerPoint slides].
Erste SEEDS. (2020). Erste SEEDS Program. Retrieved from https://kampany.erstebank.hu/extras/ersteseeds/
index.html
European Commission (2012). Comparative study of the project selection applied in cohesion policy pro- grammes 2007-2013 in a number of member states.
Final report. European Commission, Directorate Gen- eral for Regional Policy. Retrieved from https://ec.eu- ropa.eu/regional_policy/sources/docgener/studies/pdf/
selection/selection_process.pdf
European Commission (2015). Proposals submission and evaluation (sections III.5, III.6, IV.1, IV.2). Grants manual. Version 1.4. European Commission, Direc- torate General for Research & Innovation. Retrieved from https://ec.europa.eu/research/participants/data/
ref/h2020/grants_manual/pse/h2020-guide-pse_
en.pdf
Gangi, F., Meles, A., D’Angelo, E., & Daniele, L. M. (2019).
Sustainable development and corporate governance in the financial system: Are environmentally friendly banks less risky? Corporate Social Responsibility and Environmental Management, 26(3), 529–547.
https://doi.org/10.1002/csr.1699
Hámori, G. (2016). A magyarázóváltozók kezelésének egyes kérdései regressziós modellezés során. Statisz- tikai Szemle, 94(1), 5–21.
https://doi.org/10.20311/stat2016.01.hu0005
Hosmer, D. W., & Lemeshow, S. (2000). Applied Logis- tic Regression: Hosmer/Applied Logistic Regression.
Chichester: John Wiley & Sons, Inc.
https://doi.org/10.1002/0471722146
Hsieh, H.-F., & Shannon, S. E. (2005). Three Approach- es to Qualitative Content Analysis. Qualitative Health Research, 15(9), 1277–1288.
https://doi.org/10.1177/1049732305276687
Interreg IPA (2019). Evaluation of the efficiency and effective- ness of the Interreg IPA CBC Programme Croatia - Ser- bia 2014 – 2020, Final evaluation report. Retrieved from https://www.interreg-croatia-serbia2014-2020.eu/wp-con- tent/uploads/2019/11/Evaluation-report_HR-RS.pdf Liang, L.-W., Chang, H.-Y., & Shao, H.-L. (2018). Does
sustainability make banks more cost efficient? Global Finance Journal, 38, 13–23.
https://doi.org/10.1016/j.gfj.2018.04.005
Miralles‐Quirós, M. M., Miralles‐Quirós, J. L., & Redon- do‐Hernández, J. (2019). The impact of environmental, social, and governance performance on stock prices: Ev- idence from the banking industry. Corporate Social Re- sponsibility and Environmental Management, csr.1759.
https://doi.org/10.1002/csr.1759
IFKA NKft. (2020, January 24). Társadalmi vál- lalkozások monitoring/minősítő rendszere. [Power- Point slides].
Weber, R. (1990). Basic Content Analysis. Thousand Oaks:
SAGE Publications, Inc.
https://doi.org/10.4135/9781412983488
Wu, M.-W., & Shen, C.-H. (2013). Corporate social re- sponsibility in the banking industry: Motives and fi- nancial performance. Journal of Banking & Finance, 37(9), 3529–3547.
https://doi.org/10.1016/j.jbankfin.2013.04.023
Zhang, Y., & Wildemuth B. M. (2005). Qualitative anal- ysis of content. 1-12. Retrieved from https://www.is- chool.utexas.edu/~yanz/Content_analysis.pdf