This paper was published In
JOURNAL OF INTERNATIONAL BUSINESS AND ECONOMICS
Vol. 11, No. 1, pp. 104-112. p. 8 (2011)
SUPPLY CHAIN POSITION AND SERVITIZATION EFFORTS OF COMPANIES IN EASTERN AND WESTERN EUROPE
Levente Szász, Babeş-Bolyai University, Cluj-Napoca, Romania Krisztina Demeter, Corvinus University of Budapest, Budapest, Hungary ABSTRACT
Our paper investigates the supply chain position of manufacturing companies in Europe, and the relation of this position to the extent and kind of services these companies provide. Our research builds on analyzing differences between Western and Eastern European companies. For the empirical research the database from the fifth round of the International Manufacturing Strategy Survey is used which covers 445 manufacturing companies from 13 European countries. Based on the connection between supply chain position and the extent and type of services offered dominant business models are identified both in Eastern and Western Europe.
Keywords: manufacturing company, servitization, supply chain position, upstream position, downstream position, vertical integration, outsourcing
1. INTRODUCTION
In today’s market conditions characterized by intense competition and sophisticated customer needs manufacturing companies are gradually shifting towards offering complete solutions, rather than just products for their customers (Miller et al., 2002, Davies et al., 2006). Offering complete solutions for customers requires the innovation of the business model (Visnjic, 2010), incrementally shifting strategy from a product based approach towards offering market packages or bundles of products and services (Matthyssens and Vandenbempt, 2008).
To describe the process by which offering services is becoming more and more important for manufacturing companies, Vandermerwe and Rada (1988) introduced the concept of servitization, arguing that services are able to add substantial value to the core offering of the company. The resulting supply package is termed by operations management literature as product-service system (PSS) (Baines et al., 2009, Manzini and Vezolli, 2003), functional (total care) products (Alonso-Rasgado et al., 2004) or integrated solutions (Davies, 2004).
In searching for the reasons and rationale behind servitization, the response suggested by literature is at least threefold (Baines et al., 2009). (1) The first one is the financial motivation, which refers not only to the fact that offering services around a tangible product can increase revenues (Mathieu, 2001), but also to the fact that services are able to generate a higher and more stable flow of revenues coupled with higher profit margins (Wise and Baumgartner, 1999). (2) The strategic rationale behind servitization is that in manufacturing industries traditional product based competitive advantages (technological superiority, low-cost operations, superior product quality etc.) are becoming more and more difficult to sustain. Under these conditions services represent a potential source of sustainable competitive advantage, since they are less visible and more labour intensive, thus more difficult to imitate (Frambach et al., 1997, Oliva and Kallenberg, 2003). (3) Marketing benefits of servitization refer to the fact that services add value to the core product offering, increasing potential sales and creating greater customer loyalty (Heskett et al., 1997, Correa et al., 2007). According to these benefits it appears that servitization universally represents a favorable direction that every manufacturing company should follow. However, differences between regions and countries may appear (Bhagwati, 1984, Neely, 2008), and companies can generally face serious challenges when choosing the path of servitization (Brax, 2005, Gebauer et al., 2005).
In this paper we argue that the extent and kind of services provided by manufacturing can also depend on the supply chain position of companies. More upstream players deliver raw materials and/or simple components to buyers who build these inputs into their own products. They probably have to serve fewer customers and their products are more commoditized. More downstream players provide more complex parts or subassemblies and serve end users. Due to complexity they might have to add more information and service to their product.
Following this logic, the purpose of our article is to investigate the supply chain position of manufacturing companies in Europe and the relation of this position to the extent and kind of services these companies provide for their customers. Our analysis is based on revealing differences between less developed (ex- socialist) countries located in Eastern Europe, and more developed countries from Western Europe (for the sake of simplicity from now on referred to as Eastern Europe and Western Europe).
Since the transition started in ex-socialist Eastern European countries a new division of labour has been developed in Europe (Guerreri, 1998). A lot of FDI took place in Eastern Europe in order to build factories that serve Western Europe (Donges and Wieners, 1994, Bos and van de Laar, 2004, Dachs et al., 2006).
The enlargement of EU in 2004, when 10 new Eastern European countries accessed the community, enhanced this process further (Garmel et al., 2005), reshaping supply chain characteristics of manufacturing companies from these regions: Eastern Europe became the supplier of Western Europe (Marin, 2006). As it is put by Mudambi, high value added activities are largely performed in advanced market economies, with low value added activities performed in emerging market economies, including the contrast between Western and Eastern Europe, too (Mudambi, 2008). Is it possible that the differences in the level of servitization between countries, found by Neely (2008) depend on this new division of labour?
In order to reach our objectives, in Part 2 we formulate research hypotheses and present the survey used in the empirical analysis. Part 3 introduces research methodology and presents the analysis. Part 4 discusses the results and findings, offering some explanations to business models adopted by manufacturing companies in Eastern and Western Europe in respect of servitization and supply chain characteristics. The last part of the paper presents the conclusions of our research.
2. RESEARCH DESIGN
A large number of manufacturing companies in Western Europe offshore production processes, and one of the most popular target regions are the relatively new EU member states and other Eastern European countries. At the same time in Eastern Europe production outsourcing is rather uncommon (Dachs et al., 2006). This well defined division of labour between Western and Eastern Europe could play an important role in the servitization of European manufacturing industries. The driving forces behind geographical relocation of production processes lie generally in a difference of relative price of labour, natural resources or other factors of production. As a natural consequence, upstream manufacturing processes of the supply chain are outsourced to countries with lower relative factor prices. This includes a shift of labour-intensive or resource-intensive production processes away from the home country, both on company and on aggregate, country level (Lipsey, 2002). Mudambi also argues that while repetitive and low value added manufacturing processes are relocated to emerging economies, the more downstream high value added and creative activities (after-sales services, advertising or brand management) remain in advanced economies (Mudambi, 2008). Analogously, a general pattern of servitization is frequently described as starting with an extensive outsourcing of upstream manufacturing processes and a consequent downstream integration in the supply chain, which facilitates a greater focus on service provision for customers (Davies, 2004). While there are several case study examples which support the relationship between supply chain position and servitization of manufacturing companies (e.g. Oliva and Kallenberg, 2003, Cohen et al., 2006), the literature presents little empirical evidence to confirm this connection.
Consequently, we include upstream and downstream supply chains of manufacturing companies in our research. In order to investigate servitization of manufacturing companies in Western and Eastern Europe in relation with their supply chain positions we formulate the following research hypotheses:
H1: Manufacturing companies in Western Europe occupy a more downstream position in the supply chain than manufacturing companies from Eastern Europe.
Since Western European manufacturing companies extensively offshore and outsource upstream production processes to Eastern Europe and other target regions (Dachs et al., 2006), Eastern Europe seems to play the role of upstream supplier of Western Europe. Consequently, we argue that manufacturing companies from Western Europe position themselves more downstream in the supply chain than their Eastern European counterparts.
In line with typical supply chain positions we also argue that companies in Western Europe position themselves closer to their customers, offering more services alongside their core products.
H2: In concordance with the outsourcing of upstream production processes manufacturing companies in Western Europe are more intensively servitized than manufacturing companies in Eastern Europe.
Literature suggests that incorporating services into a manufacturing company’s offering starts with the supply of product related services, and, on a higher stage, expands towards offering customer related services (Gebauer et al., 2005). These latter represent a shift towards offering solutions (and not just products or services) for the customer and are able to generate higher profit margins for the company (Oliva and Kallenberg, 2003). Thus, not only the extent, but also the kind of services offered for the customers is different in the two regions.
H3: Due to the longer history of market based business development Western European companies offer more customer oriented services than companies in Eastern Europe.
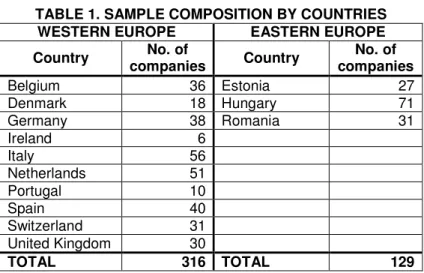
To investigate research hypotheses formulated above the database of the fifth round of the International Manufacturing Strategy Survey (IMSS V) is used, which includes data for 445 manufacturing companies from 13 European countries. IMSS is a survey-based international research project which collects data from manufacturing companies all around the world belonging to the ISIC Rev. 4 Division 25-30 activity sector (manufacture of fabricated metal products, machinery and electronic equipment). The IMSS gathers information regarding manufacturing and supply chain strategies, practices and performances of companies. Questionnaires are mainly completed by manufacturing/operations managers and, where needed, other managers are also involved. Data collection for the fifth round of the IMSS was carried out during 2009 with an average response rate of 23.2% for the participating European countries. For the purpose of our research European countries were grouped into two different categories: Western European countries with evolutionary economic development and Eastern European countries that after some decades of a socialism-detour have returned to the market economy.
TABLE 1. SAMPLE COMPOSITION BY COUNTRIES WESTERN EUROPE EASTERN EUROPE Country No. of
companies Country No. of companies
Belgium 36 Estonia 27
Denmark 18 Hungary 71
Germany 38 Romania 31
Ireland 6
Italy 56
Netherlands 51
Portugal 10
Spain 40
Switzerland 31
United Kingdom 30
TOTAL 316 TOTAL 129
Items of the IMSS questionnaire used in the empirical analysis to describe supply chain characteristics and to assess servitization levels of manufacturing companies are presented in the Appendix.
3. METHODOLOGY AND DATA ANALYSIS
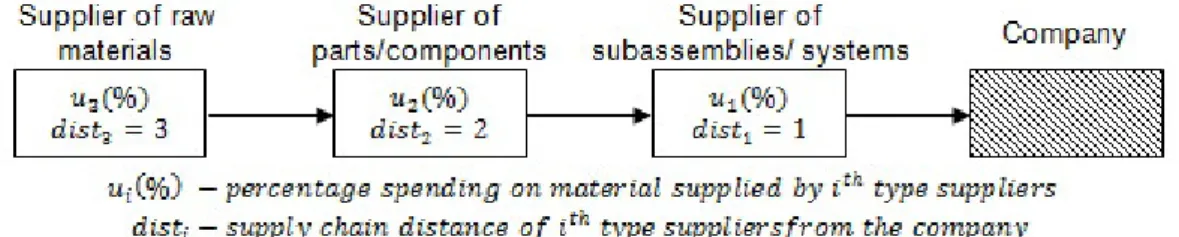
To investigate our first hypothesis, measures of supply chain position were developed based on questionnaire data derived from the items presented in Appendix 1. Starting with the supplier side, an upstream supply chain position measure is developed based on the following logic:
FIGURE 1. MEASURING UPSTREAM SUPPLY CHAIN CHARACTERISTICS
By assessing the percentage spending on different types of supplied materials it can be determined to what extent upstream production processes are incorporated in the company’s operations, or – from another point of view – to what extent the company outsourced these activities to supplier partners.
Combining spending percentages with the corresponding distance measure between manufacturer and supplier a general measure of upstream position can be computed. Thus, upstream supply chain positions of manufacturing companies can be determined according to the following formula:
Knowing that the maximum upstream score a manufacturing company can get is 300 (having only raw materials suppliers), while the minimum is 100 (having only suppliers of subassemblies or systems), Eq. 1 is standardized with linear interpolation in order to be uniformly measured on a [0,1] interval. A standard interval of possible values is particularly important when upstream scores are compared to the similarly standardized downstream measures. Consequently, the upstream position measure is calculated by the following formula.
Analogously, a downstream supply chain position measure is developed based on following logic.
Questionnaire data regarding percentage sales to different type of customers is used (see Appendix).
FIGURE 2. MEASURING DOWNSTREAM SUPPLY CHAIN CHARACTERISTICS
By assessing percentage sales to different types of customers it can be determined to what extent a manufacturing company outsources downstream production processes, or – from the opposite view – to what extent it integrates downstream activities in the supply chain, thereby positioning itself closer to final customers. These categories of sales percentages combined with the distance in the supply chain between a particular type of customer and the manufacturing company offer a general measure of the manufacturers downstream position. Thus, downstream supply chain position is calculated according to the formula below (similarly to Eq. 1).
The maximum downstream score a manufacturer can get is 400 which means that all of its revenues are generated by sales to the end users. Similarly, the minimum downstream score (the least downstream positioned company) is 100 meaning that all of its customers are manufacturers of subassemblies. Using the minimum and maximum possible values we standardize the downstream position measure similarly to
Eq. 2 (see Eq. 4). As a result, values characterizing downstream position of manufacturing companies uniformly fall into the [0,1] interval.
Combining the measurement of upstream and downstream positions (Eq. 2 and 4) we can calculate a measure of overall supply chain position for each manufacturing company. While UpstreamPos measures to what extent a company positions itself upstream in the supply chain, and DownstreamPos describes to what extent a company is positioned downstream in the supply chain, the difference between these two measures offers a good indicator of overall supply chain position of a company. ScPos = 0 means that downstream and upstream positions are similar. ScPos > 0 means an upstream declination, while ScPos
< 0 means a downstream declination.
It is also worth noting that adding the two separate supply chain position measures (Eq. 2 and 4) together offers a good approximation of the degree of vertical integration of a manufacturing company. The higher the value of VertInt, the more manufacturing processes the company embraces.
To investigate our first research hypothesis (H1) a variance analysis (ANOVA) was carried out to search for differences in dominant supply chain positions between manufacturing companies in the Eastern and Western Europe. Results of the analysis are summarized in Table 2.
TABLE 2. DIFFERENCES IN DOMINANT SUPPLY CHAIN POSITIONS BETWEEN EASTERN AND WESTERN EU
Western EU Eastern EU Sig.
UpstreamPos** 0.6581 0.7751 .000 DownstreamPos 0.5349 0.5381 .915
ScPos** 0.1238 0.2498 .004
VertInt** 1.1833 1.3065 .000
** The mean difference is significant at the 0.01 level
Based on the result of the analysis H1 is confirmed: manufacturing companies from Eastern Europe position themselves more upstream in the supply chain (ScPos = 0.2498), while their Western European counterparts occupy a more downstream position (ScPos = 0.1238). However, it is important to add that this difference is only caused by the fact that Western European companies outsource a large part of their upstream production activities (UpstreamPos = 0.6581) which are now partly performed by manufacturing companies from Eastern Europe (UpstreamPos = 0.7751). It is also interesting to note that there is no significant difference in respect of downstream supply chain positions. Manufacturing companies from both Western and Eastern Europe position themselves to the same distance from end users (DownstreamPos = 0.5349, and 0.5381, respectively). As a natural consequence, manufacturing companies from Eastern Europe are more vertically integrated (VertInt = 1.3065) than their Western European counterparts (VertInt = 1.1833). In order to ensure the coherence of our results company size (measured by the total number of employees) was also included in the variance analysis, but no significant difference was found between the two regions.
In order to investigate our second research hypothesis first we had to check if supply chain position of companies has a significant effect on the levels of servitization. Servitization levels (ServLevel) were assessed by computing the mean value of the intensity of different service offerings of each manufacturing company (see Appendix, Item S1). Then, a correlation analysis was carried out to investigate the relationship between supply chain position measures and servitization level in the whole European sample. Results are summarized in Table 3.
TABLE 3. RELATIONSHIP BETWEEN SUPPLY CHAIN POSITION AND SERVITIZATION LEVEL ServLevel Sig.
UpstreamPos** -0.278 .000 DownstreamPos** +0.208 .000
ScPos** -0.318 .000
VertInt -0.012 .762
** Relationship is significant at the 0.01 level
Results of the correlation analysis suggest that there is a moderately strong negative relationship between supply chain position and the servitization level of European manufacturing companies. The more upstream a position in the supply chain, the less service is offered, and – in concordance – the more downstream a company’s position in the supply chain, the higher the level of servitization. Vertical integration seems to have no influence on the intensity of service offerings.
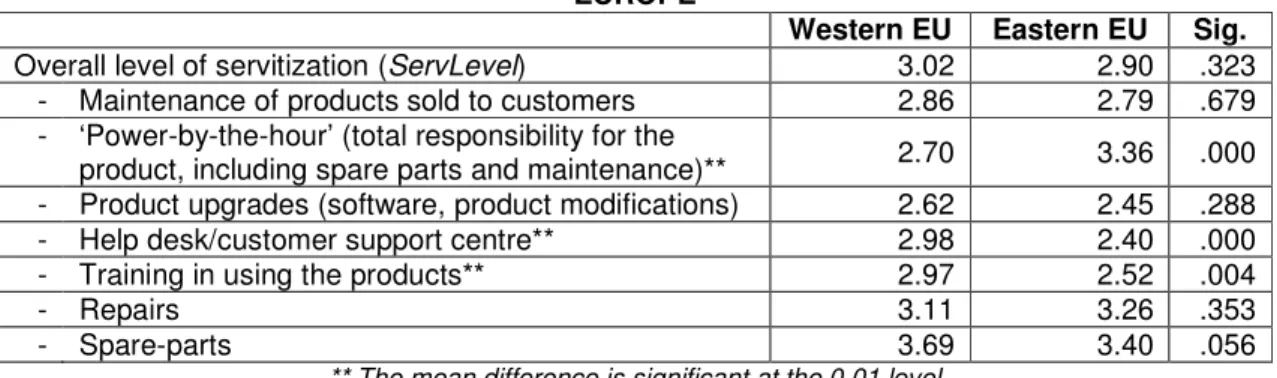
Even if there is only a moderately strong relationship between supply chain position and servitization level, we expect higher levels of servitization in Western Europe where manufacturing companies are positioned more downstream in the supply chain. Consequently, a variance analysis was performed in order to check differences in the intensity of servitization between Western and Eastern Europe. Both the aggregate servitization measure (ServLevel) and, particularly, each type of service offering (see Appendix 1, Item S1) was included in the analysis. Results are shown in Table 4.
TABLE 4. DIFFERENCES IN THE LEVEL OF SERVITIZATION BETWEEN WESTERN AND EASTERN EUROPE
Western EU Eastern EU Sig.
Overall level of servitization (ServLevel) 3.02 2.90 .323
- Maintenance of products sold to customers 2.86 2.79 .679 - ‘Power-by-the-hour’ (total responsibility for the
product, including spare parts and maintenance)** 2.70 3.36 .000 - Product upgrades (software, product modifications) 2.62 2.45 .288
- Help desk/customer support centre** 2.98 2.40 .000
- Training in using the products** 2.97 2.52 .004
- Repairs 3.11 3.26 .353
- Spare-parts 3.69 3.40 .056
** The mean difference is significant at the 0.01 level
Results of the analysis suggest that H2 is not valid, since the overall level of servitization (ServLevel) does not differ significantly between the two regions. The relationship, however, is to some extent unclear: one type of service offering (‘Power-by-the-hour’) is significantly higher in Eastern Europe, while two other types of services (help desk/customer support centre, training in using the products) are significantly higher in Western Europe.
For the third hypothesis we divided services into two distinct categories: product related services, and customer related services. The two service categories are developed as the average intensity of offering following services:
• Product related services: Maintenance of products sold to customers, ‘Power-by-the-hour’, Product upgrades, Repairs, Spare-parts
• Customer related services: Help desk/customer support centre, Training in using the products Results of the modified variance analysis are shown in Table 5.
TABLE 5. DIFFERENCES IN PRODUCT AND CUSTOMER RELATED SERVICE OFFERINGS BETWEEN WESTERN AND EASTERN EU
Western EU Eastern EU Sig.
Product related services 3.0161 3.0667 .681
Customer related services** 2.9801 2.4669 .000
** The mean difference is significant at the 0.01 level
Based on the results of the modified variance analysis we can refine our conclusion regarding the validity of H2. While there is no significant difference in the overall level of servitization, manufacturing companies from Western Europe offer more customer related services than their Eastern European counterparts, thus H3 can be accepted. The higher level of servitization of Western European manufacturing companies is not observable in the level of product related service offerings, but is clearly distinguishable in the case of more advanced customer related service offerings.
4. DISCUSSION
Based on the results of our empirical research and validated hypotheses we revealed that dominant business models differ between the two regions involved in our study: in Western Europe more focused manufacturing companies (that outsourced upstream production processes) with more customer related service offerings are typical, while in Eastern Europe the dominant business model is a vertically more integrated manufacturing company with less customer related services. Thus, our results support previous findings and statements about the lower intensity of outsourcing activities in Eastern Europe (Dachs et al., 2006), or the new division of labor (Lipsey, 2002, Mudambi, 2008). They also partially support Neely’s finding about the higher level of servitization in more developed countries (Neely, 2008).
However, we could further elaborate his empirical result showing that the real difference between Eastern and Western Europe lies in customer related services, which represent a higher stage in the servitization process (Gebauer et al., 2005). Indeed, in order to serve industrial customers companies from Eastern Europe have to be prepared to provide product related services, such as spare parts or repair; that might be a qualifying criteria for their business. However, further enhancement of services does not necessarily pay-off financially for these companies, at least for two reasons. First, Eastern European companies usually win orders due to the low prices they provide: that is the main reason why Western European companies source from Eastern Europe. Any additional service would harm this kind of competitiveness.
Second, Eastern European companies should make large efforts in order to reach similar level of services than in Western Europe: their environment, and workforce do not provide the same initial basis. Thus, they can easily end up at the servitization paradox (Neely, 2008), where investments in services lead to lower business performance, even if the profit margin of services is expected to be higher than that of products (Wise and Baumgartner, 1999).
5. CONCLUSION
Our paper investigated the servitization of European manufacturing companies in concordance with their dominant supply chain positions. Based on empirical analysis we found that many Western European countries outsourced their upstream processes to Eastern Europe, positioning themselves more downstream in the supply chain than their Eastern European counterparts. Results of our analysis suggest that there is an important relationship between supply chain position and servitization of manufacturing companies. Consequently, even if there is no difference in the intensity of product related service offerings, Western European companies offer more customer related services than Eastern European manufacturers. As a result, the dominant business model in Western EU is a more focused company with more intensive customer related service offering, while in Eastern EU a more integrated company with less customer related service would be typical.
APPENDIX
Supply chain related questionnaire items
SC1. What is the percentage of spending on the following categories of goods purchased (your answers should add up to 100%)?
Raw materials Parts/components Subassemblies/systems Total
_________ % _________ % _________ % 100 %
SC2. Indicate the percentage of sales in the following categories of customers (your answers should add up to 100%):
Manufacturers of subassemblies
Manufacturers of finished products
Wholesalers /
distributors End users Total
_________ % _________ % _________ % _________ % 100 %
Servitization related questionnaire items
S1. To what extent does your business unit/plant offer the following services alongside with the products?
None High
Maintenance of products sold to customers 1 2 3 4 5
‘Power-by-the-hour’ (total responsibility for the product, including spare parts and
maintenance) 1 2 3 4 5
Product upgrades (software, product modifications) 1 2 3 4 5
Help desk/customer support centre 1 2 3 4 5
Training in using the products 1 2 3 4 5
Repairs 1 2 3 4 5
Spare-parts 1 2 3 4 5
REFERENCES
Alonso-Rasgado, T., Thompson, G., Elfström, B., “The design of functional (total care) products”, Journal of Engineering Design, Volume 15, Number 6, Pages 515-540, 2004.
Baines, T., Lightfoot, H., Benedettini, O., Kay, J., “The servitization of manufacturing. A review of literature and reflection on future challenges”, Journal of Manufacturing Technology Management, Volume 20, Number 5, Pages 547-567, 2009.
Bhagwati, J. N., “Why are services cheaper in the poor countries?”, The Economic Journal, Volume 94 (June 1984), Pages 279-286, 1984.
Bos, J. and van de Laar, M., “Explaining Foreign Direct Investment in Central and Eastern Europe: an Extended Gravity Approach”, DNB Working Papers 008, Netherlands Central Bank, Research Department, 2004.
Brax, S., “A manufacturer becoming service provider – challenges and a paradox”, Managing Service Quality, Volume 15, Number 2, Pages 142-155, 2005.
Cohen, M.A., Agrawal, N., Agrawal, V., “Winning the aftermarket”, Harvard Business Review, May, 2006.
Correa, H.L., Ellram, L.M., Scavarda, A.J., Cooper, M.C., “An operations management view of the services and goods offering mix”, International Journal of Operations & Production Management, Volume 27, Number 5, Pages 444-463, 2007.
Dachs, B., Ebersberger, B., Kinkel, S., Waser, B.R., “Offshoring of production—a European perspective”, Frequency, Target Regions and Motives. European Manufacturing Survey, Bulletin 2, Karlsruhe, 2006.
Davies, A., “Moving base into high-value integrated solutions: a value stream approach”, Industrial and Corporate Change, Volume 13, Number 5, Pages 727-756, 2004.
Davies, A., Brady, T., Hobday, M., “Charting a path toward integrated solution”, MIT Sloan Management Review, Volume 47, Number 3, Pages 39-48, 2006.
Donges, J.B. and Wieners, J., “Foreign investment in the transformation process of Eastern Europe”, The International Trade Journal, Volume 8, Number 2, Pages 163-191, 1994.
Frambach, R., Wels-Lips, I., Gündlach, A., “Proactive product service strategies – an application in the European health market”, Industrial Marketing Management, Volume 26, Pages 341-352, 1997.
Gebauer, H., Fleisch, E., Friedli, T., “Overcoming the service paradox in manufacturing industries”, European Management Journal, Volume 23, Number 1, Pages 14-26, 2005.
Guerreri, P., “Trade patterns, FDI, and industrial restructuring of Central and Eastern Europe”, BRIE Working paper series, Number 124, 1998.
Heskett, J.L., Sasser, W.E., Schlesinger, L.A., The service profit chain, The Free Press, New York, 1997.
Lipsey, R.E., “Home and host country effects of FDI”, Paper for ISIT Conference on Challenges to Globalization, May 24-25, 2002, Lidingö, Sweden.
Garmel, K., Maliar, L., Maliar, S., “The EU eastern enlargement and FDI: the implications from a neoclassical growth model”, Working paper, Serie AD 2005-29, Instituto Valenciano de Investigaciones Económicas, S.A., Ivie, 2005.
Manzini, E. and Vezolli, C., “A strategic design approach to develop sustainable product service systems:
examples taken from the ‘environmentally friendly innovation’ Italian prize”, Journal of Cleaner Production, Volume 11, Pages 851-857, 2003.
Marin, D., “A new international division of labor in Europe: outsourcing and offshoring to Eastern Europe”, Journal of the European Economic Association, Volume 4, Number 2-3, Pages 612-622, 2006.
Mathieu, V., “Service strategies within the manufacturing sector: benefits, costs and partnership”, International Journal of Service Industry Management, Volume 12, Number 5, Pages 451-475, 2001.
Matthyssens, P. and Vandenbempt, K., “Moving from basic offerings to value-added solutions: Strategies, barriers and alignment”, Industrial Marketing Management, Volume 37, Number 3, Pages 316-328, 2008.
Miller, D., Hope, Q., Eisenstat, R., Foote, N., Galbraith, J., “The problem of solutions: Balancing clients and capabilities”, Business Horizons, March-April, Pages 3-12.
Mudambi, R., “Location, control and innovation in knowledge intensive industries”, Journal of Economic Geography, Volume 8, Number 5, Pages 699-725, 2008.
Neely, A., “Exploring the financial consequencies of the servitization of manufacturing”, Operations Management Research, Volume 1, Number 2, Pages 103-118, 2008.
Oliva, R. and Kallenberg, R., “Managing the transition from products to services”, International Journal of Service Industry Management, Volume 14, Number 2, Pages 160-172, 2003.
Vandermerwe, S. and Rada, J., Servitization of business: adding value by adding services, European Management Journal, Volume 6, Number 4, Pages 314-324, 1988.
Visnjic, I., “(Revisiting) servitization: When is a service oriented business model innovation effective?”, Case Studies in Service Innovation, Centre for Service Research, Manchester Business School, The University of Manchester in collaboration with SRII Service Innovation SIG, Pre-conference version June 7th 2010, 30-32.
Wise, R. and Baumgartner, P., “Go downstream. The new profit imperative in manufacturing”, Harvard Business Review, September-October, Pages 133-141, 1999.
NOTE: The authors wish to thank for the financial support provided from programs co-financed by The SECTORAL OPERATIONAL PROGRAMME HUMAN RESOURCES DEVELOPMENT, Contract POS DRU 6/1.5/S/4 – „Doctoral studies, a major factor in the development of socio-economic and humanistic studies”;
The authors also wish to express their acknowledgement for the support from the Hungarian Research Funds (OTKA, T 049147) and from the Bolyai János Research Scholarship program.
Levente Szász, PhD student at the Babes-Bolyai University, Cluj-Napoca, Romania, Faculty of Economics and Business Administration, Department of Management.
Krisztina Demeter, PhD, associate professor at the Corvinus University of Budapest, Hungary, Faculty of Business Administration, Department of Logistics and Supply Chain Management.