THESES OF THE DOCTORAL (PhD) DISSERTATION
GERGELY TESCHNER
MOSONMAGYARÓVÁR
2014
1
THESES OF THE DOCTORAL (PhD) DISSERTATION
UNIVERSITY OF WEST HUNGARY
FACULTY OF AGRICULTURE AND FOOD INSTITUTE OF ECONOMIC SCIENCES
MOSONMAGYARÓVÁR
Programme leader:
DR. ANTAL TENK Professor Emeritus
Scientific leaders:
DR. RÓZSA CSATAI CSc DR. ANTAL TENK CSc Reader in University Professor Emeritus
PRESENT AND FUTURE DEVELOPMENTAL OPPORTUNITIES FOR THE MANAGEMENT INFORMATION SYSTEMS OF DAIRY BUSINESSES
Written by:
GERGELY TESCHNER
MOSONMAGYARÓVÁR 2014
2
1. INTRODUCTION, OBJECTIVES
Everywhere in the world, including Hungary, it can be observed (and verified by researches) that the number of companies where no IT solutions and devices are used is steadily decreasing. The amount of the data and information stored by the new technologies is growing exponentially; the businesses need to compete with rival companies in the ever growing sea of information, and meet the expectations of the owners and special authorities.
It is the managers’ job is to make well-founded and good decisions, keeping in mind the objectives of the enterprise. To do this, they need relevant data and information in quickly processable form.
It would be unthinkable for a larger organization not to use a transaction processing system for the storage and fast processing of the data generated during the operation. If arranged in a database, useful information can be obtained from the generated large amount of data - using additional managerial information systems. It is desirable that comprehensive information is available about each detail of the business. However, under the present technical conditions it is not possible and even people have a limited ability to choose from several possible alternatives in a decision-making situation totally objectively.
A wide range of research has been conducted into the development of the managerial information systems, and a part of the results has been put into practice already. Regarding the development of the individual systems, simple spreadsheet software or even complex company management systems may be involved.
It can be stated about the dairy enterprises, the subject of my study, and about the whole of the agriculture that research results and the developments of decision-supporting systems have been published for several decades. Despite this fact, the designed and used systems are not at the level of development the experts have hoped in advance.
The research covers the decision-supporting systems of the Hungarian dairy businesses. The literature provides a global overview of the situation and the problems of the dairy sector in the European Union and in Hungary. The theme requires that the researches of the previous period should be presented therefore, while processing the literature,
3
the procedures and IT systems created to solve the problems in Hungary are presented from the 1960’s.
During the research, a decision-supporting system has been developed, which – as we hope – may help the Hungarian dairy producers in making their decisions much better than before. For the system’s separate use or its installation into other systems – together with its spreading in Hungary – the essay presents the software’s source code, as well.
The ultimate goal of the primary researches – preceding the dissertation – is a science-based innovative development based on wide-ranging studies conducted in practice which, using information from own studies, provides a new decision-supporting system for cattle farms and milk production/dairy enterprises.
To achieve this ultimate aim, the following sub-goals and research phases are established:
1. The presentation of the main features and business parameters of the dairy companies using this system to prepare the proper adaptation of the decision-supporting information system to be elaborated.
2. At national level, to assess the status of IT solutions supporting managerial decision-making related to milk production at dairy companies currently, particularly the planning’s information technology support.
3. To identify the deficiencies and areas for improvement during the application of decision-preparing and decision-supporting systems and software used currently in milk production.
4. To designate a database required to build and effectively operate the new decision-supporting system to be developed.
5. Based on the information gained while achieving the targets in the previous four sections, to develop new decision-supporting software, compared to the widely spread information systems, which mainly supports planning, and is consistent with other software and offers options to the management while decisions are made.
4
2. MATERIAL AND METHOD
The primary data processed in the dissertation came from the whole territory of Hungary. During the studies, the selection of the sample involved such companies with independent legal entity which employed more than 50 persons and their spheres of activity in the records of the Court of Registration included the activity “breeding dairy cattle” under the TEAOR (Hungarian NACE) code 0141. This business sector includes:
breeding dairy cattle and buffaloes;
the production of raw milk.
The sample has been formed based on the database of the Complex CompanyInfo with stratified sampling method.
The survey formed part of the GOP-1.1.1-09/1-2009-0007 R & D tender invited within the framework of the NHDP, in which the earlier defined targets include the survey of raw milk producing and dairy cattle husbandry companies in terms of information technology, especially in relation to the managerial decision-making and the support of planning related to production.
The complexity of the topic justified qualitative field research as the method of primary research, and in-depths interviews were conducted as a solution.
The interview was preceded by the development of a draft interview, which was matched to the project’s objectives.
2.1. In-depth interview and research
After the sample to be tested has been produced, we have contacted the companies in the samples by e-mail and on the phone. After checking, we managed to personally visit each company which indicated their intention to participate.
This represents a total of 20 companies. The number of interviewees differed per company. The aim was to include professionals from as many areas as possible into the study to approach the problems from different levels of the corporate hierarchy.
Each time the competent staff working for the management, accounting, crop production, animal husbandry and information technology have also been interviewed.
5
The interviews progressed along the topics of a pre-drawn sketch interview, and voice recordings were made to form the basis of a subsequent analysis.
The details of 15 companies out of the 20 companies involved in the interviews were used for the final evaluation. It occurred that some companies ceased producing milk in the meantime, the activity was only included in the company database.
The analyses were performed as per the topic groups of a draft interview, divided according to subtopics. The notes taken during the interviews and the voice recordings meant great help. The dissertation does not include the complete evaluation, only the results directly related to the subject areas are detailed.
The various interviews were compared with the help of the key words’
standardization and coding. These data were evaluated using spreadsheet software and SPSS v.19 statistical software.
2.2. Secondary research of the companies involved in the study
The sample to be tested has been produced under the conditions described earlier in this chapter. The sample has been represented using the balance sheet data provided by Complex CompanyInfo. The general statistical analysis of the data has been performed with the help of MS Office Excel.
2.3. Software development
One of the objectives of the research is to identify the IT shortages and problems occurring in connection with managerial decision- making and to present a solution for eliminating such shortages and problems that is available to those affected. Therefore, utilizing my knowledge gained from economic information technology studies, I have developed software with the help of programming techniques that satisfy the requirements of the age.
I do not intend to make the software source code hidden; I will include it in my thesis as an attachment. This way, I would like to contribute to and assist the decision-making of Hungarian agricultural companies. As it can be used, copied, distributed and modified freely, it can serve the more specialized corporate demands, as well.
6 The development affects 4 areas:
design;
creation of a database;
programming;
testing, elimination of errors.
The design has been made with the standard UML 2 (Unified Modelling Language) program language, the language most widely used in the software development industry throughout the world. The UML means Unified Modelling Language, which is a general-purpose visual modelling language and is used to specify, visualize, design and document the architecture of the software.
Based on the so produced design diagrams, the source code can be written and the software, that can run, can be developed which is ultimate goal of the development process.
The UML language supports the approach and the design philosophy of the modern object-oriented programming languages.
While forming the database structure, we focussed on extensibility, multi-user access possibility, and on the demand that the technology should be a widespread one. The opportunities offered by the system of criteria were limited by the available knowledge and experience.
Thus, the choice fell on the MS SQL relational database-handling server, developed by Microsoft. In order to get the program to work together with the different relational database management systems, the so called LINQ language was added, a uniform programming model for any kind of data source. LINQ provides the opportunity to inquire and change the data in a uniform manner, regardless of the database. It is a new data abstraction layer between the actual data and the software working with the data.
MS-SQL Server Express served as database server.
During programming, in terms of the programming language, the object-oriented approach also came to the fore with the choice of the C # language, which was developed by Microsoft as part of the .NET Framework object-oriented programming language. To its development, the C++ and Java programming languages served as basis.
As software development environment I used Microsoft Visual Studio 2010.
7
3. RESULTS
3.1. The main features of the companies involved in the in-depth interview and research
A table has been complied about the companies engaged in the TEAOR 0141 activity: “dairy cattle breeding” based on the data of the Central Statistical Office (CSO). This table is supplemented by the number of the companies involved in the interview; the number of companies involved in the interview has been displayed in each class which was divided based on the numbers of the employees (Table 1).
Table 1: number of the companies performing TEAOR-0141 activity (2008-2010):
Notes: number of companies 1-4
pers ons
5-9 pers ons
10-19 person
s
20-49 perso
ns
50- 249 perso
ns
250- pers
ons
Total
2008 314 53 57 111 78 6 619
2009 227 40 50 112 79 6 514
2010
169 38 44
107
(100 %)
75
(100
%)
4
(100 %) 437 Companies
involved in
the study
1 13 1
15Companies involved in
the study 0% 0% 0%
1% 17% 25%
Source: CSO, own editing
In Table 1, the companies are listed from 2010 to 2008 which have carried out the activities that form the subject of studies. In the year 2010, when the study with in-depth interviews was conducted, there were 437 of such companies in total. In the 4th row of the table, the companies involved in the interview are listed, below that the ratio of
8
the number of companies is included, compared to the maximum number of companies that can be involved.
Based on the classification per headcount-category given by the CSO, the headcount of 13 companies was between 50 and 249 persons, which give 17% of the firms in the category of companies registered in dairy cattle breeding in Hungary. For one company, the number of employees was 369, which gives 25% of the mass. This sample size can ensure the representativeness of the studies.
The following list contains the companies by name and the code used for the rest of the study:
V01: GAK Nonprofit Közhasznú Kft. (Ltd) V02: Tedej Zrt. (cPlc.)
V03: Solum Zrt. (cPlc.)
V04: Bicskei Mezőgazdasági Termelő és Szolgáltató Zrt.
(Agricultural Production and Service cPlc) V05: Claessens Kft. (Ltd)
V06: Duna Gyöngye 2000 Mezőgazdasági Zrt. (The Pearl of Duna 2000 Agricultural cPlc.)
V07: Felsőnánai Agrár Kft. (Agricultural Ltd)
V08: Középtiszai Mezőgazdasági Zrt. (Middle-Tisza Agricultural cPlc.)
V09: Hajdúböszörményi Mezőgazdasági Zrt. (Agricultural cPlc.) V10: Jászapáti 2000 Mezőgazdasági Zrt. (Agricultural cPlc.) V11: Pély-Tiszatáj Agrár Zrt. (Agricultural cPlc.)
V12: Petőfi Mezőgazdasági Szövetkezet (Agricultural Cooperative) V13: Canko 2000 Kft. (Ltd)
V14: Agroprodukt Zrt. (cPlc.)
V15: Gödöllői Tangazdaság Zrt. (Training farm cPlc.)
The survey covered a total of 12 counties and six regions. Businesses of very different features and sizes participated in the survey; the high proportion of the private limited companies is the result of the parameters used for the design of the samples.
We have examined the revenues of the companies included into the survey during the period ranging from 2008 to 2011. In the year 2010 – during the period of the in-depth interviews - seven companies had a net turnover of less than HUF 1 billion, the revenues of three companies were between HUF 1 to 2 billion, and of four companies
9
between HUF 2 to 5 billion, and the revenue of one company exceeded HUF 6 billion.
The negative change in the revenues was slight in seven cases from 2008 (the average was more than 10 percent per year). These seven companies reported on a decline; in eight cases the revenues have grown.
In terms of the average change in the value of the companies’ assets, four companies suffered a decrease during the period from 2008 to 2011, however, in all the four cases the decrease was less than 10 per cent. The value of the assets of 11 companies has grown; this growth has exceeded 10 percent in the case of 10 companies.
There has been a wide range of the values of assets as well as of the revenues within the sample. The sample ranged from the lower limit of half a billion to a limit exceeding ten billions and the revenue of 87% of the companies did not reach five billion.
A total of 32 persons participated in the interviews conducted at 15 companies. Since the objective was to approach the problems from various directions, we have sought to interview the professionals of several areas. Figure 11 presents the job distribution of the persons involved in the interview and shows that persons from the company management, accounting, crop and livestock production and information technology have participated in the survey.
The basic objective regarding the distribution of the respondents has been achieved; no field represents itself as dominant, we have managed to record sufficiently broad-based and wide-ranging opinions.
The two levels of management, the company directors (21.9%) and the plant managers (25.0%) were treated separately, because the various levels of leadership represent different information and decisions.
3.2. Evaluation of the in-depth interviews
After the interviews, a summary of the responses was made in an essay form. To do so, the records written and voice recordings made during the interview provided assistance.
The following details were recorded in the course of the interviews:
the name of the company;
the site of the interview;
10
the time of the interview;
the participants;
the topics, the answers given to the questions.
Table 2: Software used in the companies
Company MS
Excel
MS Access
Riska Talp Boumatic/Alpro/Westfal ia
V01 Yes Yes Yes Yes
V02 Yes Yes
V03 Yes Yes
V04 Yes Yes
V05 Yes Yes
V06 Yes Yes
V07
V08 Yes
V09 Yes Yes
V10 Yes Yes
V11 Yes Yes
V12 Yes Yes
V13 Yes Yes
V14 Yes Yes
V15 Yes Yes Yes
Total: 4 1 13 1 11
Source: own study
The software used by 15 milk producing companies is listed in Table 2. The question was primarily directed to the existence of the given
11
software; we will discuss the possibilities of the software application, its frequency and the main characteristics later.
After the overview of the used software we have found that only the company V01 uses the program “TALP” (Farm Data Gathering and Acquisition Software) developed by Livestock Breeding Performance Testing Ltd., for testing presently, in addition to other software with different functionalities.
Four farms additionally use Microsoft Excel spreadsheet program to manage the primary animal data and the changes in the stock.
From among the respondents, a single co-operative has worked with the Microsoft Access database management program, which is connected to the Boumatic milking system; therefore the import of the production data is solved.
The development was performed by the cooperative’s animal breeder, fully adapted to their own needs. The data can be accessed from two computers connected into a network; when asked, they were able to make 28 types of queries. It is suitable to register animal stock data, breeding data, production data, veterinary treatments, and medicines.
The employees have worked with a milk-house system’s computerized data acquisition module on 11 farms; Alpro and Westfalia were used in one case each, and the Boumatic milk-house system was available to the other 9 companies.
From among the examined 15 businesses, 13 companies use the Riska software provided by System Ltd.
With the exception of one case – where the data is entered manually – a connection with the milk-houses is created through an interface.
The connections and the potential shortcomings of the production and management IT systems were examined during the interviews.
93% of respondents agreed that the available and used milk-house and plant management systems are not directly connected to the accounting. The data is flown manually; the data is moved from the software manually into the accounts based on printed lists.
The economic events are recorded double; the time consumption and the risk during the data entry are doubled. The respondents, regardless of their field of work, have emphasized both problems. The data flow is slow between the separate systems therefore they do not have up-to- date information.
12
During the interviews, the general expectation has been that the plant management software should have a connection with the inventory and general ledger software.
In 14 out of the 15 enterprises – where at least milk-house or plant management system is available – the staff of 7 companies thought that the information gained from the daily operation does not support the decision maker. The details are not presented to them in a structure, which would serve their needs in decision-making. This problem refers to the farm manager and / or farmer's decisions.
50 percent of respondents reported not being able to fully utilize the opportunities and functions offered by the program. The computer is not used for operational decisions, even though the data and information are stored on them, which could be used to base their decisions on. Paper-based records are used instead of computers. In four cases, it was said that the handling of the programs is complex;
they have too much functionality, even ones which are not needed at all.
The interviews also revealed that the users do not have the skills to use the computer and the plant management systems and there is not enough managerial pressure, which would encourage the plant manager to have his decisions supported by a computer.
Another part of the interview questions aimed to explore what IT support the companies’ leaders use in making their decisions. This issue covers the information on the topics: planning, analysis, and decision-making.
The information practices of design, analysis and verification show differences at the examined companies. The study aimed to see what concept the leaders follow during planning, on what surface the plans are made, and what needs arise in this context.
All of the companies are producing at least an annual plan, 13% of the queried companies said that they do not use quarterly or monthly plan data. The completed annual plan is checked once a year.
33% of the respondents break down the annual plan to quarters, and prepare plan data from them. The plan data is also analysed and monitored on a quarterly basis. More than half (53%) of the businesses formulate their plans in a monthly breakdown, and their checks are performed monthly. It has also occurred that the fact data were not correlated with the plan data, but to the same period of the previous year.
13
During the interview, the leaders kept addressing the issue of planning and decision supporting as a particular problem. The comparison of the plan data and fact data help them to adapt to the potential changes quickly. It is true that planning and analysis are rather time-consuming for both the sector managers and the company's manager at each company.
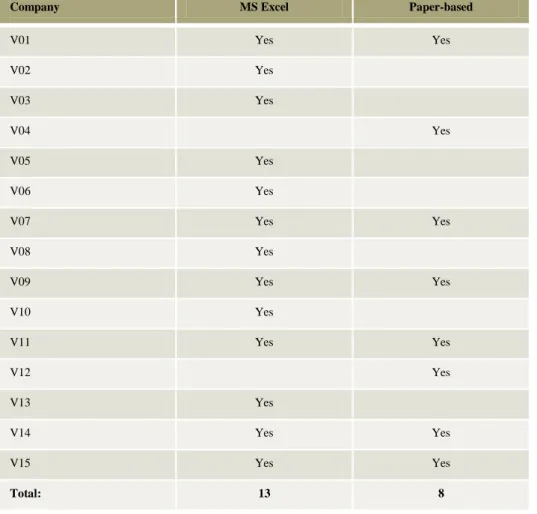
It was an issue connected to the topic how the planning is made, how the plan data and fact data is compared and checked. The responses are shown in Table 3.
Table 3: Founding the manager’s decisions
Company MS Excel Paper-based
V01 Yes Yes
V02 Yes
V03 Yes
V04 Yes
V05 Yes
V06 Yes
V07 Yes Yes
V08 Yes
V09 Yes Yes
V10 Yes
V11 Yes Yes
V12 Yes
V13 Yes
V14 Yes Yes
V15 Yes Yes
Total: 13 8
Source: own study
14
Almost all the surveyed businesses use the spreadsheet program (Excel), which is part of the office suite (MS Office). 86% of them use Excel, in which the plan data and fact data is recorded manually, and typographical errors occur during the data entry. 53% of the businesses prepare their plans on paper. It was surprising to hear a company manager say that he prepares the plan on a “grid paper” and records the fact data monthly. None of the studied companies used software for planning-analysis and decision-supporting purposes.
The company managers unanimously answered in the affirmative to the question whether a computer is required to support their decisions.
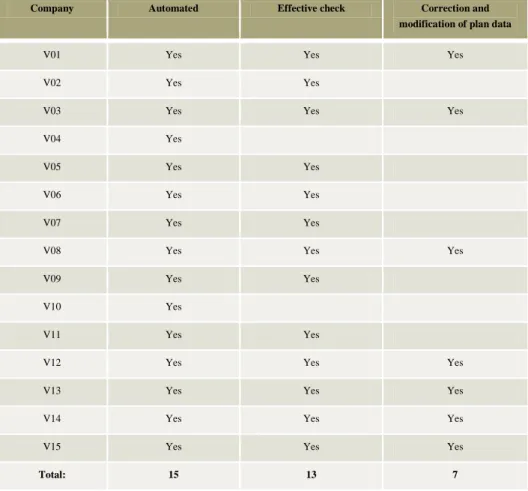
The opinions on imaginary software are shown in Table 4.
Table 4: The needs towards a decision-supporting system in the planning
Company Automated Effective check Correction and
modification of plan data
V01 Yes Yes Yes
V02 Yes Yes
V03 Yes Yes Yes
V04 Yes
V05 Yes Yes
V06 Yes Yes
V07 Yes Yes
V08 Yes Yes Yes
V09 Yes Yes
V10 Yes
V11 Yes Yes
V12 Yes Yes Yes
V13 Yes Yes Yes
V14 Yes Yes Yes
V15 Yes Yes Yes
Total: 15 13 7
Source: own study
15
Every manager would like to eliminate or at least minimize the recording of any erroneous data; they could imagine a system which collects the fact data in coordination with the general ledger’s system.
It means a form of automation in software, avoiding the double or triple manual data entry.
86% of the queried managers expect from the envisioned software to enable a more effective check, i.e. to exercise the control over the important areas, the analytic indicators, and the cost data in a transparent manner.
47% of the respondents expect from the software to respond to the economic and environmental changes during the year, thus help them to modify the plan data.
3.3. Creating a database to support the decisions related to the cattle industry
The needs and the examined decision-making areas arising during the interviews showed the necessary direction and the essential criteria of software development. It has become clear that there is no program for the cattle farms leaders that would help them in the planning, checking and decision-making process.
It also seemed important to not just create a theoretical model from the studies, but also to create software – tested in practice - and to permit its use by making its source code public.
During the in-depth interview and survey, a variety of unique, company-specific needs were formulated due to the different managerial perspectives and leadership styles.
Practical professionals, company managers and livestock producers had to be involved in the development. Finally, two companies were involved in the development, with which a working relationship could be maintained throughout the entire process.
As a result of this co-operation, there has been cooperation with the above-mentioned companies in design, database forming, software writing and program testing.
During the design, based on experience of the interviews, in connection with the software’s functionality, planning and decision- supporting tasks had to be provided.
16
Taking into account the information technology requirements and the opportunities of the users, the task is to provide state of the art equipment / tools and technologies. The system, to be established, needs to be made suitable to operate in a network and to automatically import the data.
Based on the second section of the objectives, the indicators were surveyed which were considered to be critical by the decision-makers in the top management’s information system, because their weight significantly affects their decisions. With the help of the middle and top managers, we could record the data groups, which they would definitely like use during planning, while creating a database, which should serve as a reference point in comparison with the fact data.
Four main groups have been established:
dairy farm;
young livestock;
fattening stock;
veal stock.
Based on the interviews, as well as during the consultations, the monthly plan - fact plan comparison seemed to be effective, therefore the program has been formulated accordingly. The plan data is entered per monthly unit, and the comparison is made in a monthly breakdown.
It was important during the design that the software should not contain a lot of functionality; it should rather focus on the needs of the users to avoid creating an opaque system due to the unnecessary features.
During planning, the ease of use had to be especially focussed on, which the interviewees requested separately. The managers have created the annual, quarterly and monthly plan data mostly with the help of spreadsheet software. While creating the user interface, our primary goal was to make it easy to use and transparent for the users.
Based on the results of the interviews, it was also a basic requirement not to add new, independent software into the company’s routine, into which the general ledger data should be entered and recorded manually. To counteract it, the development of a one-way interface was needed to prevent any new possibility for errors during the data entry, thus saving working time by automating the process.
17
There is a one-way relationship between the general ledger system and the database, while there is a two-way relationship between the users and the database. With this solution the practice can be followed, that the person on top of the corporate hierarchy determines the following year's plan data within the company. He can even record them, and then the Accounting sends the fact data from the general ledger system to the database. The plan-fact analysis can be monitored at the other levels of the corporate hierarchy, as well.
The environment, surrounding the business, is constantly changing, unexpected events may occur. The changed circumstances generate new decision-making situations; it is important for the manager to quickly recognize the new situation. To this end, a warning function has been incorporated, indicating the set deviation from the plan data and the fact data to the user.
To ensure that the created software’s practical use can be solved with the different managerial approaches, the system had to be designed to be extensible and able to satisfy the individual, firm-specific managerial requirements. Therefore, the full data of the general ledger has been included in the database server, where further data manipulations can be performed.
While designing the database, it was a major aspect to choose a technology that meets the modern requirements. It was necessary to develop a database server, because large amounts of data had to be used, even going back several years with great data security. It is a relational database where the relation is none other than a two- dimensional table, with the data stored in the table’s rows. The relational database is the total of these relations. The logically related data is stored in the rows of the relation and the data on the same quantity is displayed in the columns.
The database planning was made up of several steps. First, the system to be mapped in the database is analyzed, then the range of data to be stored is determined, then the connections between the relations are examined. The logical database model has been formulated in the light of the businesses’ software and hardware systems. The final design of the database was made via the MS-SQL Server Express.
It is important that the source code does the need to be rewritten if different database servers are needed. Therefore, the LINQ language has been installed into the program code.
18
The data CSV (Comma-Separated Values), arriving from the general ledger system, is a comma-divided text file, in which the text fields are separated by a comma (,).Table 11 shows a detail of a CSV file to be imported.
The data are coming from the general ledger system, distributed as follows, from left to right:
sectoral code;
general ledger code;
general ledger name;
analytical account code;
analytical account name;
balance;
quantity;
number of pieces.
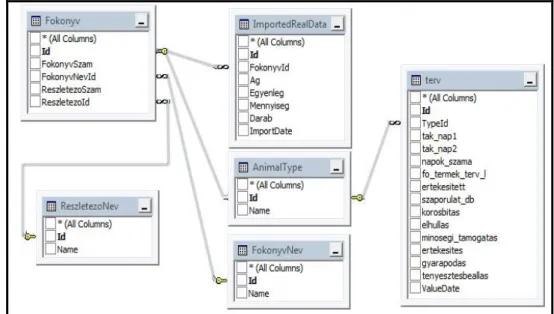
While forming the database tables, these provided the basis. Then, the plan data tables and auxiliary tables were developed. The SQL relational link established after connecting the primary keys and tables is shown in Figure 1.
Figure 1: SQL table connections Source: own editing
19
For the identification of the records, an “id” field has been introduced.
In the database, the design data specified by the user and the data imported from the general ledger system are stored. Using such data through the application interface, the data received on the basis of business logic (i.e. from calculations) are shown. The latter are not stored, they only exist at runtime. The importing is done once a month, always with the previous month’s general ledger data content.
If required, the data can be imported more frequently, even weekly or bi-weekly, with a unique design.
As the two companies involved in the research and development have the same accounting software, the data can be moved between the two systems with the help of the same interface.
3.4. Creating a planning and decision-supporting information system
For programming, it was useful to break down the program to be created to several layers and projects, based on the operation. These are the following:
Business Logic: The source codes found here contain the calculations, the simple multiplication-division operations (for example specific fodder calculations), etc.
Data Access Layer: This layer provides the connection with the database. Each database operation is declared here, together with the plan and the actual data.
Import Layer: The General Ledger data are imported in this layer.
Models: In this layer the source codes are found, which provide the data to be displayed for the user (including the plan and the actual percentage data).
User Interface: This layer is responsible for the user interface.
The software’s colour codes, the function keys, the cells, etc.
are located in these files.
The size of the program would not have justified this kind of complex division, but by this method further improvements are made easier. It provides the basis for any expansion at any direction, satisfying special needs. The end users will have a completely different access to a database than the access on the test computer. To solve this, only the
20
connection declaration described in the Data Access Layer should be modified. If modifications should be performed on the existing data, it is enough to do that in Business Logic and then validate the new methods in the Models layer.
It may also happen that changes need to be made on the user interface, e.g. for the reason that screens with significantly different resolution are used on the given cattle farm.
Such optimization can also be done by modifying the User Interface.
During the in-depth interviews, individual needs were expressed, and with this solution – with less workload - these can be met.
During programming, providing support for the management was a priority. The management’s basic task is to take appropriate decisions to achieve the goals of the organization. During the value creation process, the resources should be focussed on, and then they should be measured, evaluated, planned, and analyzed. Programming, and then the development of the user interface, has been made by taking all of these factors into account.
21
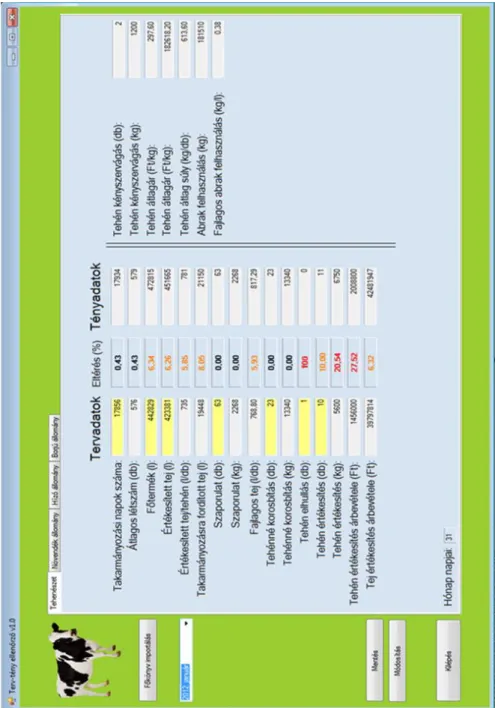
Figure 2: The user interface of the new system Source: Own development
22
Figure 2 shows the dairy farm-related plan and actual data during the software’s running with the real ledger data.
The operation of the program is as follows:
• on the left-hand side the User Function keys are found with which instructions can be given, and there is an item on the list in which the months of the year can be selected by the user;
• the plan data are located on the left-hand side of the main window. The user must specify the content of the yellow cells;
the additional data are calculated values;
• on the right-hand side, the values calculated from the data imported from the ledger system are shown;
• Some of them are comparable to the required plan data, emerged as a demand. The data that are not included here were placed in the rightmost column of the main screen.
It is vital to provide decision-support during the analysis of the design and the actual data in a way to display the difference between the plan and actual data matching the needs of the manager. This was achieved by giving different colour marking to the rated values of differences in the percentage:
0-5%: the difference is not marked with a different colour;
5-10%: orange letters indicate such deviation;
10%<: red-coloured letters indicate the deviation.
The leaders did not wish for the difference directions to be indicated with different colours. They considered awareness-raising important, because further investigation is required if there is a bigger difference in a given field than planned. According to the managers’ demands, also the percentage ranges serving for awareness-raising can be modified.
During the in-depth interview, it also turned out that the managers formulate their annual plan numbers prior to the relevant year and then break them down to the twelve months of the year. In line with praxis, the user handles these plan numbers in the software as shown in Figure 2: he selects the desired month from the list, and then enters the data into the specified cells - marked in yellow. In the case of any error or change of the market environment, it is possible to modify the
23
plan data. As the system compares the plan and the actual data automatically, decision-making based on the new, changed situation will be supported.
In case of any modification, the use of a password is required in order to avoid errors.
If the user wishes to display the plan data for the given month, he has the possibility to record them and save them in the database. During the installation of the software, it is possible to enter the plan and the actual data, before the software’s use, into the database directly.
To create the annual plan figures, the aggregation of data of the prior period has to be solved, too. The summary of the monthly plan data and fact data for the previous year, recorded in the system, facilitates the calculation of the plan figures of the relevant year. The same summary allows the user to evaluate the company's full year performance at the end of the year.
While creating the system structure, attention had to be paid to ensure that the data is available to any user of the company after the plan data has been fixed and stored in the database. Then the accounting fact data can be imported from the general ledger system. The computer system does all the further calculations and makes them available to the user.
Immediately after importation, the manager sees the priority areas which have exceeded the limits set by him.
It is relatively simple to use the system after the training; the user does not have to make complex calculations from the data in the general ledger system. The formulas set out and tested in the Business Logic work directly from the general ledger data; there is no double manual data entry. The combination of these two factors allows the display of accurate data for the decision-maker.
Further developmental demands may come up, including, among others, graphical representation, comparison to the corresponding month of the previous year, and analysis. These improvements are the tasks of the next period.
In our opinion, using the program greatly assists the decision-makers of dairy farms to identify problems and to make their decisions.
On the basis of the in-depth interview and researches, complex corporate management systems have been developed which require major investment into the IT. Their use, however, is only practical at the level of large companies, because expensive IT equipment is
24
needed for the use of the high-performance software, and it requires a larger staff of experts.
Therefore, the objective was to create a simple, easy-to-use, top management information system, which can provide decision- supporting functions even for the managers of the small and medium- sized companies.
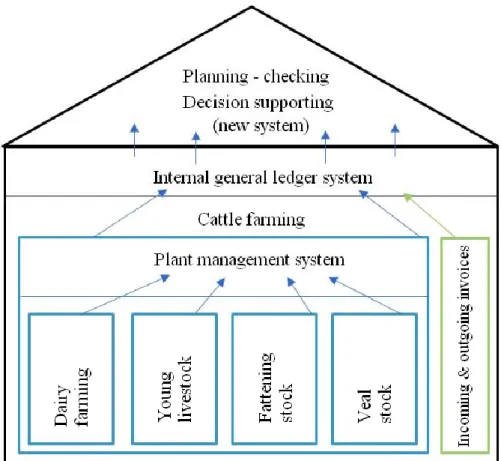
Figure 3: The location of the new system and the sources of information on the operation of cattle farms
Source: own editing
The checking function of the created information system is based on the information collected by the existing systems. Internal and
25
external sources of information are needed to form the target figures.
The planning system developed for the manager can be upgraded and extended due to its structural design. It is based on extensive sources of information, and the system we have developed is based on the information systems in use, which proves that the development and the use of closely cooperating systems can be achieved in practice.
26
4. SUMMARY
Based on our researches and the literature it can be stated that the examination of decision-supporting systems should be the subject of timely and continuous development.
The spread of information technology has not stopped; in addition to the personal computers a new device has appeared which is able to handle a number of new data and information during the operation of agricultural businesses, including the dairy companies.
Along with it, the amount of information flowing to the manager is growing exponentially; the device should be able to filter the relevant data and information in the light of the objectives of the business. Our study has dealt with the decision-supporting systems of Hungarian dairy businesses.
In chapter four of the dissertation, the most widely used systems were presented, bearing in mind the experience gained during the practical application, as well as the results and historical processes preceding the research which underpin the current developmental opportunities.
In chapter six it was discussed in line with the objectives of the dissertation what information systems the surveyed companies have and use, and what data and sources of information the managers are using in the decision-making. During the in-depth interviews and researches, we have gained much information on the habits and expectations of the managers, and about the needs they have against a new decision-supporting system.
Based on the received results, a data base and a connecting information system, supporting the managers, have been developed which can help to make decisions regarding dairy companies.
The research is not completed, further development is expected regarding the created system so that it can support the managerial decision-making more efficiently.
27
5. NEW AND NOVEL SCIENTIFIC RESULTS
The following clear statements can be made from the secondary studies performed during the PhD studies, and from the questionnaire surveys used during the primary researches, in comparison with the results obtained from professional in-depth interviews:
1. Based on the results of the studies it can be concluded that the small and medium-sized dairy businesses are not suitable to operate complex decision-supporting information systems that are available on the market at the present effectively - for objective reasons. Even the relatively large farms with modern IT tools can only use a part of the opportunities offered by the available information systems.
2. The decision-supporting software that facilitates planning and checking, using the results of the research – connected to previously created transaction processing systems – can be matched to the company's other information systems better, providing interactive connection with the company's general ledger system.
3. The developed decision-supporting information system’s primary area of application is sectoral planning.
Due to its structural design, it offers opportunities for the expansion of the system and its further development. With the help of new software tested in practice, it is possible to continuously monitor (visualize) the changes (differences) in the annual plan data and explore the factors generating the changes (differences).
28
6. LIST OF THE SCIENTIFIC PUBLICATIONS AND PRESENTATIONS WRITTEN ON THE SUBJECT OF
THE DISSERTATION
6.1. SCIENTIFIC PUBLICATIONS PUBLISHED IN PEER- REVIEWED JOURNALS IN HUNGARIAN LANGUAGE:
GOMBKÖTŐ, N. – TESCHNER, G. – CSATAI, R. (2010): The features of the Hungarian Grey cattle management in our country.
Economy, 54(5) 523-529 pp.
POGÁNY, É. – SEBESY, ZS. TESCHNER, G. – TROJÁN, SZ.
(2011): The costs of and revenues from milk producing joint ventures in West Transdanubia. Economy, 55(4) 378-386 pp.
SEBESY, ZS. – TESCHNER, G. TROJÁN, SZ. (2012): Alternative methods in milk sales. Dairy: Science and practice LXXII (2012/1-2.) 47-52. pp.
6.2. SCIENTIFIC PUBLICATIONS PUBLISHED OR TO BE PUBLISHED IN PEER-REVIEWED JOURNALS IN A FOREIGN LANGUAGE:
G. TESCHNER – R. CSATAI – N. GOMBKÖTŐ (2014):
OPERATIVE DECISION-SUPPORTING INFORMATION
TECHNOLOGY SYSTEM FOR THE COMPANIES OF THE CATTLE SECTOR , Acta Ováriensis, UNDER PUBLICATION
6.3. LECTURES IN HUNGARIAN LANGUAGE
HEGYI, J. – TESCHNER, G. (2011): Status survey of the IT background of the livestock activities of agricultural businesses.
29
"Sustainability and competitiveness?" 53rd Georgikon Days. Program booklet, and extracts from the read and poster lectures.
CSATAI, R. – TESCHNER, G. – DELBO, B. (2011):
Inventory management models applicable in the agriculture for inventories used for production purposes and for finished product stocks. Agro-informatics 2011 Conference / Innovative information technologies in the agriculture.
TESCHNER, G. – CSATAI, R. – TROJÁN, SZ. (2011):
Status survey of agricultural enterprises in the light of computer- assisted animal master data records. Agro-informatics 2011 Conference / Innovative information technologies in the agriculture.
TESCHNER, G. – HEGYI, J. – SEBESY, ZS. – TROJÁN, SZ.
(2011): Plant management systems in the routine of agricultural businesses.
3rd Animal Husbandry Scientific Days in Gödöllő, Gödöllő, 13/ 10/
2011 91.p.
6.4. OTHER SCIENTIFIC ACTIVITIES
KACZ, K. JR. – KALMÁRNÉ, HOLLÓSI E. – TESCHNER, G.
(editor)
Agriculture and vision of the rural areas. Scientific conference. The 10-year anniversary of teaching EU knowledge at the Faculty.
(Volume I – II). (ISBN: 978-963-9883-27-7; 978-963-9883-29-1)
TROJÁN, SZ. – TESCHNER, G. (editor)
Following in the footsteps of Árpád Hensch – The 3rd National Scientific Conference of PhD students and researchers publishing in Economy.
(ISBN: 978-963-334-107-0)