12
Perception of well-run companies: Opinions of master’s-level business students from Hungary
LÁSZLÓ BERÉNYI1
Defi ning the well-run company requires a comprehensive approach considering the general acceptance of the stakeholder theory. The ASPEN Institute prepared a survey to explore the main characteristics of well-run companies. The results among MBA students show that, beyond attracting and retaining exceptional people, customer orientation and quality are considered the most important factors, while strategic issues and social responsibility are less important. Comparing the results to former international surveys, the sample of Hungarian master’s-level business students shows local characteristics.
Based on the responses of 471 students, the statistical analysis indicates that being a stable employer and eff ective, fl exible operations are more essential than in other samples. The analysis of variance pointed out a signifi cant diff erence between full-time and part-time student reviews. The latter group evaluated strategic and social issues as being more important, and their opinions are closer to the professional concept of management. The results can be used to develop more eff ective content for learning materials in the fi eld.
Keywords: well-run company, ASPEN survey, management education, student reviews, leadership.
JEL codes: C14, M14, M29.
Introduction
Beyond the fundamental task of providing products and services, companies have a broader social role and responsibility. Carroll (2016) diff erentiates economic, legal, ethical and philanthropic levels of responsibility. In a simple approach, the responsibility may cover providing job opportunities, contribution to the local, national and international economy, collaboration with others for environmental protection, local problem solving and other issues. The main challenge of companies remains, but the appearance of the expectations may be transformed with time. Based on the stakeholder theory (Freeman 2013), success can be interpreted as the satisfaction of the stakeholders.
If companies are the building stones of national economies, we can consider well-run companies as the bricks of the headwall. According to this metaphor, exploring both the characteristics and expectations is a key issue in the interest of development.
1 PhD, Associate Professor, University of Miskolc, e-mail: szvblaci@uni-miskolc.hu.
Forum on Economics and Business
22(141), 12–24.
2019/4
Publishers: Hungarian Economists’ Society from Romania, Department of Economics and Business Administration in Hungarian Language at Babeş–Bolyai University, and the Partium Christian University ISSN: 1582-1986 www.econ.ubbcluj.ro/kozgazdaszforum
This study deals with the attitudes of master’s-level business students to the nature of a well-run company. The analysis aims to explore the order of a set of characteristics as well as the diff erences in respondents’ opinions.
The concept of well-run companies
A well-run company adds value to both customers and shareholders (Chikán 2003). Its performance can be measured by fi nancial or management indicators based on ‘hard’ indicators, or it can be evaluated in relative terms by comparing it with competitors’ performance. Based on such evaluations, strategic challenges can be determined (see, e.g., Armstrong–Brodie 1994; Slack 1994; Szász et al.
2014). Nevertheless, a ‘soft’ approach is applicable.
Special attention was paid to well-run companies in the 1980s. The economic growth of Japan and Europe (primarily Germany) reorganised international trade and put the US economy in an unpleasant situation (Tenner–DeToro 1995). Researchers realised that a radical change in management methods was inevitable. Garvin (1988) investigated the role of quality as a strategic factor.
Besides the reconsideration of the quality concept (Berényi 2017), cultural factors have become the focus of interest (Kotter–Heskett 1992). The soft elements of the 7S model (Waterman et al. 1980) draw up the pattern of success by using internal (company-level) factors. The book entitled ‘In Search of Excellence’ by Peters and Waterman (1984) collects case studies of the best-run US companies and sets them as an example to the economy. Staff , motivation, open-minded management style and long-term thinking can be highlighted as success factors. The quality-oriented management approach off ers great development opportunities and responds to the Japanese challenge through improved product quality and the recognition of customer needs. This purpose also includes the birth of lean management (Womack et al. 2007), with controlled processes and production costs. It is noted that lean management fi rst and foremost requires a change of leadership attitude (Gelei et al. 2015; Demeter–Losonczi 2019).
Porter (2002) summarises that a well-run company should be able to beat its ineff ective rivals on all dimensions simultaneously. A similar idea drives business excellence models that have opened new ways of interpreting well- run characteristics. The endeavour of the Malcolm Baldrige model (Leonard–
McGuire 2007), followed by the EFQM model (Hakes 2007) has become popular beyond companies. Despite the diff erent application conditions, both models off er
a comprehensive and customisable evaluation framework. Moreover, excellence models off er a framework for management, especially for organisational learning (Fry et al. 2016; Miller–Parast 2018). The evaluation criteria include external issues such as social impact.
According to my approach, the development of CSR (corporate social responsibility) has boosted the fi eld. The varied opportunities for CSR actions can be considered as refl ections of current social expectations. Carroll’s (2016) four- level model marks the economic and legal levels of responsibility as ‘required by the society’. Notwithstanding the economic interests and the need to serve the shareholders that have a determining role in achieving a breakthrough in the fi eld (Laudal 2011), authors agree that social responsibility eff orts pay off (Burke–
Logsdon 1996; Friedman–Friedman 2002; Kotler–Lee 2005). Behringer and Szegedi (2016) point out that the focus of responsibility in achieving sustainable development was shifted from states’ responsibility towards multi-players’
responsibility. However, CSR is usually considered to be a privileged voluntary activity of large corporations; the eff orts and results are broader (Benedek et al.
2015).
The multi-faceted interpretation of a well-run company is mirrored in the survey of the Aspen Institute Business and Society Program (Aspen BSP). In 1999, they ran the questionnaire among MBA students for the fi rst time, then they applied it again in 2007 (ASPEN 2003; ASPEN 2008). A question block explores the attitudes to the question “In your defi nition of a ‘well-run’ company, how important are the following?”. However, the results presented in the reports are not directly comparable due to the diff erent presentation. It can be concluded that, in both surveys, the most important virtues were attracting and retaining exceptional people and providing excellent customer service (ASPEN 2008).
Moreover, a higher level of CSR goals is ranked lower by the respondents. The 2001 and 2002 results are presented in Figure 1.
A limitation of the methodology used by the ASPEN Institute is that it is based on MBA students’ evaluation. There are objective corporate performance indicators that are not included. Nonetheless, the attitudes of future decision- makers provide valuable sources of information for shaping the business strategy.
Moreover, learning about these attitudes strongly supports the development of education and training programmes.
Source: ASPEN 2003 Figure 1. Characteristics of a well-run company based on the ASPEN survey, 2001 and 2002 results (Index -1 to +1 based on ‘very important’,
‘somewhat important’ and ‘not important at all’ responses) Methods and sample
Exploring the character of a well-run company is a constant challenge and this study aims to contribute to that knowledge based on a Hungarian survey.
The research questions are formulated as follows:
• What are the students’ current attitudes to well-run companies?
• Are these attitudes uniform within the sample?
Data collection was performed based on a survey conducted between 2016 and 2018 among students of Hungarian higher education institutions. The survey uses a voluntary questionnaire managed by the Evasys Survey Management System.
Data analysis is supported by IBM SPSS. The research sample comprises master’s- level business students (n=471). However, the fi ndings can contribute to a better understanding of attitudes to well-run companies based on a Hungarian case, with notable limitations. The research sample cannot be considered representative, which prevents us from generalising conclusions for the total population of higher education students, even business students in Hungary. A further limitation is that participation in the online survey was voluntary and the survey was completed without supervision; the results may refl ect the reality in a biased manner.
The empirical study incorporates the questions of the ASPEN Institute’s survey about well-run companies, but it uses a diff erent evaluation method. The
questions are integrated into a comprehensive survey related to attitudes to CSR.
The respondents were asked to mark their opinions on a 5-point scale (from ‘not important’ to ‘very important’). In its turn, the original method used a 3-point scale (‘very important’, ‘somewhat important’ or ‘not important at all’).
The statistical analysis of the results includes:
• Comparing the priority order of statements between the recent survey and the former results of the ASPEN Institute,
• Analysis of variance within the research sample by gender, study characteristics and religiousness (non-parametric test).
Results
Judgment on the characteristics of a well-run company
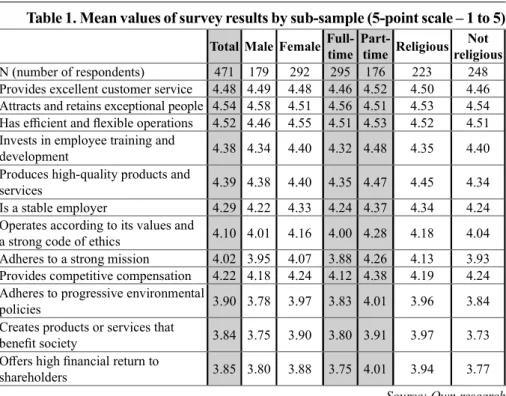
The average results of respondents’ evaluation are summarised in Figure 2 and Table 1. Hungarian master’s-level business students consider attracting and retaining exceptional people, having an effi cient and fl exible operation and providing excellent customer service as the most important characteristics of a well- run company. Progressive environmental policies, socially benefi cial products are at the bottom of the list as well as high fi nancial returns for stakeholders.
Source: Own research Figure 2. Characteristics of a well-run company based on the ASPEN
survey, Hungarian sample, 2018
(5-point scale – 1 to 5, from ‘not important’ to ‘very important’)
Table 1. Mean values of survey results by sub-sample (5-point scale – 1 to 5) Total Male Female Full-
time Part-
time Religious Not religious
N (number of respondents) 471 179 292 295 176 223 248
Provides excellent customer service 4.48 4.49 4.48 4.46 4.52 4.50 4.46 Attracts and retains exceptional people 4.54 4.58 4.51 4.56 4.51 4.53 4.54 Has effi cient and fl exible operations 4.52 4.46 4.55 4.51 4.53 4.52 4.51 Invests in employee training and
development 4.38 4.34 4.40 4.32 4.48 4.35 4.40
Produces high-quality products and
services 4.39 4.38 4.40 4.35 4.47 4.45 4.34
Is a stable employer 4.29 4.22 4.33 4.24 4.37 4.34 4.24
Operates according to its values and
a strong code of ethics 4.10 4.01 4.16 4.00 4.28 4.18 4.04 Adheres to a strong mission 4.02 3.95 4.07 3.88 4.26 4.13 3.93 Provides competitive compensation 4.22 4.18 4.24 4.12 4.38 4.19 4.24 Adheres to progressive environmental
policies 3.90 3.78 3.97 3.83 4.01 3.96 3.84
Creates products or services that
benefi t society 3.84 3.75 3.90 3.80 3.91 3.97 3.73
Off ers high fi nancial return to
shareholders 3.85 3.80 3.88 3.75 4.01 3.94 3.77
Source: Own research Across the total sample, the distribution characteristics of responses are as shown in Table 2.
Table 2. Distribution characteristics, Hungarian sample, 2018
Mean value Median Skewness Kurtosis
Provides excellent customer service 4.48 5 -1.577 2.855
Attracts and retains exceptional people 4.54 5 -1,532 2.568 Has effi cient and fl exible operations 4.52 5 -1.596 2.951 Invests in employee training and development 4.38 5 -1.119 0.812 Produces high-quality products and services 4.39 5 -1.206 0.605
Is a stable employer 4.29 5 -1.134 0.741
Operates according to its values and a strong code of ethics
4.10 4 -0.797 0.077
Adheres to a strong mission 4.02 4 -0.718 -0.033
Provides competitive compensation 4.22 4 -0.958 0.547
Adheres to progressive environmental policies 3.90 4 -0.563 -0.360 Creates products or services that benefi t society 3.84 4 -0.714 -0.206 Off ers high fi nancial return to shareholders 3.85 4 -0.452 -0.224 Source: Own research
Impact of grouping criteria
Since the Kolmogorov-Smirnov H test for normality shows that the distributions of answers do not follow a normal pattern (sign.=.000 for each item), I used the non-parametrical Kruskal-Wallis test to check for diff erences in responses across sub-samples. The results of the variance test are summarised in Table 3, with signifi cant items being marked by ‘*’.
Table 3. Results of variance analysis, Hungarian sample
Gender Full/part-time Religiousness Chi-
Square df Asymp.
Sig.
Chi-
Square df Asymp.
Sig.
Chi-
Square df Asymp.
Sig.
Provides excellent customer
service .050 1 .823 .358 1 .549 .288 1 .591
Attracts and retains
exceptional people 1.162 1 .281 1.194 1 .274 .151 1 .698 Has effi cient and fl exible
operations 1.784 1 .182 .368 1 .544 .038 1 .846
Invests in employee training
and development 1.447 1 .229 3.714 1 .054 .267 1 .605
Produces high-quality
products and services .010 1 .919 2.169 1 .141 1.228 1 .268 Is a stable employer 1.932 1 .165 3.069 1 .080 1.342 1 .247 Operates according to its values
and a strong code of ethics 4.037 1 .045* 10.545 1 .001* 3.853 1 .050*
Adheres to a strong mission 1.391 1 .238 21.145 1 .000* 5.572 1 .018*
Provides competitive
compensation .949 1 .330 10.481 1 .001* .145 1 .704
Adheres to progressive
environmental policies 4.043 1 .044* 3.874 1 .049* 1.689 1 .194 Creates products or services
that benefi t society 2.401 1 .121 .960 1 .327 4.091 1 .043 Off ers high fi nancial return
to shareholders .478 1 .489 9.768 1 .002* 3.680 1 .055
Source: Own research
According to the Hungarian sample, the analysis of variance based on the selected grouping criteria can justify signifi cant diff erences only in a few cases.
The overall picture of gender diff erences based on the mean values (Table 2) is in harmony with CSR-related results underlining that females are more sensitive to environmental and social issues (see, e.g., Lämsa et al. 2008; Schmidt–
Cracau 2015; Deutsch–Berényi 2018). The diff erence between male and female respondents is signifi cant on two issues:
– Operates according to its values and a strong code of ethics (xmale=4.01
xfemale=4.16, Chi-Square=4.037, df =1, Asymp. Sig=.045),
– Adheres to progressive environmental policies (xmale=3.78, xfemale=3.97, Chi-Square=4.043, df =1, Asymp. Sig=.044).
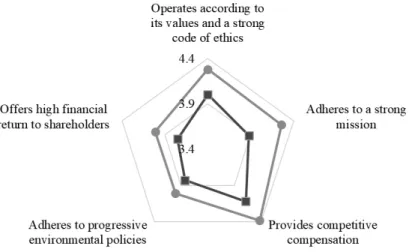
Figure 3 shows that the mean values of the evaluation by part-time students are higher than by full-time students. The biggest diff erence of opinion is found about adhering to a strong mission, and opinions of the groups are the closest to each other about environmental commitment.
Source: Own research Figure 3. Comparison of signifi cant diff erences in mean values
between full-time and part-time students
Religiousness is a popular grouping factor for analysing diff erences in value systems. Religious respondents evaluated two statements signifi cantly higher than non-religious students:
– Operates according to its values and a strong code of ethics (xrel.=4.18,
xnon-rel.=4.04, Chi-Square=3.853, df =1, Asymp. Sig=.050),
– Adheres to a strong mission (xrel.=4.18, xnon-rel.=4.04, Chi-Square=5.572, df=1, Asymp. Sig=.018).
Comparison of ratings to former survey results
Although it is not advisable to compare the mean values to the results of former surveys (ASPEN 2003; ASPEN 2008) due to the unavailability of individual data, the limited presentation of indicator data and the diff erent sample sizes, the priority order can point out a change in preferences (Table 4).
Table 4. Priority order of the characteristics of a well-run company in diff erent survey periods
2001 2002 2008 2018
Provides excellent customer service 2. 2. 2. 3.
Attracts and retains exceptional people 1. 1. 1. 1.
Has effi cient and fl exible operations 3. 4. 5. 2.
Invests in employee training and development 5. 6. 6. 5.
Produces high-quality products and services 4. 5. 3. 4.
Is a stable employer 12. 12. 12. 6.
Operates according to its values and a strong code of ethics 6. 3. 4. 8.
Adheres to a strong mission 9. 9. 8. 9.
Provides competitive compensation 7. 7. 7. 7.
Adheres to progressive environmental policies 11. 10. 11. 10.
Creates products or services that benefi t society 10. 11. 10. 12.
Off ers high fi nancial return to shareholders 8. 8. 9. 11.
Source: Own edition
The change in attitudes can be better visualised by forming four quarters based on rankings. The 1-3, 4-6, 7-9, 10-12 ranking positions are merged. Figure 4 presents the results, where a shorter bar means a better ranking. The classifi cation shows the same quarter of importance in 7 of 12 cases. Being a stable employer and effi cient, fl exible operations have a higher priority in the recent Hungarian sample than in the former ones.
Discussion
The ASPEN Institute (2008) notes that students’ defi nition of a well-run company has remained quite consistent over the years (between 2002 and 2007).
The current survey shows that most factors have been consistent for more than ten years. Nevertheless, a shift of focus is expected in line with social changes.
Source: Own edition Figure 4. Priority order by year, sorted by ranking quarter
Attracting and retaining exceptional people has remained the leading factor.
At the top of the list, customer-oriented factors are mentioned, while both a strong mission and stakeholders’ or social benefi ts are at the bottom of the list. From the lecturer’s perspective, it is noted that neither strategic nor social issues have a dominant role in the attitudes. Both topics have an emphasis in the curricula of business education, their essential role is generally accepted in the literature but not refl ected in the survey results.
A remarkable diff erence is that being a stable employer is appreciated (6th rank) in the Hungarian sample. The question arises whether this result is general or just a Hungarian pattern. In the present sample, there are also 91 international students who answered the questions. Comparing the mean value of their responses (Mean=3.97, n=91, Rank=9.) to the Hungarian sample, it can be concluded that this diff erence in priorities is a local experience. Furthermore, another diff erence is found in the case of the statement about fl exible operations. The results of international students (Mean=4.21, n=91, Rank=5.) are consistent with the results of former surveys, while this statement is evaluated as being more important by Hungarian students (Mean=4.52, n=471, Rank=2.).
There is a notable limitation in the interpretation of the results, given the missing normality of distributions. The distribution characteristics summarised in
Table 2 point to the conclusion that students tend to overestimate the importance of the statements; ranking diff erences may remain hidden on a personal level.
Conclusions
Defi ning a well-run company is a complex challenge. The methodology and the questions developed by the ASPEN Institute can point out personal preferences and focus points in the fi eld, along with diff erences between professional and personal opinions. Although recent trends in management and policies force a wider stakeholder approach and the consideration of environmental and social goals, customer orientation is clearly highlighted in students’ attitudes.
T he main conclusions of the survey can be summarised as follows:
1. Students’ defi nition of a well-run company has been quite consistent over time. Customer and quality-related factors are highlighted in the opinions, while stakeholders’ return and social issues are evaluated as being less important.
2. The top position of attracting and retaining exceptional people suggests the relevance of a ‘soft’ approach to defi ning a well-run company.
3. The Hungarian survey shows local characteristics. Being a stable employer and effi cient, fl exible operations are evaluated higher than in other samples, including former surveys and the attitudes of international students.
This result may refl ect the need for the economic sustainability and stability of companies.
4. The recent Hungarian sample shows signifi cant diff erences by gender or religiousness, but easily separable student profi les were not recognised. Among other things, this experience has an educational impact; a common baseline of learning materials and methods may serve development actions.
Another experience of the survey underlines an important challenge and limitation of the methodology. The opinions of part-time students refl ect better the literature about success factors of companies than those of full-time students.
Assuming that part-time students have more work experience than full-time students, the results suggest that surveying full-time students may lead to a bias in the interpretation of the ‘well-run company’ defi nition. As a lecturer, I can conclude that clearing up misunderstandings about corporate operations is a key issue for educational development.
References
Armstrong, J. S.–Brodie, R. J. 1994. Eff ects of portfolio planning methods on decision making: experimental results. International Journal of Research in Marketing 11(1), 73–84.
ASPEN 2008. Where will they lead?: MBA student attitudes about business &
society. New York, NY: Aspen Institute Center for Business Education.
ASPEN 2003. Where will they lead?: 2003 MBA student attitudes about business &
society. New York, NY: Business and Society Program, Aspen Institute.
Behringer, K.–Szegedi, K. 2016. The role of CSR in achieving sustainable development – Theoretical approach. European Scientifi c Journal 12(22), 10–25.
Benedek, A.–Takács, I.–Takács-György, K. 2015. A magyar vállalatok CSR-központú érintetti kapcsolatának és interakciójának vizsgálata. Közgazdász Fórum 18(1), 3–25.
Berényi, L. 2017. A minőségirányítás fejlődése és jövőbeli lehetőségei.
Vezetéstudomány 48(1), 48–60.
Burke, L.–Logsdon, J. M. 1996. How corporate social responsibility pays off . Long Range Planning 29(4), 495–502.
Carroll, A. B. 2016. Carroll’s pyramid of CSR: taking another look. International Journal of Corporate Social Responsibility 1(3), 8 pp.
Chikán, A. 2003. A kettős értékteremtés és a vállalat alapvető célja. Vezetéstudomány 35(5), 10–12.
Demeter, K.–Losonci, D. 2019. Transferring lean knowledge within multinational networks. Production Planning and Control 30(2-3), 211–224.
Deutsch, N.–Berényi, L. 2018. Personal approach to sustainability of future decision makers: a Hungarian case. Environment Development and Sustainability 20(1), 271–303.
Freeman, R. E. 2013. Stakeholder theory: The state of the art. Cambridge: Cambridge University Press.
Friedman, M.–Friedman, R. D. 2002. Capitalism and Freedom: Fortieth Anniversary Edition. Chicago, IL: University of Chicago Press.
Fry, L. W.–Latham, J. R.–Clinebell, S. K.–Krahnke, K. 2016. Spiritual leadership as a model for performance excellence: A study of Baldrige award recipients. Journal of Management, Spirituality & Religion 14(1), 2–47.
Garvin, D. 1988. Managing quality. New York, NY: The Free Press.
Gelei, A.–Losonci, D. I.–Matyusz, Zs. 2015. Lean production and leadership attributes – the case of Hungarian production managers. Journal of Manufacturing Technology Management 26(4), 477–500.
Hakes, C. 2007. The EFQM excellence model for assessing organizational performance: A management guide. Zaltbommel: Van Haren.
Kotler, P.–Lee, N. 2005. Corporate social responsibility: Doing the most good for your company and your cause. Hoboken, NJ: Wiley.
Kotter, J. P.–Heskett, J. L. 1992. Corporate culture and performance. New York, NY:
The Free Press.
Lämsä, A. M.–Vehkaperä, M.–Puttonen, T.–Pesonen, H. L. 2008. Eff ect of business education on women and men students’ attitudes on corporate responsibility in society.
Journal of Business Ethics 82(1), 45–58.
Laudal, T. 2011. Drivers and barriers of CSR and the size and internationalization of fi rms. Social Responsibility Journal 7(2), 234–256.
Leonard, D.–McGuire, M. 2007. The executive guide to understanding and implementing the Baldrige criteria. Milwaukee, WI: Quality Press.
Miller, J.–Parast, M. M. 2018. Learning by applying: The case of the Malcolm Baldrige National Quality Award. IEEE Transactions on Engineering Management 66(3), 337–353.
Peters, T. J.–Waterman, R. H. 1984. In search of excellence. New York, NY: Warner Books.
Porter, M. 2002. What is strategy? In: Mazzucato, M. (ed.) Strategy for business: A reader. London: SAGE, 10–31.
Schmidt, M. A.–Cracau, D. 2015. Cross-country comparison of the corporate social responsibility orientation in Germany and Qatar: An empirical study among business students. Magdeburg: Otto von Guericke Universität.
Slack, N. 1994. The importance-performance matrix as a determinant of improvement priority. International Journal of Operations & Production Management 14(5), 59–75.
Szász, L.–Demeter, K.–Rácz, B. G. 2014. Termelővállalatok stratégiája és az üzleti teljesítmény kapcsolata dinamikus megközelítésben. Közgazdász Fórum 17(119-120), 57–82.
Tenner, A. R.– DeToro, I. J. 1995. Total quality management: Three steps to continuous improvement. Reading, MA: Addison-Wesley.
Waterman, R. H.–Peters, T. J.–Phillips, J. R. 1980. Structure is not organization.
Business Horizons 22(3), 14–26.
Womack, J. P.–Jones, D. T.–Roos, D. 2007. The machine that changed the world.
New York, NY: The Free Press.