Technology Adoption Propensity Among Hungarian Business Students
Laszlo Berenyi, PhD, Associate Professor Nikolett Deutsch, PhD, Associate Professor
Eva Pinter, PhD, Associate Professor Peter Bago, PhD, Assistant professor Viktor Nagy-Borsy, Assistant Lecturer Corvinus University of Budapest, Hungary
Doi:10.19044/esj.2021.v17n32p1 Submitted: 23 August 2021 Accepted: 23 September 2021 Published: 30 September 2021
Copyright 2021 Author(s)
Under Creative Commons BY-NC-ND 4.0 OPEN ACCESS
Cite As:
Berenyi L., Deutsch N., Pinter E., Bago P. & Nagy-Borsy V. (2021). Technology Adoption Propensity Among Hungarian Business Students. European Scientific Journal, ESJ, 17 (32), 1. https://doi.org/10.19044/esj.2021.v17n32p1
Abstract
The emerging role of technology raises several management challenges. Beyond the ability to develop new tools and solutions, achieving the business goals on new technologies require capable users on the other side.
Understanding the factors of technology acceptance has been appreciated in recent decades. The paper aims to explore the approach to technology by using the adoption propensity (TAP) index among Hungarian business students.
Gender, study level, and work experience were applied as grouping factors. A voluntary online survey was used for data collection. Based on 345 responses, the results are engaging and progressive. Many of the students have an optimistic approach to new technologies, and a significant part of them shows higher than medium-level proficiency. Parallelly, fear from vulnerability is remarkable among the respondents, which suggests cautious behavior. Gender and study level show significant differences within the sample, but no difference is found based on work experience. The results can be used to evaluate technology adoption readiness or generally support action research in developing industrial technologies.
Keywords: Technology adoption, technology acceptance. business students, banking service
1. Introduction
Technology has become a keyword in recent decades. Innovative products are present in an increasing number with expanded features. Many times, man can have the feeling that machines are more intelligent than people.
Smartphones, cloud-based services, online services in health management, banking, insurance, or education are widely available. The range of technology supply is broad, but the demand is another issue. Beyond the financial implication of installing a new technology, knowledge level, habits, local availability must be taken into consideration. Technology acceptance or the readiness for using new technology has serious economic implications. As the ever-evolving technology around us raises the question of whether people are ready to use them, understanding the propensity to technology adoption is a relevant challenge. To support the definition, design, and implementation of targeted research activities related to new product developments exploiting technological advances for young generations, the goal of this exploratory research is to investigate the approach to new technology adoption of Hungarian business students.
The remainder of the paper is structured as follows. In the next section, the theoretical underpinnings of the research are summarized. The second section refers to research methods and explains the methodological procedures. The third section presents the key findings of the research. The main conclusions of the paper are described in the fourth section. In the final section, limitations and suggestions for further research are outlined.
2. Literature review
Accepting a product, service, or technology is a fundamental problem both individually and socially. The diffusion of the solutions and business returns are inconceivable without user acceptance. Understanding the influencing factors of the readiness to use new technology is essential information for the business. The problem is not new; Isaias and Issa (2015) noted that the 1970s were characterized by rising demand for technology, leading to a growing number of problems, especially in selecting an information technology system. Similar challenges arose in the fields of environmentally conscious behavior, or the methods can be extended to education or banking issues, primarily because technology in these fields largely dependents on information technology in the recent decades.
There are two groups of instruments for supporting the understanding of technology acceptance. Some focus on personal behavior; others try to connect man and technic in the mirror of a given task or purpose. Isaias and Issa (2015) summarize theories and instruments on the influencing factors of acceptance as quality evaluation models.
Personal models, like the theory of reasoned actions (Fishbein, 1967) or the theory of planned behavior (Ajzen, 1991; 2012) define behavioral intention. The intention is influenced by attitudes, norms, and perception; and it can lead to actual behavior.
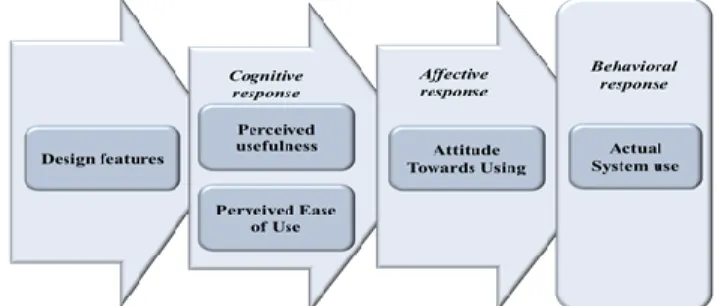
Technology acceptance models (TAM, TAM2, TAM3) focus on the chain of cognitive, affective, and behavioral responses to technology, influenced by design, social and other factors. TAM (Figure 1) is defined by and Davis (1986) and further developed by Venkatesh and Davis (2000) to TAM2 and Venkatesh and Bala (2008) to TAM3. The extended models consider influencing factors increasingly; however, it also comes with a more complicated measurement structure. Moreover, the unified theory of the acceptance and use of technology (UTAUT) model (Venkatesh et al., 2013) offers a comprehensive framework using the features of behavioral models as well.
Figure 1. Technology acceptance model (based on Isaias and Issa, 2015)
As technological solutions have become more common as ways to solve business and social problems, the comparison of technology acceptance theories and frameworks is a widely investigated area of research (Taherdoost 2018; Koul & Eydgahi, 2017; Collan & Tétard, 2011; Dulle et al., 2010;
Venkatesh et al., 2003; King & He, 2006). Key assumptions, advantages, and disadvantages of these fundamental means of studying the factors influencing consumers’ adoption intentions of various technologies and their ability to predict individual behavior towards acceptance and usage of technology are also highlighted in studies considering different contextual settings (Table 1).
Table 1. Sample literature sources on technology acceptance theories and models in different industries
Author(s) Model s
Field of study Geographical focus
Statistical model
Key message Murugan et al.
(2000)
TAM Banking Industry Nigeria (banking customers. n=88)
Partial least squares (PLS) analysis
Model variables explained 29 % of the variance on usage Pikkarainen et
al. (2004)
TAM Online banking Finland (private banking
customers, n=268)
Factor analysis, ANOVA test, Regression
analysis
PU and the amount of information on online banking are the most influential factors explaining the use of online banking services Chille et al.
(2021)
TAM Telecom &
Mobile marketing
Tanzania customers of three
telecommunicatio n companies:
employees (n=128); business
persons (n=89), students (n=93),
customers working in the informal sectors
(n=96)
Correlation and linear regression analysis
perceived usefulness positively influences the adoption of mobile marketing
Gong et al.
(2004)
TAM combin ed with social cognitiv e theory
Web-Based Learning, Education
Hong Kong (University students, n=152)
Partial Least Squares
(PLS) analysis
Computer self-efficacy has both a strong direct and indirect effect on the intention to use, and it can enhance users’
perceived ease of use significantly
Abbad (2021) UTAUT E-learning systems (Education)
Jordan (University students, n=380)
Structural equation modeling (SEM) techniques
Behavioral intentions had the most direct and significant effect on students’ usage of Moodle
Chen & Chen (2009)
TAM, TPB, Combin ed TAM- TPB
Automotive telematics (Automotive industry)
Taiwan (users, n=345)
Regression analysis
The effect of Perceived Ease of Use, Attitude,
and Perceived
Behavioural Control were very important, but that usefulness and Subjective Norm did not influence an individual’s
Behavioural Intention.
Chen et al.
(2020)
UTAUT and extende d UTAUT
Driverless Buses, Public transport
Chongqing (n=
913)
Structural equation modeling (SEM) techniques
PI and PR are the most critical factors affecting public acceptance intention; the model’s explanatory power is 48%.
Jeon et al.
(2020)
UTAUT and extende d UTAUT
Self-service technology, restaurant industry
South Korea (customers.
n=295)
Structural equation modeling (SEM) techniques
The intention to use a self-order and self- payment kiosk is influenced by the usefulness of the kiosk, perceived ease of use, and acquaintances of users
Wei et al.
(2021)
Extende d UTAUT Model
Mobile payment Taiwan (customers, n=
295)
Partial least square structural
equation modeling
Social influence has a positive effect on the young generations’
behavioral intention to adopt mobile payment.
Behavioral intention and promotional activities are the drivers
of the young
generation’s actual usage of mobile payment
Arfi et al.
(2020)
UTAUT eHealth, Healthcare
France, IoT users (n=181)
Partial least square structural
equation modeling
The cost of using IoT in eHealthcare is the key barrier to adoption. Age is a significant mediator of customers’ intention to use IoT, it inspires the formulation of two new categories: IoT natives and IoT immigrants.
While TAM has become one of the most frequently used models especially related to information technology, several studies have been conducted to identify and add those social, cognitive, and political processes and moderators which have a considerable impact on user acceptance and usage behavior on technology (Keszey & Zsukk, 2017). Experience is a common moderator in the most popular technology acceptance theories and models (TRA, TPB, TAM, TAM2, and UTAUT). Many studies have shown that user experience with technology improves the perceptions and attitudes towards the use as satisfaction and trust emerging from the consumers’
experience with a technology (Agarwal & Prasad, 1999; Hornbaek &
Hertzum, 2017; Mlekus et al., 2020). It is to note that besides users’
experience, job relevance is an investigated moderator for the potential relationship between previous job positions and users’ experience with technology (Radeskog et al., 2009; Sun et al., 2020). However, the integration of voluntariness, age, and gender as moderator variables into the theoretical constructs seems to improve their explanatory power. Since the emergence of the early model of technology diffusion defined by Rogers (1995), the age of users has been treated as one of the most important determinants of the
decision on adoption timing (Chen &Chan, 2011). Similarly, the degree of voluntariness, i.e., the mandatory vs. optional usage of innovation, and the type of voluntariness, i.e., environmental-based oruser-based voluntariness, are recognized as moderating variables of the perceived attributes of technology on the diffusion of a given technology (Wu & Lederer, 2009;
Žvanut et al., 2011). The influence of gender on new technology adoption has received considerable attention in the existing literature using TAM and UTAUT models. While there is a general statement that women are less likely to adopt and use new technologies; and being less confident in their ability to use these technologies compared to men (Li et al., 2008), from an extensive literature review made by Goswami and Dutta (2016) it is found that the role of gender in determining the intention of accepting new technologies highly depends on the context, field and type of technology being investigated.
Regarding the use of online and mobile banking technologies by gender, mixed results can be found (Goswami & Dutta, 2016), stressing the importance of future research on the existence and latent variables of gender gaps. Empirical studies also show a significant positive relationship between education level and perceived ease of use of technologies (Agarwal & Prasad, 1999). Samaradiwakara and Gunawardena (2014) argue that due to the richness of situational variables and the highest variance value, the UTAUT model provides a better understanding of the drivers of the behavior of acceptance and the use of new technologies than other similar theories and models. However, it is to note that a common shortcoming of these models is that their investigation is limited to a given technology. The results can be helpful for a company in developing its procedures, but broader conclusions are limited.
The Technology Readiness Index (TRI) and its updated version (TRI 2.0) developed by Parasuraman and Colby (2014) allow more common investigations than before. Similarly, the Technology Adoption Propensity (TAP) index by Ratchford and Barnhart (2012) aims to support a generic understanding of technology acceptance. These instruments use a survey to explore the motivator and inhibitor factors of acceptance. TAP defines four factors, the essence of these can be summarized based on Ratchford and Barnhart (2012):
• Optimism. The belief that technology provides a better life. It incorporates the perceived usefulness factor of TAM models. The index also refers to how technology enhances the respondent’s life rather than how it enhances the lives of generalized others.
• Proficiency. The competencies to learn to use new technologies.
Considering that performance depends on ability and intentions, proficiency can predict relevant information both to the technology developers and to the education system to find a focus.
• Dependence. The sense of being overly dependent on technology.
Spending too much time with technology, especially info- communication tools, may have a harmful impact on personal life and contacts.
• Vulnerability. The belief that the use of technology can lead to harmful impacts so increases distrust in it. Several forms of malicious activities are known; protection against these needs some skepticism.
The attitudes toward technology were measured using the technology adoption propensity (TAP) scale in relation to hotel technology-based innovations (Cheng & Guo, 2021), retailing (Grewal et al., 2021), smart home developments (Williams et al., 2020), or online banking (Hapuarachchi &
Samarakoon, 2020). Regarding the most influential factors affecting technology readiness, Ratchford and Barnhart (2012) postulate that age, gender, level of education, ethnicity, country of birth, country of residence, and English language proficiency should be treated as potential categorial variables in TAP-based analyses; and in order to design and take targeted measures, it is worth investigating how these issues influence the attitudes towards technology acceptance.
The goal of this exploratory study is to identify the business students’
approach to technology adoption in Hungary and to prepare targeted research activities supporting the investigations on the development of financial services for young generations. By considering the advantages and disadvantages of the different theoretical models and the main purpose of the research, the TAP methodology is used in a survey among Hungarian business students. Based on the literature review, there are three hypotheses formulated for the study:
• Hypothesis 1: The technology adoption propensity of business students differs by gender.
• Hypothesis 2: The technology adoption propensity of business students differs by the level of study.
• Hypothesis 3: The technology adoption propensity of business students differs by the level of work experience.
3. Research design 3.1. Survey design
A voluntary online survey was used for data collection. The core instrument of the survey is the technology adoption propensity (TAP) index questionnaire developed by Ratchford and Barnhart (2012). Based on the instrument, optimism, proficiency, dependence, and vulnerability factor values are calculated. Students were asked to mark their agreement level with the statements on a 7-point Likert scale.
The questionnaire includes multiple-choice questions with a list of some industries about their opinion about the development and future technology focus. The questions investigate which industries are kept the most technology-oriented. The students were asked to select a maximum of 4 items of 15 in the listing. Another question was formulated about how the students follow the novelties in some areas with a 5-point scale evaluation.
The survey was designed and performed with the LimeSurvey online survey management system. The data collection period was between September 2020 and May 2021. Data analysis was supported by IBM SPSS (see Barna & Székelyi, 2002; Sajtos & Mitev, 2007). Statistical analysis includes the analysis of variance based on the guidance of (Pallant, 2020).
Analysis of variance is a commonly used statistical technique that supports the investigation and tests for the differences between sample groups by comparing their means (King, 2010). The significance level of statistical analysis is set to 5%.
3.2. Sample characteristics
The research sample 345 responses from business students of various Hungarian higher education institutions. 60.6% of the respondents are females, 39,4% are males. Based on the level of studies, 72.5% of the students continue bachelor studies and 27.5% master studies. 30.1% of the sample does not have any work experience. Among students with work experience, 34.0%
(82 students) participated in at most an internship program, and 66.0% (159 students) has work experience as an employee.
According to the TAP questions, a reliability test was performed.
Cronbach alpha value is 0.734 for the 14 statements that which confirms the consistency of the scale.
4. Results and discussion
4.1. Opinions on industrial performance
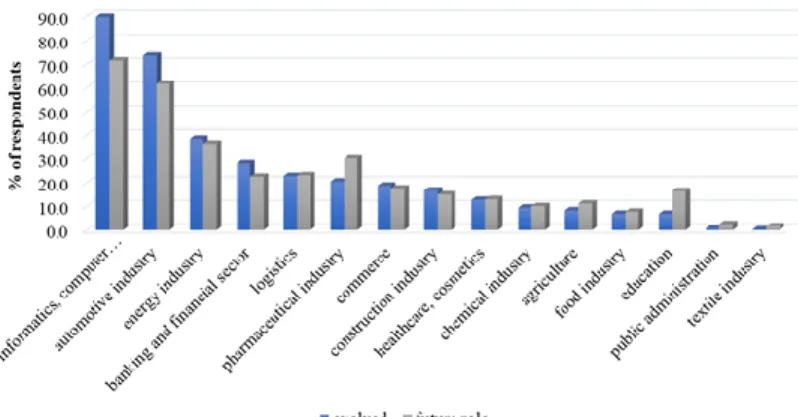
According to the evolvement and the future role of technology, the students think informatics, computer technology, and telecommunications, followed by the automotive industry the most relevant (Figure 2).
Figure 2. Evaluation of the past evolution and future role of technology in some industries
89.9% of the students marked informatics, computer technology, and telecommunications as one of the four areas in that technology has evolved the most in recent decades. 71.6% believe that technology will be the most important source of competitive advantage in the near future in this area. The automotive industry is ranked second in both aspects (73,6% and 61,7%
marked it). Other areas are significantly lagging behind. The banking and financial sector is marked by less than a third of respondents; it is ranked to the 4th position. According to the future role of technology in the industries, the markings are more divided. Nevertheless, in the case of some items, the future role is rated remarkably higher than the evolution. These are the pharmaceutical industry and education. It was not examined in the survey, but the impacts of the Covid-19 pandemic may be significant in both cases.
Considering the banking, the questionnaire included an additional question: ‘How interested are you, how much do you follow the novelties in banking services?’ The students were asked to rate the question on a 5-point scale between ‘not at all’ (1) and ‘being up to date’ (5). The distribution of the responses is shown in Figure 3. 31.9% of the respondents are not really interested in the novel banking services, but a similar proportion (31.6%) yes.
Figure 3. Distribution of the responses about following the novelties in banking services
4.2. Technology adoption propensity by gender
Males are slightly more optimistic about new technologies than females and based on their self-declaration, they are more competent technologically. There is a remarkable difference in the case of proficiency (Figure 4). However, dependence and vulnerability show higher mean values among female respondents.
Figure 4. Mean values of TAP factors by gender
The statistical analysis confirmed the significant differences by gender in the factors of optimism proficiency and vulnerability (Table 2).
Table 2. Variance analysis by gender (SPSS output)
Factor Sum of
Squares
df Mean Square
F Sig.
Optimism Between 1.561 1 1.561 2.083 0.15 Within Groups 256.997 343 0.749
Total 258.558 344
Proficiency Between 78.386 1 78.386 69.827 0 Within Groups 385.041 343 1.123
Total 463.428 344
Dependence Between 2.173 1 2.173 1.456 0.228 Within Groups 511.819 343 1.492
Total 513.992 344
Vulnerability Between 5.63 1 5.63 4.741 0.03 Within Groups 407.302 343 1.187
Total 412.932 344
The results support Hypothesis 1 about gender differences in technology adoption propensity except for the dependence factor. The results suggest that the male respondents think more homely and confidently on
technologies than females. The reverse experience in vulnerability raises the higher awareness and prudence among females.
4.3. Technology adoption propensity by study level
Figure 5 compares the bachelor and master level students’ propensity to technology adoption. In the case of master students, a higher level of knowledge and experience can be expected that can lead to a greater trust in new technologies. The results confirm this assumption; the mean values of master students’ evaluation are higher in optimism and proficiency than bachelors. Although, the vulnerability of bachelor students exceeds the results of master students.
Figure 5. Mean values of TAP factors by study level
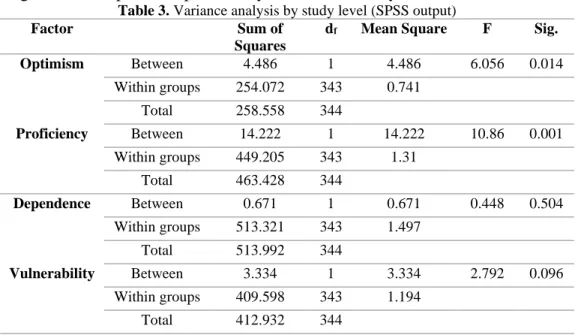
Based on the variance analysis (Table 3), the differences by study level are significant in optimism, proficiency, and vulnerability.
Table 3. Variance analysis by study level (SPSS output)
Factor Sum of
Squares
df Mean Square F Sig.
Optimism Between 4.486 1 4.486 6.056 0.014
Within groups 254.072 343 0.741
Total 258.558 344
Proficiency Between 14.222 1 14.222 10.86 0.001 Within groups 449.205 343 1.31
Total 463.428 344
Dependence Between 0.671 1 0.671 0.448 0.504 Within groups 513.321 343 1.497
Total 513.992 344
Vulnerability Between 3.334 1 3.334 2.792 0.096 Within groups 409.598 343 1.194
Total 412.932 344
Master-level programs offer targeted knowledge in a specified field that includes the deeper education of both theories and procedures of the profession. This may allow better confidence in using the related technologies.
The decrease of awareness is a warning sign, are needed to be better addressed by education and training. The results support Hypothesis 2 about the study level differences in technology adoption propensity except for the dependence factor.
4.4. Technology adoption propensity by work experience
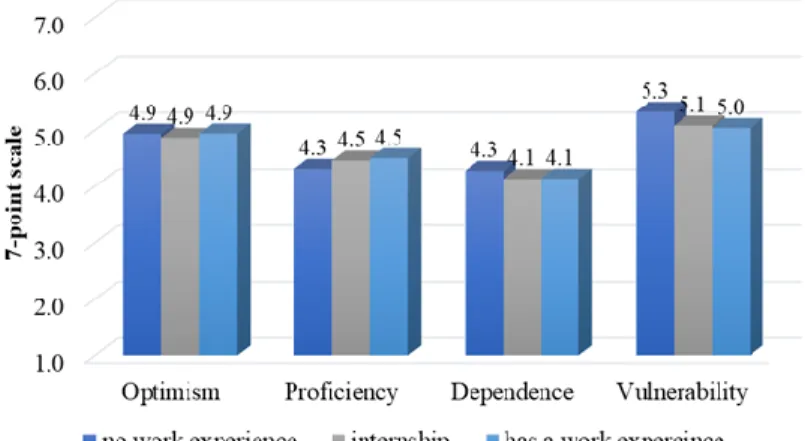
Work experience brings the necessity for using technologies, including manufacturing or service procedure, business administration, and communication. The assumption of the research is that more work experience leads to higher optimism and proficiency in technology adoption. Figure 6 shows the mean values of the factors between students without work experience, with internship experience, and employed. There are no remarkable differences in the sample. Proficiency grows in parallel with work experience, and vulnerability decreases.
Figure 6. Mean values by work experience
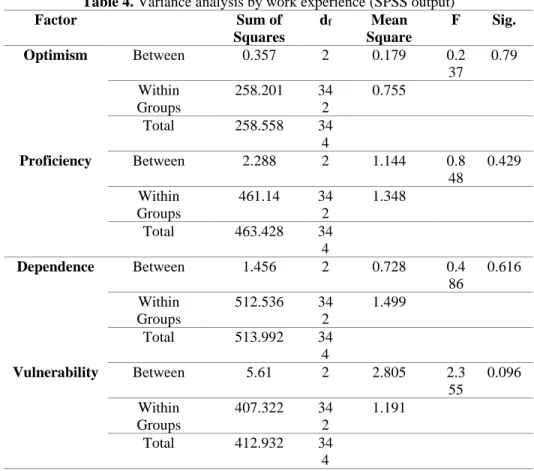
Statistical analysis (Table 4) did not find significant differences between the sub-samples. Hypothesis 3 is rejected about the differences in technology adoption propensity of business students differs by the level of work experience.
Table 4. Variance analysis by work experience (SPSS output)
Factor Sum of
Squares
df Mean Square
F Sig.
Optimism Between 0.357 2 0.179 0.2
37
0.79 Within
Groups
258.201 34 2
0.755
Total 258.558 34
4
Proficiency Between 2.288 2 1.144 0.8 48
0.429 Within
Groups
461.14 34 2
1.348
Total 463.428 34
4
Dependence Between 1.456 2 0.728 0.4 86
0.616 Within
Groups
512.536 34 2
1.499
Total 513.992 34
4
Vulnerability Between 5.61 2 2.805 2.3 55
0.096 Within
Groups
407.322 34 2
1.191
Total 412.932 34
4
4.5. Technology adoption propensity by the interest level in banking service novelties
The question about the interest in following the novelties in banking services allows three groups of students used as grouping factors of the analysis:
• not interested: 1 and 2 scores on the 5-point scale
• moderately interested: 3 scores on the 5-point scale
• interested: 4 or 5 scores on the 5-point scale.
The optimism and proficiency factors show a parallel with the scores of the factors. Dependence and vulnerability scores are lower among moderately interested students (Figure 7). The survey did not cover the analysis of the causal relationship; this will need to be examined with a modified questionnaire based on the results. The statement of the survey is limited to the interaction of the factors.
Figure 7. Mean values by interest in novel banking services
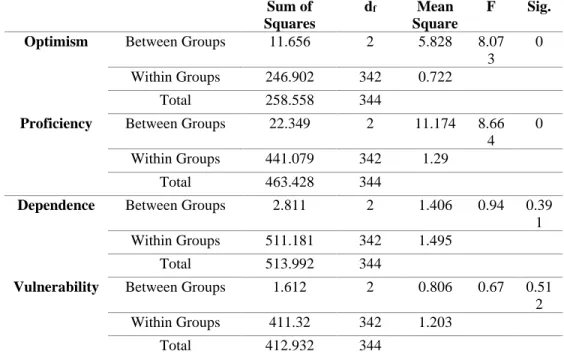
The analysis of variance confirmed significant differences in optimism and proficiency factors in the sample (Table 5).
Table 5. Variance analysis by interest in novel banking services (SPSS output) Sum of
Squares
df Mean Square
F Sig.
Optimism Between Groups 11.656 2 5.828 8.07 3
0 Within Groups 246.902 342 0.722
Total 258.558 344
Proficiency Between Groups 22.349 2 11.174 8.66 4
0 Within Groups 441.079 342 1.29
Total 463.428 344
Dependence Between Groups 2.811 2 1.406 0.94 0.39 1 Within Groups 511.181 342 1.495
Total 513.992 344
Vulnerability Between Groups 1.612 2 0.806 0.67 0.51 2
Within Groups 411.32 342 1.203
Total 412.932 344
4.6. Distribution of the TAP index values
Since the mean values of the responses are located around the medium value of the measurement scale, it is worth examining the distribution of the individual scores. The skewness and kurtosis indicators of the distribution suggest it (Table 6).
Table 6. Descriptive statistics of TAP factors (SPSS output)
N Mean Std. Dev. Skewness Kurtosis Statistic Std. Error Statistic Std. Error Optimism 345 4.92 0.86696 -0.066 0.131 -0.38 0.262 Proficiency 345 4.43 1.16068 0.012 0.131 -0.361 0.262 Dependence 345 4.18 1.22236 -0.047 0.131 -0.549 0.262 Vulnerability 345 5.13 1.09562 -0.572 0.131 0.347 0.262
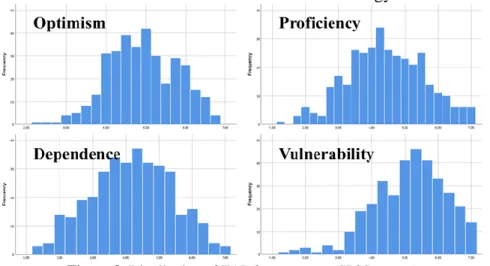
Figure 8 shows the histograms of the distributions generated by the SPSS software. The paper presents the results on the total sample. The majority of the respondents are to find above the middle point of the scale in the cases of optimism and vulnerability; low scores are rare. The distribution of dependence is the most similar to normal. According to proficiency, the number of more proficient scores exceeds the lower ones, but scores under 2.5 on the 7-point scale are not typical.
The high proportion of optimistic students is encouraging; it supports their openness to new technologies. The distribution of vulnerability suggests further investigations since the high proportion of vulnerable students can arise either from conscious awareness or fear of technology.
Figure 8. Distribution of TAP factor scores (SPSS output)
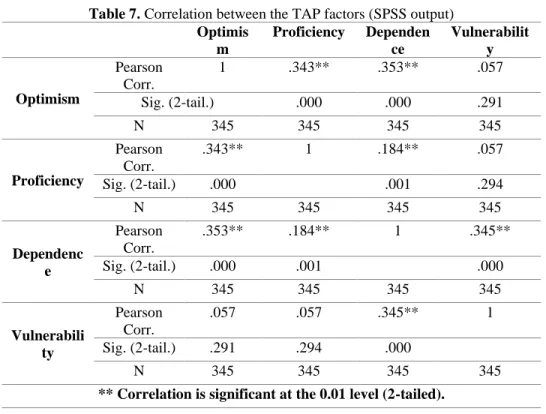
The correlation analysis of the TAP factor scores (Table 7) found significant positive results, but the strength of the correlation is moderate. A higher level of optimism goes together with proficiency and dependence but not with vulnerability. Proficiency is weakly correlated with dependence.
Vulnerability correlates significantly only with dependence.
Table 7. Correlation between the TAP factors (SPSS output) Optimis
m
Proficiency Dependen ce
Vulnerabilit y
Optimism
Pearson Corr.
1 .343** .353** .057
Sig. (2-tail.) .000 .000 .291
N 345 345 345 345
Proficiency
Pearson Corr.
.343** 1 .184** .057
Sig. (2-tail.) .000 .001 .294
N 345 345 345 345
Dependenc e
Pearson Corr.
.353** .184** 1 .345**
Sig. (2-tail.) .000 .001 .000
N 345 345 345 345
Vulnerabili ty
Pearson Corr.
.057 .057 .345** 1
Sig. (2-tail.) .291 .294 .000
N 345 345 345 345
** Correlation is significant at the 0.01 level (2-tailed).
Conclusion
The engine of technological development is focused primarily on informatics, computer technology, and telecommunications, followed by the automotive industry. These two industries clearly stand out in students’
opinions based on their performance to date and their expected role in the future. The technology adoption propensity of Hungarian business students is engaging and progressive. The results by study level show higher optimism and proficiency among master than bachelor students. However, it is thought- provoking that concern about technology will be used for nefarious purposes shows lower value in the same relation. Vulnerability represents the highest scores in each sub-sample, which may be a basis for increased awareness.
Addiction to technology (dependence) is moderately characteristic in the sample. Education is expected to have an increasing dependence on technology in the future, so especially higher education institutions can have a strengthened role in coordinating technological knowledge.
The results on gender differences suggest that male students are more proactive in using new technologies, but they are significantly more careless than females. The assumption has not been substantiated that work experience correlates with technology adoption. According to the goal and the limitations, the main conclusion of the study is that the Technology Adoption Propensity (TAP) instrument is a reliable and versatile tool for understanding the
motivator and inhibitor factors of accepting novel technologies. The results also confirm that the method can contribute to exploring the approach to novel banking services. The distribution of TAP factor scores of the respondents raises the necessity of further investigations. Optimism and vulnerability scores are typically high, but both proficiency and dependence show a scattered picture. Improving proficiency is essential for the confident use of technologies.
Limitations and future research
Although we have proceeded with caution in research design and data collection, some limitations of the research must be considered. The survey is a pilot study meaning that the findings can be utilized as baseline data for further investigations. Despite the fact that the large sample size allows statistical analysis, and the reliability of the core questions is assured, the sample cannot represent the opinions of all business students. The representativeness of the sample is not assured; the response was voluntary and anonymized. The survey was self-managed. Distortion arising from social expectations or misunderstanding the question can be expected at the respondents’ level, but the sample size (n=345) can reduce the effect.
As the ultimate goal of our research is to contribute to the development of financial culture, the future research orientation is double. On the one hand, to get a comprehensive overview of the technology adoption propensity, expanding the research sample beyond business students is necessary since financial and banking issues are not limited to them. In this regard, the next task is building a representative sample for TAP index analysis and prepare the survey for continuous data collection, allowing time series of studies. On the other hand, individual banking products and services are planned to test by using the TAM models. TAP factors are planned to be involved as explanatory factors of behavioral intentions. The results are expected to be directly utilized in the development of modern banking services.
Acknowledgment
The study was conducted as part of the GINOP-2.2.1-18-2018-0010 project entitled ‘Automated, life situation based, real-time decision support framework’.
References:
1. Abbad, M. M. M. (2021). Using the UTAUT model to understand students’ usage of e-learning systems in developing countries.
Education and Information Technologies, Online, 1-20. DOI:
10.1007/s10639-021-10573-5
2. Agarwal, R., & Prasad, J. (1999). Are Individual Differences Germane to the Acceptance of New Information Technologies? Decision Sciences, 30(2), 361-391. DOI: 10.1111/j.1540-5915.1999.tb01614.x 3. Ajzen, I. (1991). The theory of planned behavior. Organizational
Behavior and Human Decision Processes, 50(2), 179-211. DOI:
10.1016/0749-5978(91)90020-T
4. Ajzen, I. (2012). Martin Fishbein’s legacy: The reasoned action approach. The Annals of the American Academy of Political and Social Science, 640(1), 11-27. DOI: 10.1177/0002716211423363
5. Arfi, W. B., Nasr, I. B., Khvatova, T., & Zaied, Y. B. (2021).
Understanding acceptance of eHealthcare by IoT natives and IoT immigrants: An integrated model of UTAUT, perceived risk, and financial cost. Technological Forecasting and Social Change, 163, 120437. DOI: 10.1016/j.techfore.2020.120437
6. Chan, A.H.S., & Chen, K. (2011). A review of technology acceptance by older adults. Gerontechnology, 10(1), 1-12. DOI:
10.4017/gt.2011.10.01.006.00
7. Chen, H.-H., & Chen, S.-C. (2009). The empirical study of automotive telematics acceptance in Taiwan: Comparing three technology acceptance models. International Journal of Mobile Communications, 7(1), 50-65. DOI: 10.1504/IJMC.2009.021672
8. Chen, J., Li, R., Gan, M., Fu, Z., & Yuan, F. (2020). Public acceptance of driverless buses in China: an empirical analysis based on an extended UTAUT model. Discrete Dynamics in Nature and Society, Article ID: 4318182, p. 13, DOI: 10.1155/2020/4318182
9. Cheng, V. T. P., & Guo, R. (2021). The impact of consumers’ attitudes towards technology on the acceptance of hotel technology-based innovation. Journal of Hospitality and Tourism Technology. In Press, DOI: 10.1108/JHTT-06-2020-0145
10. Chille, F. J., Shayo, F. A., & Kara, N. S. (2021). Adoption of Mobile Marketing in the Telecommunication Industry of Tanzania: The Effects of Perceived Usefulness, Ease of Use, and Customer’s Knowledge. European Scientific Journal, 17(12), 160. DOI:
10.19044/esj.2021.v17n12p160
11. Collan, M., & Tétard, F., (2011). Lazy User Model: solution selection and discussion about switching costs. In: Scandinavian conference on information systems. Springer, Berlin, Heidelberg, 2011. p. 56-68.
12. Davis, F. D. (1986). A technology acceptance model for empirically testing new end-user information systems: Theory and results.
Cambridge, US: Massachusetts Institute of Technology
13. Dulle, F. W., Minishi-Majanja, M. K., & Cloete, L. M. (2010). Factors influencing the adoption of open access scholarly communication in
Tanzanian public universities. World Library and Information Congress: 76th IFLA General Conference and Assembly 10-15 August 2010, Gothenburg, Sweden.
14. Fishbein, M. (1967). Attitude and the prediction of behavior. In:
Fishbein, M. (ed.): Readings in attitude theory and measurement. New York, US: Wiley. pp. 477-492.
15. Gong, M., Xu, Y., & Yu, Y. (2004). An enhanced technology acceptance model for web-based learning. Journal of Information Systems Education, 15(4), 365-374.
16. Grewal, D., Gauri, D. K., Das, G., Agarwal, J., & Spence, M. T.
(2021). Retailing and emergent technologies, Journal of Business Research, 134, 198-202. DOI: 10.1016/j.jbusres.2021.05.004.
17. Goswami, A., & Dutta, S. (2016). Gender Differences in Technology Usage—A Literature Review. Open Journal of Business and Management, 4, 51-59. DOI: 10.4236/ojbm.2016.41006
18. Hapuarachchi, C., & Samarakoon, A. (2020). Drivers Affecting Online Banking Usage of Private Commercial Banks in Sri Lanka. Asian Journal of Economics, Business and Accounting, 20(1), 1-10.
19. Hornbaek, K., & Hertzum, M. (2017). Technology Acceptance and User Experience: A Review of the Experiential Component in HCI.
ACM Transactions on Computer-Human Interaction, 24(5), 1–30, DOI: 10.1145/3127358
20. Isaias, P. & Issa, T. (2015). High Level Models and Methodologies for Information Systems. New York¸ NY: Springer
21. Jeon, H. M., Sung, H. J., & Kim, H. Y. (2020). Customers’ acceptance intention of self-service technology of restaurant industry: expanding UTAUT with perceived risk and innovativeness. Service Business, 14(4), 533-551. DOI: 10.1007/s11628-020-00425-6
22. Keszey, T., & Zsukk, J. (2017). Az új technológiák fogyasztói elfogadása. A magyar és nemzetközi szakirodalom áttekintése és kritikai értékelése. Vezetéstudomány, 48 (10), 38-47. DOI:
10.14267/VEZTUD.2017.10.05
23. King, B. M. (2010) Analysis of Variance. In: Peterson, P. L., Baker, E., & McGaw, B. (2010). International encyclopedia of education.
London: Elsevier, 32-36.
24. King, W., R., & He, J. (2006). A meta-analysis of the technology acceptance model. Information & Management, 43(6), 740-755, DOI:
10.1016/j.im.2006.05.003
25. Koul, S., & Eydgahi, A. (2017). A systematic review of technology adoption frameworks and their applications. Journal of technology management & innovation, 12(4), 106-113.
26. Li, S., Glass, R., & Records, H. (2008). The Influence of Gender on New Technology Adoption and Use–Mobile Commerce. Journal of Internet Commerce, 7(2), DOI: 10.1080/15332860802067748
27. Mlekus, L., Bentler, D., Paruzel, A., Kato-Beiderwieden, A.-L., &
Maier, G. W. (2020). How to raise technology acceptance: User experience characteristics as technology-inherent determinants.
Gruppe. Interaktion. Organisation. Zeitschrift für Angewandte Organisationspsychologie, 51(3), 273–283.
28. Murugan, A., Magid, I., & Uzoamaka, P. A. (2000). Technology acceptance in the banking industry. A perspective from a less developed country. Information Technology & People, 13(4), 298-312.
29. Pallant, J. (2020). SPSS Survival Manual: A Step by Step Guide to Data Analysis Using IBM SPSS, 7th ed. London, UK: Open University Press 30. Parasuraman, A., & Colby, C. L. (2014). An Updated and Streamlined Technology Readiness Index: TRI 2.0. Journal of Service Research, 18(1), 1-16. DOI: 10.1177/1094670514539730
31. Pikkarainen, T., Pikkarainen, K., Karjaluoto, H. & Pahnila, S. (2004).
Consumer acceptance of online banking: An extension of the technology acceptance model. Internet Research, 14(3), 224-235.
DOI: 10.1108/10662240410542652
32. Ratchford, M., & Barnhart, M. (2012). Development and validation of the technology adoption propensity (TAP) index. Journal of Business Research, 65, 1209-1215. DOI: 10.1016/j.jbusres.2011.07.001
33. Radeskog, J., Strömstedt, P., & Söderström, O. (2009). User- Technology-Acceptance among doctors: a case study examining the effects of pre-implementation efforts made during a system- implementation. Jönköping. Country Council, 2-30.
34. Rogers, E. M. (1995). Diffusion of innovation. New York: Free Press 35. Sajtos, L., & Mitev, A. (2007). SPSS kutatási és adatelemzési
kézikönyv. Budapest: Alinea Kiadó
36. Samaradiwakara, G.D.M.N., & Gunawardena, C.G. (2014).
Comparison of existing technology acceptance theories and models to suggest a well improved theory/model. International Technical Sciences Journal, 1(1), 21-36.
37. Sun, S., Lee, P.C., Law, R., & Hyun, S.S. (2020). An investigation of the moderating effects of current job position level and hotel work experience between technology readiness and technology acceptance.
International Journal of Hospitality Management, 90, 102633, DOI:
10.1016/j.ijhm.2020.102633.
38. Székely, M., & Barna, I. (2013). Túlélőkészlet az SPSS-hez. Budapest:
Typotex Kiadó
39. Taherdoost, H. (2018). A review of technology acceptance and adoption models and theories. Procedia manufacturing, 22, 960-967.
40. Venkatesh, V., & Bala, H. (2008). Technology acceptance model 3 and a research agenda on interventions, Decision Sciences, 39(2), 273-315.
DOI: 10.1111/j.1540-5915.2008.00192.x
41. Venkatesh, V., & Davis, F. D. (2000). A theoretical extension of the technology acceptance model: four longitudinal field studies,
Management Science, 46(2), 186-204. DOI:
10.1287/mnsc.46.2.186.11926
42. Venkatesh, V., Morris, M. G., Davis, G. B., & Davis, F. D. (2003).
User acceptance of information technology: Toward a unified view.
MIS Quarterly, 27, 425–478, DOI: 10.2307/30036540
43. Wei, M. F., Luh, Y. H., Huang, Y. H., & Chang, Y. C. (2021). Young generation’s mobile payment adoption behavior: Analysis based on an extended UTAUT model. Journal of Theoretical and Applied Electronic Commerce Research, 16(4), 618-637. DOI:
10.3390/jtaer16040037
44. Williams, E., Slade, E., Hodges, D., & Morgan, P. (2020). Individual Differences in the Adoption and Secure Use of Smart Home Technology. British Academy of Management Conference: BAM2020 Conference in the Cloud, Online, 2-4 September 2020. p. 8.
45. Wu, J., & Lederer (2009). A Meta-Analysis of the Role of Environment-Based Voluntariness in Information Technology Acceptance. MIS Quarterly, 33(2), 419-432, DOI:
10.1201/9781420074086-b2
46. Žvanut, B., Pucer, P., Ličen, S., Trobec, I., Plazar, N., & Vavpotič, D.
(2011). The effect of voluntariness on the acceptance of e-learning by nursing students. Nurse Education Today, 31(4), 350-355. DOI:
10.1016/j.nedt.2010.07.004