Analysis of the lowest airfares considering the different business models of airlines, the case of Budapest
Gábor Dudás MTA KRTK,
Hungary E-mail:
dudasgabor5@gmail.com Lajos Boros University of Szeged
Hungary E-mail:
borosl@geo.u-szeged.hu Viktor Pál University of Szeged
Hungary E-mail:
pal.viktor@geo.u-szeged.hu Péter Pernyész Qualysoft Informatikai Zrt.
Hungary E-mail:
peter.pernyesz@gmail.com
This study reports the findings of a research that compared the lowest airfares of full-service network carriers and low-cost airlines and mapped the cost distance between Budapest and European cities.
The study investigated return air tickets for three time periods in 48 European cities for travellers who originated from Budapest. The study was based on quantitative research methods using automated internet data collection and a unique GIS-based mapping method to compare airfares and visualise the cost distance between European cities and Budapest. Our findings showed that low-cost airlines outperform full-service network carriers by offering lower-fare air tickets, while the cost distance maps showed that cities accessible by low- cost airlines are ‘closer’ to Budapest in general.
Keywords:
airfare,
low-cost airline, cost distance, air transport, GIS
Introduction
From the second half of the 20th century, the air transport market has undergone significant changes due to the development of new transportation and infocommunication technologies, deregulation of the markets and proliferation of low-cost carriers (LCCs) following the liberalisation of air transport (Garrigos–Simon et al. 2010). The common feature of these processes is that they facilitate spatial flows and speed up travel, while enabling more people to travel cheaper and helping overcome the constraints of time and space. The geographical manifestation of these
processes can be seen in the changes by which the importance of distance is decreasing1. However, these processes do not concern all the places on Earth and not all places and people are affected equally (Dicken 2011, Knowles 2006, Massey 1994, Warf 2006), although many cities are better connected than before (Dobruszkes 2014).
In recent years, Hungary is becoming more and more connected to the global economy and flows, mainly through Budapest, which serves as a gateway to the global flows. Therefore, it is particularly important to know to what extent the Hungarian capital is integrated into the air transport networks and flows. The research rests on the above-discussed theoretical foundations and focuses primarily on Budapest and the role of air transportation in shaping the Hungarian air transportation market/space. In the last two decades, market liberalisation, bankruptcy of the Malév Hungarian Airlines (Malév) in 2012 and proliferation of LCCs significantly changed the aviation segment of Budapest, modifying the regions’ accessibility and spatial relations values considerably. Geographical analyses of low-cost air travel have so far focused primarily on network structure analyses (Dobruszkes 2006, 2009, 2013, Dudás 2010, Graham 2009, Suau-Sanchez–Burghouwt 2011), transferability of low- cost model to long-haul market (Francis et al. 2007, Morell 2008), effects of liberalisation (Doganis 2002, 2005, Dudás 2010, Pompl 2007), definition of catchment areas of airports (Pantazis–Liefner 2006), expansion of tourism under the influence of LCCs (Graham–Dennis 2010, Rey et al. 2011) and pricing behaviour and strategies of LCCs (Malighetti et al. 2009, Pels–Rietveld 2004). Nevertheless, a number of studies have dealt with the Malév bankruptcy and its after-effects, primarily focusing on the air transportation market (CAPA 2012b, Török-Heinitz 2013), tourism (Bohl 2013) and consumer welfare effects (Bilotkach et al. 2014). In contrast, little attention was paid to the space-forming role of LCCs; despite having the characteristics of low-cost business models (e.g. cheap ticket prices and point-to-point routes), LCCs have a significant impact on cities’ cost and time spaces as the increasing number of LCCs might alter the cost accessibility of certain cities.
The aim of the research is to compare the lowest airfares of full-service network carriers (FSNCs) and LCCs. We also seek to understand how the increasing number and market share of LCCs – after the bankruptcy of Malév in February 2012 – shaped ticket prices and, in relation, the cost spaces of Budapest and its air traffic connections. The mapping of these changes requires the use of alternative distance concepts, because as technology advances, the distance between two points is no longer primarily determined by physical distance but by the time and cost needed to cover these distances (Dusek–Szalkai 2007). Thus, the quantification and measurement of the cities’ spatial relations require the use of time distance and cost distance values, which, in our case, are derived from air traffic data.
1 The absolute distance between two points has not changed but relative distances have decreased (Warf 2006).
Based on the issues outlined in the previous paragraphs, the research seeks to answer the following question: How do ticket prices of FSNCs and LCCs shape cost accessibility (cost distance from Budapest) of European cities in our study period? In connection with the above, a further issue will be also analysed: Compared to Budapest, how do the European cities move in space due to changes in airfares if we consider cost distance values instead of geographical distance to analyse the spatial connections of Budapest?
In the first half of the study, we present the applied methods used in the research and briefly summarise what we consider as an LCC in the study. In the second part of the research, we map and analyse the cost distance values of European destinations from Budapest using thematic maps.
Methodology
In the research, we combine the quantitative methods of human geography, transport geography, economic geography and GIS. In the absence of appropriate databases, our research is based mainly on internet data collection, which is a frequently used technique in similar researches (Bilotkach 2010, Dudás et al. 2016, Law et al. 2010, 2011, Lijesen et al. 2002, Zook–Brunn 2006). In this chapter, we describe our methodology and define what we consider to be an LCC.
Defining low-cost airlines
In the last two decades, the emergence and rapid spread of LCCs have revolutionised air transport. The low-cost business model was introduced by Southwest Airlines in the early 1970s (Malighetti et al. 2009). From the 1990s onwards, due to the ongoing liberalisation of aviation markets, more and more airlines adopted the Southwest model, and LCCs have become important global players in aviation. Nowadays, LCCs account for 22 per cent of the worldwide passenger traffic and offer 26 per cent of all airline seats (Budd et al. 2014). The low-cost airline concept is often used as a homogeneous category, but there is neither an up-to-date list of these LCCs nor a universally accepted definition of what is classified as an LCC (Buddet al. 2014, Pels 2008). As a result, academic literature defines LCCs in different ways. In some classifications, airlines are considered as LCC if their ticket prices do not exceed a certain percentage of the prices of FSNCs on the same routes (Dobruszkes 2006, 2009, 2013, Dudás 2010). Others base their classification on the extent to which the airlines adopted the basic elements2 of the low-cost model (Budd et al. 2014, Button–
Ison 2008, Klophaus et al. 2012).
2 These elements include the following: point-to-point traffic, single aircraft type (usually Boeing 737 or the Airbus A320 family), use of secondary or uncongested airports, direct sales of airline tickets through the airline’s website, single cabin class, no in-flight services or frequent-flyer programs, and intensive use of the aircraft with 20–30 min turnaround times.
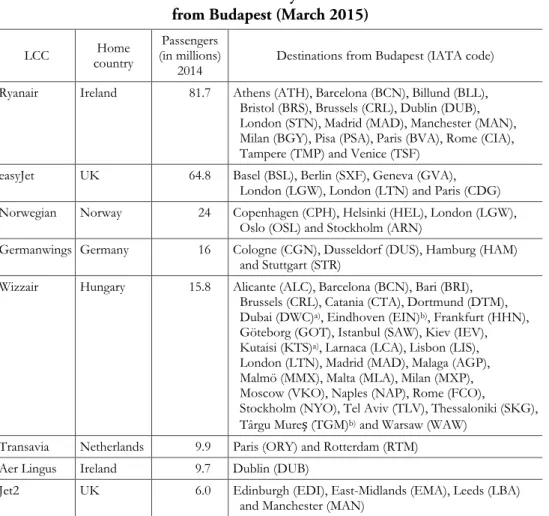
The aim of our study was not to create a new LCC definition; therefore, to determine LCCs, we used the classification created by Klophaus et al. (2012). In that study, the authors used 13 indicators (e.g. fleet homogeneity index, secondary airport index, single cabin class, no frequent-flyer program, point-to-point services only, etc.) to classify the airlines into four categories: 1. pure LCC, 2. hybrid carrier with predominantly LCC characteristics, 3. hybrid carrier with predominantly FSNC characteristics, and 4. FSNC. Using this list, we considered the airlines from the first three categories as LCCs in our study. So, at the time of our research, eight carriers were considered as LCCs (Table 1) from the 39 airlines serving Budapest.
Table 1 Low-cost airlines in the survey and their destinations
from Budapest (March 2015)
LCC Home
country
Passengers (in millions)
2014 Destinations from Budapest (IATA code) Ryanair Ireland 81.7 Athens (ATH), Barcelona (BCN), Billund (BLL),
Bristol (BRS), Brussels (CRL), Dublin (DUB), London (STN), Madrid (MAD), Manchester (MAN), Milan (BGY), Pisa (PSA), Paris (BVA), Rome (CIA), Tampere (TMP) and Venice (TSF)
easyJet UK 64.8 Basel (BSL), Berlin (SXF), Geneva (GVA), London (LGW), London (LTN) and Paris (CDG) Norwegian Norway 24 Copenhagen (CPH), Helsinki (HEL), London (LGW),
Oslo (OSL) and Stockholm (ARN)
Germanwings Germany 16 Cologne (CGN), Dusseldorf (DUS), Hamburg (HAM) and Stuttgart (STR)
Wizzair Hungary 15.8 Alicante (ALC), Barcelona (BCN), Bari (BRI), Brussels (CRL), Catania (CTA), Dortmund (DTM), Dubai (DWC)a), Eindhoven (EIN)b), Frankfurt (HHN), Göteborg (GOT), Istanbul (SAW), Kiev (IEV), Kutaisi (KTS)a), Larnaca (LCA), Lisbon (LIS), London (LTN), Madrid (MAD), Malaga (AGP), Malmö (MMX), Malta (MLA), Milan (MXP), Moscow (VKO), Naples (NAP), Rome (FCO), Stockholm (NYO), Tel Aviv (TLV), Thessaloniki (SKG), Târgu Mureș (TGM)b) and Warsaw (WAW)
Transavia Netherlands 9.9 Paris (ORY) and Rotterdam (RTM) Aer Lingus Ireland 9.7 Dublin (DUB)
Jet2 UK 6.0 Edinburgh (EDI), East-Midlands (EMA), Leeds (LBA) and Manchester (MAN)
Source: Edited by the authors according to the airline’s websites.
a) Non-European destination, therefore not included in the research.
b) During the research, no flights operated by traditional airlines from Budapest to these cities, therefore not included in the research.
Data collection and cartographic representation of cost distance
The next step in the research was determining the analytical units and configuring our databases. As the research is mainly based on the comparison of airfares from Budapest to European cities while considering LCC and FSNC flights, first, we made a database of the cities that are accessible from the Hungarian capital by a direct flight that was of either an LCC or FSNC or both. During the selection process, we noted that some cities have multiple airports; therefore, every airport was treated separately.
This was important in order to get a more detailed picture of the spatial relations of Budapest. Moreover, this offered an opportunity to investigate the cost and time accessibility of city centres from the airports, which enabled further analysis. Thus, at the time of the research, 67 airports of 48 European cities were directly accessible from Budapest, of which 13 were accessible only with an LCC, 12 only with an FSNC and 42 airports with both (Annex 1).
After defining the analytical units, the next step was to query air traffic data between Budapest (departure airport) and European destinations (arrival airports). It is generally known that ticket prices are very volatile and can vary several times during a day. Due to the large number of our analytical units and limitations of internet sites, we were not able to perform a time-series analysis; however, to present certain temporality, we queried data for three time periods (two weeks, one month and three months in advance). Therefore, we have to emphasise that our research provides only a snapshot and presents the situation at the time of data collection. When interpreting the results, we considered these limitations and tried to avoid drawing generalised conclusions. Accordingly, we collected data from a meta-search engine called Skyscanner. It is important to note that Skyscanner is not the only online search site;
there are other important online travel agencies (e.g. Orbitz, Travelocity, etc.), metasearch sites (e.g. Kayak and Momondo) and airline sites. However, during the test queries, Skyscanner displayed the most applicable information and had the most user-friendly interface for an automatic data query. Nevertheless, both ticket prices of FSNCs and LCCs can be queried from the site, which was the main deficiency of former researches (Dudás et al. 2016, Law et al. 2010, Zook–Brunn 2006).
The data collection was conducted on 16 March 2015, for fixed departure dates of two weeks, one month, and three months in advance. The fixed departure dates for the two-week period were from 30 March to 5 April 2015; for the one-month period 13–19 April 2015; and for the three-month period 8–14 June 2015. In the study, seven-day return tickets (from Monday to Sunday) were queried. In order to extract the necessary data, we developed an automated data collection system. We used the Imacros software as our data collection agent; however, we have to note that numerous similar software packages are available (Burghouwt et al. 2007). This program gathers data from the selected website (http://www.skyscanner.com) and stores the result into a database for further analysis according to pre-defined parameters (e.g. departure and arrival airport, departure and return date, direct or
indirect flight, cabin class, passenger numbers, etc.). In every case, the queries were for round-trip flights with the cheapest airfares and flight times.
After the data query, we used a GIS system (ESRI ArcGIS 10) and its tools as well as the Corel Draw graphic software to visualise and handle the queried data.
To determine cost distance values, we used airfares, geographical distances and price per distance parameters between Budapest and the selected destination airports. Cost distance was calculated – based on methodology developed by Dudás et al. (2016) – by dividing the ticket prices with the price per distance parameters.
However, by using the price per distance parameter, we had to take into consideration that databases of former studies (Dudás et al. 2016) did not contain data about LCCs, so they represent data only for FSNCs. As LCCs primarily fly on short-haul routes, we recalculated the price per distance parameter of this category to avoid distorting results. We concluded that the cost of a 1-km flight on short- haul routes is 0.18 USD instead of 0.256 USD as in previous studies. Applying this new parameter, we calculated the cost distance values between Budapest and the destination airports and made the cartographic representation based on the visualisation technique used by Dudás et al. (2016).
Findings and analysis
In the last few years, the bankruptcy of the Hungarian national carrier resulted in significant changes in Budapest’s air transportation market and gave rise to the growth of LCCs. Although LCCs were already present in Hungary, their share rose from 26 per cent to 52 per cent due to the changes (Budapest Airport 2013). According to the Hungarian Central Statistical Office data3, Budapest Airport recovered from the failure of Malév as the airport served 9,155,961 passengers in 2014, outperforming the previous peak of 8.9 million registered in 2011. The airport statistics also show that growth still continues as passenger numbers exceeded 10 million in 2015, number of available passenger seats rose above pre-2012 levels and the average load factor of airlines rose to a record level (79 per cent), which demonstrates the increasing interest of both tourists and business travellers in Hungary and Budapest (Budapest Airport 2015).
Henceforward, we analyse the cost distance of European cities from Budapest accessible with flights from FSNCs and LCCs, and our results are displayed using thematic maps.
Annex 2 presents the average weekly lowest airfares of a given week between Budapest and destinations (55) accessible with an LCC two weeks, one month and three months in advance. Comparing the three time series, in almost all cases, the average airfare was the highest for the two-week time period. Considering the two
3 Source: http://statinfo.ksh.hu/Statinfo/haDetails.jsp?lang=en
weeks and one month values, average airfares decreased by approximately 25 per cent in 43 out of 54 cases, whilst the decline was lower between the two weeks and three months values; approximately 21 per cent in 44 cases. Similar tendencies are outlined by the time series values of the FSNCs (Annex 3). In these cases, the average airfares for the two weeks were also the highest. In relation to the booking date, the two- weeks and one-month average airfares decreased approximately by 19 per cent in 38 out of 53 cases, whilst the decline was also lower between the two week and three months values, approximately 13 per cent in 42 cases. The phenomenon of rising airfares appeared in space relatively dispersed, but both were primarily affected in cases of LCCs and FSNCs’ destinations in Scandinavia. Nevertheless, German destinations also showed constant price increase mainly between the two weeks and one-month values. Based on this, we can state that if we want to book a flight for an LCC or FSNC, we could get best prices one month prior to departure, but we could also buy significantly cheaper tickets three months in advance.
Comparing the average airfares of Annex 2 and 3, it clearly shows that the cheaper airfares are offered by low-cost airlines. However, significant differences are outlined between certain links. The biggest differences between the airfares of the two business models were in the case of Malmö. Tickets offered by FSNCs to the Swedish city were approx. 241 USD (117 per cent) more expensive on average; however, similar major differences were also present in the case of East Midlands (approx. 167 USD, 69 per cent) and Tampere (approx. 132 USD, 125 per cent). The tables also suggest that major differences can be detected in the airfares between Budapest and cities with secondary airports. However, the airfares of LCCs and FSNCs to major Western European capitals and economic and political centres show minor differences, probably due to increased competition and higher demand (e.g. more airlines, higher flight numbers and higher airport charges). Therefore, if someone chooses an LCC on these routes, they could save, for example, up to 63 USD on the fare to Brussels (71 per cent), 63 USD to Frankfurt (59 per cent), 68 USD to Paris (64 per cent), 86 USD to Milan (106 per cent) and 107 USD to London (93 per cent) on average.
During the research, our goal was – besides the comparison of airfares – to map how these values affect the cost accessibility of the selected cities/destinations.
Accordingly, we prepared thematic maps for spatial representation on which we are visualising the relations between airport pairs using cost distance derived from ticket prices.
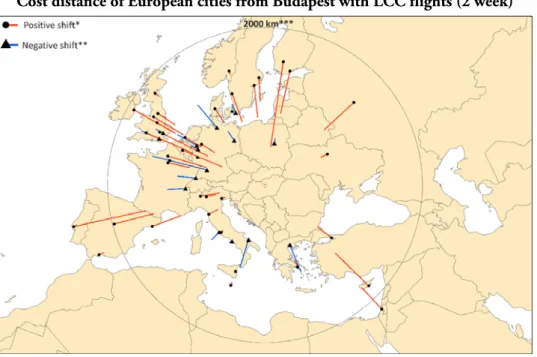
Figure 1 Cost distance of European cities from Budapest with LCC flights (2 week)
Source: Based on http://www.skyscanner.com and edited by the authors
* Flying to this city is cheaper than the two cities’ geographical distance would imply; therefore, the relative position of the city is closer than its geographical position, and the length of the line gives the size of the positive shift.
** Flying to this city is more expensive than the two cities’ geographical distance would imply; therefore, the relative position of the city is farther than its geographical position, and the length of the line gives the size of the negative shift.
*** This circle represents the limit between the short-haul flight zone and medium-haul flight zone. In the former zone, the cost of 1 km travel is 0.18 USD, while, in the latter, it is 0.16 USD.
The cost distance maps (Figures 1–6) show a wide variety of spatial structures.
Based on the two weeks values, both types outline the mixed picture. On the first map of the low-cost airlines (Figure 1), positive shifts are dominant (in 39 of 54 cases);
therefore, the destinations are on average 300 km closer to the Hungarian capital than their geographical distance would imply. By contrast, on the FSNC map (Figure 4), negative tendencies are outlined for the same time period. In this case, among the 53 destinations, only 19 showed positive values, whereas in 32 cases, negative shifts (on average 360 km) can be observed. According to our calculations, destinations of Scandinavia, the Iberian Peninsula and the United Kingdom are accessible predominantly at affordable prices with an LCC, as almost all cases showed positive shifts, whereas the airfares to German destinations are more expensive than their geographical distances would imply. Of the seven German destinations, only Frankfurt and Dortmund showed a positive shift, whereas for the other five cities (Cologne, Dusseldorf, Hamburg, Stuttgart and Berlin), negative trends were
dominant. This is probably because, while Frankfurt and Dortmund are served by Wizzair, the other five destinations are primarily served by Germanwings, which is the subsidiary of Lufthansa; this might have led to less price competition and manifested in higher ticket prices on these routes. Comparing the two maps (Figures 1 and 4), an ‘economic threshold line’ is outlined in the FSNC map. Based on this, the destinations show mainly negative shifts in relation to Budapest within a radius of approx. 1200 km. According to our calculations, airfares to destinations in Germany, Italy and the southern part of Scandinavia are more expensive than their geographical distances would suggest.
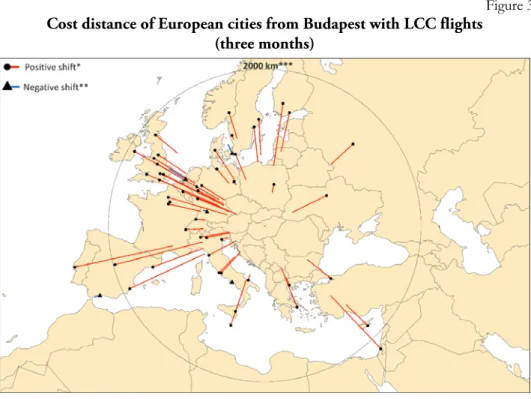
Both the one-month and three-months maps of the LCCs (Figures 2–3) show positive changes in cost distance values, due to the approx. 25 and 21 per cent reduction experienced by the ticket prices, respectively. The one-month values of 54 destinations depicted that each was located closer to Budapest (except Rotterdam and Stuttgart) than their geographical distances would imply. The average of the positive shifts was also higher (approx. 550 km) than in the case of the two-week map. The three-month values (Figure 3) represent similar trends, with the only difference that the rate (on average approx. 470 km) and number (50 from 55 cases) of the positive shifts are less than experienced in Figure 1.
Figure 2 Cost distance of European cities from Budapest with LCC flights (one month)
Source: Based on http://www.skyscanner.com and edited by the authors.
Figure 3 Cost distance of European cities from Budapest with LCC flights
(three months)
Source: Based on http://www.skyscanner.com and edited by the authors.
Figure 4 Cost distance of European cities from Budapest with FSNC flights (two weeks)
Source: Based on http://www.skyscanner.com and edited by the authors.
Figure 5 Cost distance of European cities from Budapest with FSNC flights (one month)
Source: Based on http://www.skyscanner.com and edited by the authors.
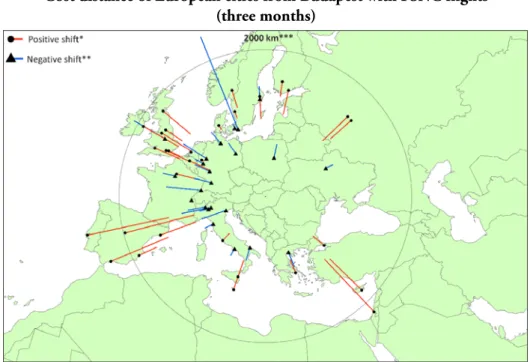
Figure 6 Cost distance of European cities from Budapest with FSNC flights
(three months)
Source: Based on http://www.skyscanner.com and edited by the authors.
However, the 19 and 13 per cent decreases of airfares by the one-month and three- month values of FSNCs do not cause as significant changes as the LCCs. On the maps (Figures 5-6.), similar mixed spatial structures are outlined. In Figure 6, 22 out of 54 destinations, and in Figure 7, 21 out of 55 destinations showed negative shifts.
Henceforward, on both maps, the ‘economic threshold line’ can be determined but at various distances. On the one-month map, the line can be drawn at a distance of approx. 1000 km around Budapest – 200 km closer than at the two-weeks map – while at the three-months map, the line can be drawn approx. 1100 km around the Hungarian capital. Similarly, on the other maps, we can also highlight the positive values of the Iberian Peninsula; the UK and Eastern Scandinavian destinations outside the ‘economic threshold line’ also showed significant positive changes.
Conclusions
In our study, the focus was on the difference between airfares of FSNCs and LCCs and the space-forming role of their ticket prices. The research sought to answer how, after the bankruptcy of Malév, the spread of LCCs affected airline cost spaces of Budapest and cost accessibility of European cities from Budapest Airport. To analyse and visualise these changes, we used cost distance values derived from air traffic data based on automated internet data collection.
After the bankruptcy of Malév, the passenger traffic of Budapest Airport changed significantly as the airport lost about a quarter of its flights. However, the share of LCCs rose from 26 per cent to over 50 per cent (Hungarian Central Statistical Office 2012a, 2012b). This rise, despite the decreasing passenger numbers, resulted in one million new passengers to Budapest, which can mostly be attributed to the LCCs, primarily Ryanair and Wizzair, as they added a lion’s share of the capacity (CAPA 2012a, Török-Heinitz 2013). The beneficiaries of these transformations were clearly those who want to travel cheap, because our results showed that LCCs offered cheaper tickets from Budapest to European destinations than FSNCs in almost all cases.
In response to the question posed at the beginning of the study, we can state that LCCs outperform FSNCs in almost all cases in offering lower-fare air tickets. It was also outlined that considering the three time periods for the departure dates (two weeks, one month and three months), we could travel for the best price if we booked tickets one month in advance. Based on this, relative to the booking date even if it is not linear, a decreasing tendency can be observed in airfares of both LCCs and FSNCs. However, to draw deeper conclusions, further time series analyses are needed.
The cost distance analysis revealed that cities accessible with LCCs from Budapest show decisively positive shifts, so these cities were ‘closer’ to Budapest in relative (cost) terms than their geographical distances would imply. In contrast, the cost
distance maps of the FSNCs outline a mixed picture due to higher airfares, and the negative shifts of European destinations dominate these maps.
In addition, the failure of Malév affected the Western European route network of Budapest to a lesser extent, as the number of directly accessible destinations decreased mainly in Southeast Europe (Dudás–Boros 2014). On this basis, as Budapest is still connected to the European hub airports – which showed good cost distance values during the study – the city is still an integral part of the global flow systems.
REFERENCES
BILOTKACH,V.(2010):Reputation, search cost, and airfares Journal of Air Transport Management 16 (5): 251–257.
BILOTKACH,V.–MUELLER,J.–NÉMETH,A. (2014): Estimating the consumer welfare effects of de-hubbing: The case of Malév Hungarian Airlines Transportation Research Part E 66: 51–65.
BOHL,P. (2013): The consequences of De-hubbing for Airports and Tourism – a Case Study European Journal of Business and Management 5 (25): 168–179.
BUDAPEST AIRPORT (2013): A Malév csőd ellenére jól teljesített a Budapest Airport (Downloaded:
August 12, 2014) http://www.bud.hu/budapest_airport/media/hirek/a-malev- csod-ellenere-jol-teljesitett-a-budapest-airport-12286.html
BUDAPEST AIRPORT (2015):2014-ben minden utasforgalmi rekordot megdöntött a Budapest Airport!
(Downloaded: August 11, 2015)
http://www.bud.hu/budapest_airport/media/hirek/2014-ben-minden- utasforgalmi-rekordot-megdontott-a-budapest-airport!-16139.html
BUDD, L.–FRANCIS, G.–HUMPHREYS, I.–ISON, S. (2014): Grounded: Characterising the market exit of European low-cost airlines Journal of Air Transport Management 34:
78–85.
BURGHOUWT,G.–VAN DER VLIER,A.–DE WIT,J. (2007): Solving the lack of price data availability in (European) aviation economics? ATRS World Conference, Berkeley, USA.
BUTTON,K.–ISON,S. (2008): The economics of low-cost airlines: Introduction Research in Transport Economics 24 (1): 1–4.
CAPA–CENTRE FOR AVIATION AND INNOVATA (2012a): After Malev’s grounding, Hungary could become large LCC market with Wizzair and Ryanair moving in (Downloaded: August 22, 2014)
http://centreforaviation.com/analysis/after-malevs-grounding-hungary-could- become-large-lcc-market-with-wizz-air-and-ryanair-moving-in-67369
CAPA–CENTRE FOR AVIATION AND INNOVATA (2012b): Budapest market recovers following loss of Malev
(Downloaded: August 22, 2014)
http://centreforaviation.com/analysis/budapest-market-recovers-following-loss- of-malev-84065
DICKEN,P. (2011): Global Shift – Mapping the Changing Contours of the World Economy 6th edition.
The Guilford Press, New York–London.
DOBRUSZKES,F. (2006): An analysis of European low-cost airlines and their networks Journal of Transport Geography 14 (4): 249–264.
DOBRUSZKES,F. (2009): New Europe, new low-cost air services Journal of Transport Geography 17 (6): 423–432.
DOBRUSZKES, F. (2013): The geography of European low-cost airline networks: a contemporary analysis Journal of Transport Geography 28: 75–88.
DOBRUSZKES,F. (2014): Geographies of European Air Transport In: GOETZ,A.R.–BUDD,L.
(eds.): The Geographies of Air Transport pp. 167–186., Ashgate, London.
DOGANIS,R. (2002): Flying off Course – The economics of international airlines 3rd edition. Routledge, London–New York.
DOGANIS,R. (2005): The airline business 2nd edition. Routledge, London–New York.
DUDÁS,G. (2010): Low-cost Airlines in Europe: Network Structures after the Enlargement of the European Union Geographica Pannonica 14 (2): 49–58.
DUDÁS,G.–BOROS,L. (2014): A világvárosok térkapcsolatainak vizsgálata légi közlekedési adatok felhasználásával. In: UNGER,J.–PÁL-MOLNÁR,E. (eds.): Geoszférák 2013 pp. 99–122., GeoLitera, Szeged.
DUDÁS,G.–BOROS,L.–PÁL,V.–PERNYÉSZ,P. (2016): Mapping cost distance using air traffic data Journal of Maps 12 (4): 695–700.
DUSEK, T.–SZALKAI, G. (2007): Területi adatok ábrázolási lehetőségei speciális kartogramokkal Területi Statisztika 47 (1): 3–19.
FRANCIS,G.–DENNIS,N.–ISON,S.–HUMPHREYS,I. (2007): The transferability of the low-cost model to long-haul airline operations Tourism Management 28 (2): 391–398.
GARRIGOS-SIMON, F.J.–NARANGAJAVANA, Y.–GIL-PECHUAN, I. (2010): Seasonality and price behaviour of airlines in the Alicante-London market Journal of Air Transport Management 16 (6): 350–354.
GRAHAM,A.–DENNIS,N. (2010): The impact of low-cost airlines operations to Malta Journal of Air Transport Management 16 (3): 127–136.
GRAHAM, M. (2009): Different models in different spaces or liberalized optimizations?
Comparative strategies among low-cost carriers Journal of Transport Geography 17 (4):
306–316.
HUNGARIAN CENTRAL STATISTICAL OFFICE (2012a): Szállítási teljesítmények, 2012.
I. negyedév Statisztikai Tükör 36: 1–2.
HUNGARIAN CENTRAL STATISTICAL OFFICE (2012b): Szállítási teljesítmények, 2012.
II. negyedév Statisztikai Tükör 64: 1–3.
KLOPHAUS,R.–CONRADY,R.–FICHERT,F. (2012): Low cost carriers going hybrid: Evidence from Europe Journal of Air Transport Management 23: 54–58.
KNOWLES,R.D. (2006): Transport shaping space: differential collapse in time-space Journal of Transport Geography 14 (6): 407–425.
LAW,R.–DENIZCI GUILLET,B.–LEUNG,R. (2010): An analysis of the lowest fares and shortest durations for air-tickets on travel agency websites Journal of Travel and Tourism Marketing 27 (6): 635–644.
LAW,R.–LEUNG,R.–DENIZCI GUILLET,B.–LEE,H.A. (2011): Temporal changes of airfares toward fixes departure date Journal of Travel and Tourism Marketing 28 (6): 615–628.
LIJESEN,M.G.–RIETVELD,P.–NIJKAMP,P. (2002): How do carriers price connecting flights?
Evidence from intercontinental flights from Europe Transportation Research Part E 38 (3-4): 239–252.
MALIGHETTI,P.–PALEARI,S.–REDONDI,R. (2009): Pricing strategies of low-cost airlines: The Ryanair case study Journal of Air Transport Management 15 (4): 195–203.
MASSEY,D. (1994): Space, Place, and Gender University of Minnesota Press, Minneapolis.
MORELL,P. (2008): Can long-haul low-cost airline be successful? Research in Transportation Economics 24 (1): 61–67.
PANTAZIS,N.–LIEFNER,I. (2006): The impact of low-cost carriers on catchment areas of established international airports: The case of Hanover airport, Germany Journal of Transport Geography 14 (4): 265–272.
PELS,E. (2008): Airline network competition: Full-service airlines, low-cost airlines and long- haul markets Research in Transport Economics 24 (1): 68–74.
PELS,E.–RIETVELD,P. (2004): Airline pricing behaviour in the London-Paris market Journal of Air Transport Management 10 (4): 279–283.
POMPL, W. (2007): Luftverkehr – Eine ökonomische und politische Einführung Springer, Berlin, Heidelberg, New York.
REY, B.–MYRO, R.–GALERA, A. (2011): Effect of low-cost airlines on tourism in Spain.
A dynamic panel data model Journal of Air Transport Management 17 (3): 163–167.
SUAU-SANCHEZ,P.–BURGHOUWT,G. (2011): The geography of the Spanish airport system:
spatial concentration and deconcentration patterns in seat capacity distribution, 2001-2008. Journal of Transport Geography 19 (2): 244–254.
TÖRÖK,Á.–HEINITZ,F. (2013): Economic impacts on destination air traffic following a flag carrier’s market exit: a case study of Budapest Aviation 17 (4): 161–169.
WARF,B. (2006): Time-space compression In: WARF,B.(ed.): Encyclopedia of Human Geography pp. 491–494., SAGE Publications, London.
ZOOK, M.–BRUNN,S. (2006): From podes to antipodes: Positionalities and global airline geographies Annals of the Association of American Geographers 96 (3): 471–490.
Annex 1 Airports included in the study and their IATA codes
Airport
code Airport Airport
code Airport
AGP Malaga KBP Kiev Borispol
ALC Alicante LBA Leeds
ARN Stockholm Arlanda LCA Larnaca
ATH Athens LCY London City
BCN Barcelona LGW London Gatwick
BGY Milan Orio al Serio LHR London Heathrow
BLL Billund LIN Milan Linate
BMA Stockholm Bromma LIS Lisbon
BRI Bari LTN London Luton
BRS Bristol MAD Madrid
BRU Brussels MAN Manchester
BSL Basel MLA Malta
BVA Paris Beauvais MMX Malmö
CDG Paris Charles de Gaulle MXP Milan Malpensa
CGN Cologne NAP Naples
CIA Rome Ciampino NYO Stockholm Skavsta
CPH Copenhagen ORY Paris Orly
CRL Brussels Charleroi OSL Oslo
CTA Catania PSA Pisa
DME Moscow Domodedovo RTM Rotterdam
DTM Dortmund SAW Istanbul Sabiha
DUB Dublin SKG Thessaloniki
DUS Dusseldorf STN London Stansted
EDI Edinburgh STR Stuttgart
EMA East Midlands SVO Moscow Sheremetyevo
FCO Rome Fiumicino SXF Berlin Schonefeld
FRA Frankfurt TLV Tel-Aviv
GOT Göteborg Landvetter TMP Tampere
GVA Geneva TSF Venice Treviso
HAM Hamburg TXL Berlin Tegel
HEL Helsinki VCE Venice Marco Polo
HHN Frankfurt Hahn VKO Moscow Vnukovo IEV Kiev Zhuliany WAW Warsaw
IST Istanbul Atatürk
Note: Airports in bold are only accessible with an LCC; airports in italics are only accessible with an FSNC; and other airports are accessible with both.
Source: http://www.iata.org
Annex 2 Average lowest LCC airfares from Budapest (in USD)
Airport
code Two
weeks One
month Three
months Airport
code Two
weeks One
month Three months LGW 307,71
(242) 241,50
(176) 183,83
(212) BGY 114,42
(80) 109,57
(72) 82,28 (65) STN 279,71
(226) 128,28
(110) 125,85
(91) PSA 121,00
(84) 112,66
(74) 76,00 (71) LTN 145,57
(113) 141,85
(99) 105,42
(80) NAP 151,66
(123) 163,66
(107) 155,66 (105) MAN 218,83
(186) 209,50
(161) 187,50
(131) CIA 141,71
(120) 121,42
(90) 84,42 (82) BRS 180,00
(166) 142,33
(131) 113,00
(104) FCO 175,00
(131) 175,00
(90) 100,14 (92) EMA 252,00
(219) 246,00
(243) 228,00
(182) TSF 96,00
(74) 77,33
(61) 88,00 (76) EDI 315,00
(246) 329,00
(269) 261,00
(200) HHN 160,50
(149) 158,50
(138) 86,00 (75) LBA 247,00
(247) 241,50
(221) 217,50
(176) CGN 191,85
(145) 163,14
(134) 104,71 (83) DUB 235,85
(195) 177,00
(138) 166,71
(161) DTM 136,42
(93) 90,71
(70) 110,71 (80) CDG 211,71
(160) 174,14
(144) 221,85
(150) DUS 231,00
(165) 191,85
(157) 121,14 (83) BVA 139,50
(122) 125,50
(99) 90,25
(76) HAM 239,14
(213) 183,00
(124) 127,42 (94) ORY 177,00
(121) 132,00
(132) 149,66
(116) STR 266,28
(203) 199,71
(165) 146,00 (83) BCN 204,33
(140) 165,50
(112) 149,00
(122) SXF 148,28
(133) 145,57
(109) 114,85 (81) MAD 263,28
(144) 167,00
(126) 147,00
(85) BSL 201,66
(175) 193,16
(148) 137,50 (74) AGP 355,00
(318) 172,00
(172) 378,00
(378) GVA 224,00
(186) 220,00
(137) 141,14 (93)
ALC 152,50
(148) CRL 106,14
(79) 153,71
(117) 70,57 (51) CPH 182,40
(116) 183,50
(116) 205,33
(189) IEV 141,60
(116) 99,40
(60) 70,00 (52)
(Table continues on next page.)
(Continued.)
Airport
code Two
weeks One
month Three
months Airport
code Two
weeks One
month Three months BLL 168,00
(121) 126,00
(79) 122,66
(101) VKO 184,33
(131) 279,71
(216) 209,00 (183) NYO 154,40
(128) 152,40
(98) 146,28
(93) ATH 186,00
(129) 110,50
(89) 104,25 (97) ARN 193,50
(150) 259,33
(139) 162,83
(139) SKG 214,00
(160) 154,00
(119) 128,50 (108) GOT 152,66
(149) 246,00
(183) 212,33
(183) WAW 108,50
(93) 101,00
(63) 78,50 (47) MMX 200,40
(149) 125,60
(75) 114,28
(93) LCA 223,50
(212) 130,50
(108) 261,00 (183) HEL 167,33
(124) 174,33
(141) 174,66
(141) MLA 235,00
(235) 194,00
(194) 191,50 (148)
TMP 88,00
(77) 122,00
(113) 140,00
(132) TLV 286,33
(216) 313,83
(216) 196,33 (149) OSL 264,57
(229) 264,00
(129) 211,00
(147) RTM 170,00
(114) 332,40
(259) 257,16 (189) BRI 197,75
(116) 133,50
(79) 117,25
(95) SAW 153,28
(110) 118,28
(84) 124,71 (91) CTA 205,00
(194) 132,50
(127) 132,50
(127) LIS 247,50
(232) 194,00
(172) 192,00 (184) MXP 105,42
(63) 105,00
(67) 82,14
(60)
Source: Based on http://www.skyscanner.com and edited by the authors.
Numbers in parentheses indicate the cheapest airfare of the week in USD.
Annex 3 Average lowest FSNC airfares from Budapest (in USD)
Airport
code Two
weeks One
month Three
months Airport
code Two
weeks One
month Three months
LHR 269,85
(230) 216,57
(200) 201,42
(191) LIN 177,00
(148) 176,28
(160) 166,28 (160)
LCY 282,42
(209) 268,85
(224) 231,14
(222) PSA 316,85
(165) 207,14
(165) 168,42 (165)
MAN 208,00
(189) 246,28
(198) 212,42
(198) NAP 236,85
(195) 186,28
(162) 167,71 (165)
BRS 255,28
(203) 250,28
(203) 230,28
(203) FCO 164,00
(126) 152,85
(137) 126,14 (117)
EMA 480,57
(371) 479,85
(371) 372,28
(319) VCE 183,57
(162) 172,57
(163) 165,57 (163)
EDI 256,57
(202) 252,00
(205) 239,14
(224) FRA 196,28
(187) 199,57
(188) 189,00 (187)
LBA 290,85
(258) 319,42
(280) 245,57
(233) CGN 183,28
(174) 192,14
(184) 195,28 (186)
DUB 238,00
(195) 205,14
(181) 245,71
(193) DTM 257,42
(178) 231,00
(188) 239,00 (188)
CDG 157,57
(146) 237,66
(148) 173,16
(142) DUS 185,42
(169) 174,57
(169) 175,00 (171)
ORY 300,71
(250) 279,14
(228) 258,14
(230) HAM 184,71
(161) 210,57
(180) 205,85 (174)
BCN 219,71
(180) 188,28
(172) 181,85
(172) STR 184,00
(172) 186,28
(176) 181,28 (176)
MAD 220,57
(167) 185,57
(172) 180,57
(172) TXL 125,42
(105) 131,50
(107) 159,14 (133)
AGP 348,42
(280) 264,28
(216) 229,42
(204) BSL 249,14
(235) 241,57
(239) 244,42 (239)
ALC 294,57
(252) GVA 202,00
(178) 202,28
(185) 183,42 (181)
CPH 220,14
(172) 201,28
(191) 194,71
(179) BRU 179,28
(168) 170,57
(153) 149,57 (131)
BLL 225,00
(172) 201,85
(184) 196,14
(186) KBP 194,42
(169) 184,57
(182) 184,00 (184)
BMA 327,42
(251) 315,42
(190) 270,42
(201) SVO 250,50
(237) 226,28
(204) 196,28 (179)
(Table continues on next page.)
(Continued.)
Airport
code Two
weeks One
month Three
months Airport
code Two
weeks One
month Three months
ARN 196,42
(172) 202,16
(179) 191,50
(169) DME 220,71
(187) 221,14
(202) 213,28 (205)
GOT 205,14
(171) 225,28
(188) 204,14
(184) ATH 205,00
(189) 189,71
(158) 166,57 (130)
MMX 406,28
(320) 349,57
(285) 422,28
(331) SKG 236,28
(197) 202,28
(199) 187,14 (173)
HEL 205,57
(186) 215,85
(198) 205,85
(169) WAW 198,71
(186) 169,00
(106) 131,14 (106)
TMP 251,14
(194) 263,00
(239) 247,42
(223) LCA 336,14
(278) 283,00
(224) 221,42 (215)
OSL 208,42
(165) 192,71
(176) 227,83
(180) MLA 264,42
(199) 208,42
(181) 203,71 (162)
BRI 304,00
(162) 198,57
(162) 165,00
(162) TLV 232,85
(176) 225,50
(183) 189,00 (157)
CTA 282,28
(204) 195,85
165) 166,57
(165) RTM 303,14
(241) 294,42
(250) 212,14 (186)
MXP 187,00
(163) 185,28
(163) 193,50
(173) IST 187,85
(172) 160,71
(148) 152,14 (148)
BGY 206,57
(169) 217,14
(181) 209,85
(181) LIS 289,14
(244) 235,00
(212) 215,85 (189)
Source: Based on http://www.skyscanner.com and edited by the authors.
Numbers in parentheses indicate the cheapest airfare of the week in USD.