Ph.D. Dissertation University of West Hungary
Simonyi Károly Faculty of Engineering, Wood Sciences and Applied Arts Cziráki József Doctoral School of Wood Sciences and Technolgoies
Bacterial cellulose thin-films for energy harvesting applications
Author: DIMITRIOS TSALAGKAS Research Supervisor: Levente Csóka Ph.D.
Sopron 2015
Bacterial cellulose thin-films for energy harvesting applications Értekezés doktori (PhD) fokozat elnyerése érdekében
a Nyugat-Magyarországi Egyetem Cziráki József Faanyagtudomány és Technológiák Doktori Iskolája Rosttechnikai és nanotechnológiai tudományok programja
Írta:
DIMITRIOS TSALAGKAS
Készült a Nyugat-Magyarországi Egyetem Cziráki József Faanyagtudomány és Technológiák Doktori Iskola Rosttechnikai és nanotechnológiai tudományok programja
keretében
Témavezető: Dr. habil. Csóka Levente Elfogadásra javaslom (igen / nem)
(aláírás) A jelölt a doktori szigorlaton …... % -ot ért el,
Sopron, 2014.12.05.
………...
a Szigorlati Bizottság elnöke Az értekezést bírálóként elfogadásra javaslom (igen /nem)
Első bíráló (Dr. …... …...) igen /nem
(aláírás) Második bíráló (Dr. …... …...) igen /nem
(aláírás) (Esetleg harmadik bíráló (Dr. …... …...) igen /nem
(aláírás) A jelölt az értekezés nyilvános vitáján…...% - ot ért el
Sopron,
………..
a Bírálóbizottság elnöke A doktori (PhD) oklevél minősítése…...
………..
Az EDHT elnöke
I, the undersigned Dimitrios Tsalagkas hereby declare that this Ph.D. dissertation was made by myself, and I only used the sources given at the end. Every part that was quoted word- for-word, or was taken over with the same content, I noted explicitly by giving the reference of the source.
Sopron, April 15th, 2015 .
……….
Dimitrios Tsalagkas
Abstract
Bacterial cellulose films are gaining importance in research, since its superior properties makes bacterial cellulose suitable for several nanocomposite applications. Bacterial cellulose obtained from nata de coco, were purified under four purifications (water, one step, two step and 0.01 M NaOH) treatments. Subsequently, purified samples were submitted under ultasonication. Two main parameters, temperature (no water, cold water and ice water bath) and distance of ultrasonic probe (1 cm and 4 cm distance), were taken under investigation. The overall aim of the work was to develop a method of obtaining homogeneous, self sustaining bacterial cellulose films exhibiting superior structural and physical properties, suitable for energy harvesting devices.
Fourier Transform Infrared Spectroscopy (FT-IR), X-ray Diffraction (XRD), Thermogravimetric Analysis (TGA), Differential Scanning Callorimetry (DSC), Field Emission Microscopy (FE-SEM) and Atomic Force Microscopy (AFM) were implemented to investigate the structural, thermal and morphological changes of treated bacterial cellulose samples.
Morphological analysis displayed that removal of bacterial cellulose impurites was depending on the purification method. Further, results indicated that purification treatments and acoustic cavitation, provoked changes in the hydrogen bonds of crystalline cellulose but did not cause any other changes in the native cellulose. In addition, depending on purification and ultrasound parameters we could obtain higher crystalline and more thermodynamically stable films. Based on the results, the most favourable process to achieve bacterial cellulose films was under 0.01 M NaOH purification, in cold water bath ultrasonication. The distance of the ultrasonic probe was 1 cm from the bottom of the container.
Table of content
Table of contents
1. Introduction and problem statement ... …. 14
1.1. Introduction – bacterial cellulose ... 14
1.2. Bacterial cellulose biosynthesis ... 14
1.3. Acetobacter xylinum... 17
1.4. Bacterial cellulose fabrication ... 18
1.5. Bacterial cellulose structure ... 19
1.6. Bacterial cellulose properties ... 21
1.7. Applications of bacterial cellulose ... 22
1.7.1. Biological / health care applications ... 23
1.7.2. Electronic applications ... 23
1.7.3. Polymer reinforcements ... 24
1.7.4. Nata de coco ... 24
1.8. Acoustic cavitation as a method used for cellulose fiber isolation ... 24
1.9. Piezoelectricity... 25
1.10. Problem statement... 27
2. Materials and methods ... 30
2.1. Materials ... 30
2.2. Experimental details ... 30
2.2.1. Purification of Nata de coco ... 30
2.2.2. Ultrasonication of bacterial cellulose films ... 31
2.2.3. Preparation of bacterial cellulose films ... 31
2.3. Bacterial cellulose films characterization techniques ... 33
2.3.1. Structural analysis of bacterial cellulose films ... 33
Table of content
2.3.2. Thermal analysis of bacterial cellulose films ... 37
2.3.3. Morphological analysis of bacterial cellulose films ... 38
3. Results ... …. 40
3.1. Structural analysis ... 40
3.1.1. Fourier Transform Infrared (FT-IR) spectroscopy ... 40
3.1.2. X-ray diffraction analysis (XRD) ... 61
3.2. Thermal analysis ... 68
3.2.1. Thermo Gravimetric Aanalysis ... 68
3.2.2. Differential scanning calorimetry ... 75
3.3. Morphological ... 78
4. Discussion ... ….. 85
5. References ... ….. 93
List of Figures
List of Figures
Figure 1: Biochemical process for cellulose synthesis by A. xylinum. CS cellulose synthase, GK glucokinase, FBP fructose-1,6-bi-phosphate phosphatase, FK fructocinase, 1FPk fructose-1-phosphate kinase, PGI phosphoglucoisomerase, PGM phosphoglucomutase, PTS system of phosphotransferases, UGP
pyrophosphorylase uridine diphoshoglucose, UDPGlc uridine diphosphoglucose, G6PDH glucose-6-phosphate dehydrogenase, NAD nicotinamide adenine
dinucleotide, NADP nicotinamide adenine dinucleotide phosphate (Chawla et al.
2009). ... 15
Figure 2: The synthesis mechanism of cellulose by Acetobacter xylinum at the cell surface. Linear polymer formation takes place in the pore of the cell surface, while microfibril formation is exogenous (Vitta and Thiruvengadam 2012). ... 16
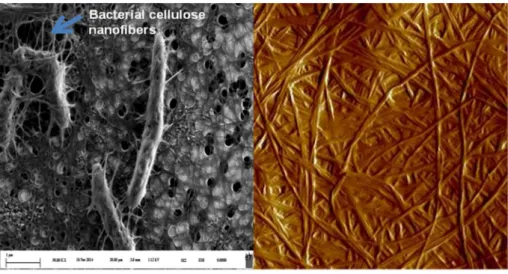
Figure 3: FE-SEM and AFM images of bacterial cellulose network structure ... 16
Figure 4: FE-SEM image of Acetobacter xylinum. ... 17
Figure 5: Molecular structure of cellulose ... 19
Figure 6: Hydrogen bonding network structure in cellulose Iα. ... 20
Figure 7: Projections of the crystal structures of cellulose Iα (left) and Iβ (right) down the axes (top), perpendicular to the chain axis and in the plane of the hydrogen bonded sheets (middle) and perpendicular to the hydrogen bonded sheets (bottom). The cellulose chains are represented by red skeletal models. The asymmetric unit of each structure is also represented in thicker lines with carbons in yellow. The unit cell of each structure is shown in white (Nishiyama et al. 2003). ... 21
Figure 8: Potential biomedical applications of bacterial cellulose based materials (Fu et al. 2013). ... 23
Figure 9: Scheme of the piezoelectric cantilever experimental set up, AFM image of ZnO/bacterial cellulose film and its output voltage (Tsalagkas & Csoka 2013). .... 27
Figure 10: A scheme for HIUS treatment using no water bath (NoW, a), cold water bath (CW, b) and ice water bath cooling (IW, c). Ultrasonic probe was placed close to the top (4 cm distance) and to the bottom (1 cm distance) of the container. ... 32
List of Figures
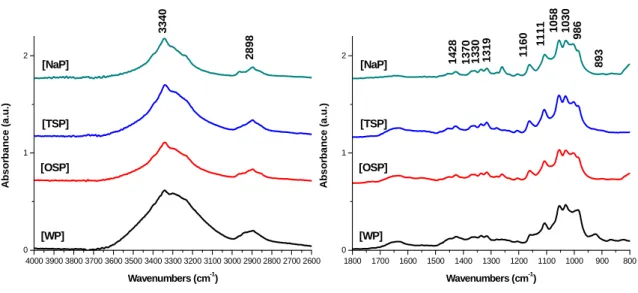
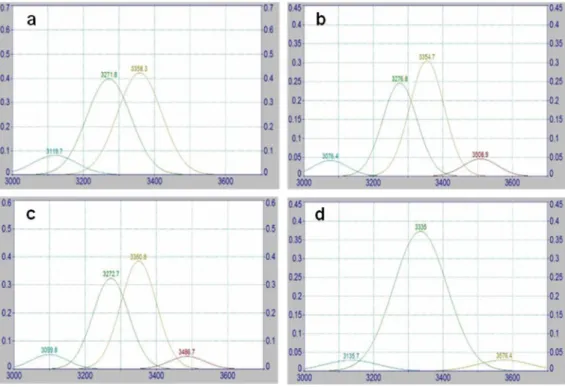
Figure 11: Block diagram of obtaining the bacterial cellulose films... 32 Figure 12: FT-IR spectra in the 4000-400 cm-1 region corresponding to purified and not-ultrasonicated treated samples. ... 40 Figure 13: FT-IR spectra in the 4000-400 cm-1 region corresponding to water purified and ultrasound treated samples. ... 41 Figure 14: FT-IR spectra in the 4000-400 cm-1 region corresponding to one step purified and ultrasound treated samples. ... 41 Figure 15: FT-IR spectra in the 4000-400 cm-1 region corresponding to two step purified and ultrasound treated samples. ... 42 Figure 16: FT-IR spectra in the 4000-400 cm-1 region corresponding to 0.01 M NaOH purified and ultrasound treated samples. ... 42 Figure 17: Comparative FT-IR spectra in the 4000-2600 cm-1 and 1800-800 cm-1 regions respectively corresponding to purified only treated samples. ... 43 Figure 18: Comparative FT-IR spectra in the 4000-2600 cm-1 and 1800-800 cm-1 regions respectively corresponding to water purified and ultrasonicated treated samples. ... 43 Figure 19: Comparative FT-IR spectra in the 4000-2600 cm-1 and 1800-800 cm-1 regions respectively corresponding to one step purified and ultrasonicated treated samples. ... 44 Figure 20: Comparative FT-IR spectra in the 4000-2600 cm-1 and 1800-800 cm-1 regions respectively corresponding to two step purified and ultrasonicated treated samples. ... 44 Figure 21: Comparative FT-IR spectra in the 4000-2600 cm-1 and 1800-800 cm-1 regions respectively corresponding to 0.01 M NaOH purified and ultrasonicated treated samples. ... 45 Figure 22: The deconvoluted spectra of 3600-3000 cm-1 region, for (a) WP, (b) OSP, (c) TSP and (d) NaP purification treatments of bacterial cellulose. ... 47 Figure 23: The deconvoluted spectra of 3600-3000 cm-1 region, for (a)
WP_NoW_1cm, (b) WP_CW_1cm, (c) WP_IW_1cm, (d) WP_NoW_4cm, (e)
List of Figures
WP_CW_4cm and (f) WP_IW_4cm, of water purified cellulose after
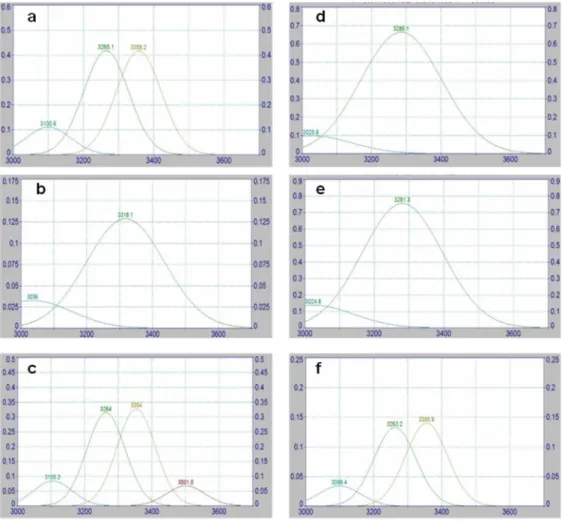
ultrasonication. ... 48 Figure 24: The deconvoluted spectra of 3600-3000 cm-1 region, for (a)
OSP_NoW_1cm, (b) OSP_CW_1cm, (c) OSP_IW_1cm, (d) OSP_NoW_4cm, (e) OSP_CW_4cm and (f) OSP_IW_4cm, of one step purified cellulose after
ultrasonication. ... 49 Figure 25: The deconvoluted spectra of 3600-3000 cm-1 region, for (a)
TSP_NoW_1cm, (b) TSP_CW_1cm, (c) TSP_IW_1cm, (d) TSP_NoW_4cm, (e) TSP_CW_4cm and (f) TSP_IW_4cm, of two step purified cellulose after
ultrasonication. ... 50 Figure 26: The deconvoluted spectra of 3600-3000 cm-1 region, (a) NaP_NoW_1cm, (b) NaP_CW_1cm, (c) NaP_IW_1cm, (d) NaP_NoW_4cm, (e) NaP_CW_4cm and (f) NaP_IW_4cm, of 0.01 M NaOH purified cellulose after ultrasonication. ... 51 Figure 27: Crystallinity indices (TCI, LOI) and hydrogen bond intensity (HBI) prepared at different not-ultrasound purification treatments. ... 55 Figure 28: Crystallinity indices (TCI, LOI) and hydrogen bond intensity (HBI) prepared at different ultrasound conditions, after water purification treatment. .. 56 Figure 29: Crystallinity indices (TCI, LOI) and hydrogen bond intensity (HBI) prepared at different ultrasound conditions, after one step purification treatment.
... 58 Figure 30: Crystallinity indices (TCI, LOI) and hydrogen bond intensity (HBI) prepared at different ultrasound conditions, after two step purification treatment.
... 59 Figure 31: Crystallinity indices (TCI, LOI) and hydrogen bond intensity (HBI) prepared at different ultrasound conditions, after 0.01 M NaOH purification treatment. ... 60 Figure 32: X-ray diffraction of bacterial cellulose with different purification
methods. ... 62 Figure 33: X-ray diffraction of water purified bacterial cellulose with different ultrasound conditions. ... 63
List of Figures
Figure 34: X-ray diffraction of one step purified bacterial cellulose with different ultrasound conditions. ... 63 Figure 35: X-ray diffraction of two step purified bacterial cellulose with different ultrasound conditions. ... 64 Figure 36: X-ray diffraction of 0.01 M NaOH purified bacterial cellulose with different ultrasound conditions. ... 64 Figure 37: TGA curves of WP, OSP, TSP and NaP treated bacterial cellulose
samples under different ultrasound operating conditions. ... 68 Figure 38: dTGA curves of WP, OSP, TSP and NaP treated bacterial cellulose samples under different ultrasound operating conditions. ... 69 Figure 39: TGA and dTGA curves of WP treated bacterial cellulose samples under different ultrasound operating conditions. ... 70 Figure 40: TGA and dTGA curves of OSP treated bacterial cellulose samples under different ultrasound operating conditions. ... 71 Figure 41: TGA and dTGA curves of TSP treated bacterial cellulose samples under different ultrasound operating conditions. ... 72 Figure 42: TGA and dTGA curves of NaP treated bacterial cellulose samples under different ultrasound operating conditions. ... 73 Figure 43: DSC thermograms of WP treated bacterial cellulose samples under different ultrasound operating conditions. ... 76 Figure 44: DSC thermograms of OSP treated bacterial cellulose samples under different ultrasound operating conditions. ... 76 Figure 45: DSC thermograms of TSP treated bacterial cellulose samples under different ultrasound operating conditions. ... 77 Figure 46: DSC thermograms of NaP treated bacterial cellulose samples under different ultrasound operating conditions. ... 77 Figure 47: FE-SEM micrographs of WP, OSP, TSP and NaP purified bacterial cellulose samples. ... 79 Figure 48: FE-SEM micrographs (1µm and 200 nm) of WP and WP_CW_1cm bacterial cellulose samples. ... 80
List of Figures
Figure 49: FE-SEM micrographs (1µm and 200 nm) of OSP and OSP_CW_4cm bacterial cellulose samples. ... 80 Figure 50: FE-SEM micrographs (1µm and 200 nm) of TSP and TSP_CW_1cm bacterial cellulose samples. ... 81 Figure 51: FE-SEM micrographs (1µm and 200 nm) of NaP and NaP_CW_1cm bacterial cellulose samples. ... 81 Figure 52: AFM images (5x5 µm) of the most favourable bacterial cellulose
samples prior to (left) and after (right) ultrasonication. ... 82 Figure 53: AFM images (1x1 µm) of the most favourable bacterial cellulose
samples prior to (left) and after (right) ultrasonication. ... 83 Figure 54: Bacterial cellulose WP, NaP and NaP_CW_1cm dried films. ... 84
List of Tables
List of Tables
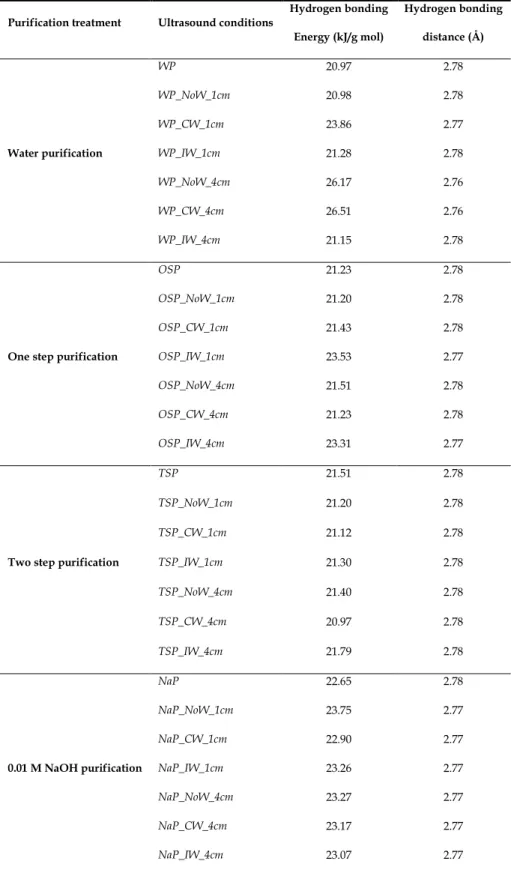
Table 1: The energy hydrogen bond and hydrogen bonding distance of
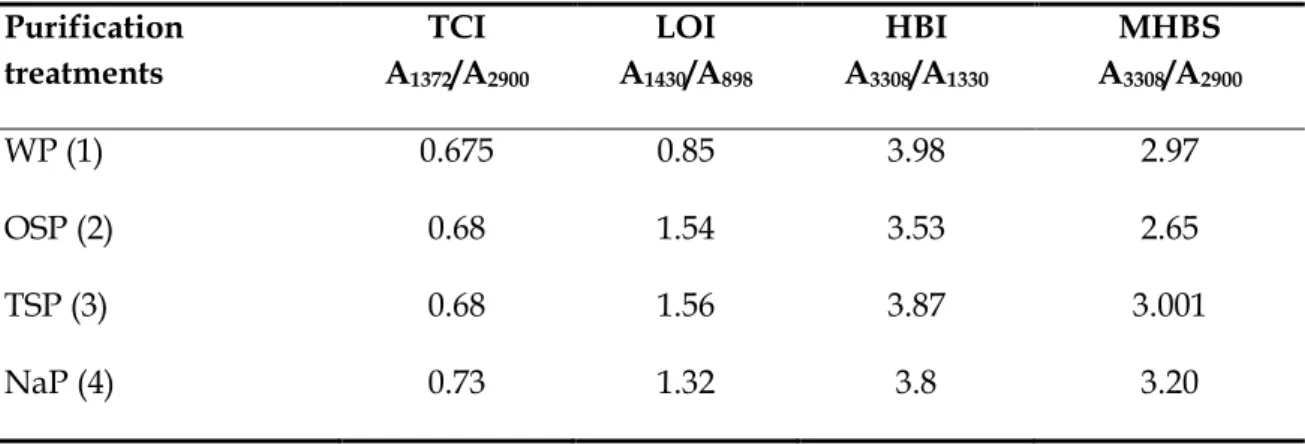
intramolecular hydrogen bond of 3-OH···O-5 for studied samples. ... 52 Table 2: Determined crystallinity indices (TCI and LOI), hydrogen bond intensity (HBI) and mean hydrogen bond intensity (MHBS) for purified, not-ultrasonicated bacterial cellulose samples. ... 54 Table 3: Infrared crystallinity indices (TCI, LOI), hydrogen bond intensity (HBI) and mean hydrogen bond strength (MHBS) of ultrasonicated bactetial cellulose, after water purification treatment. ... 56 Table 4: Infrared crystallinity indices (TCI, LOI), hydrogen bond intensity (HBI) and mean hydrogen bond strength (MHBS) of ultrasonicated bacterial cellulose, after one step purification treatment. ... 57 Table 5: Infrared crystallinity indices (TCI, LOI), hydrogen bond intensity (HBI) and mean hydrogen bond strength (MHBS) of ultrasonicated bactetial cellulose, after two step purification treatment. ... 59 Table 6: Infrared crystallinity indices (TCI, LOI), hydrogen bond intensity (HBI) and mean hydrogen bond strength of ultrasonicated bactetial cellulose, after 0.01 M NaOH purification treatment. ... 60 Table 7: XRD peak intensity percent (%) at 2 angles and Cr.I for purified bacterial cellulose with different ultrasound parameters. ... 65 Table 8: d-spacings, crystallites sizes, and crystalline interior chain values of treated bacterial cellulose samples. ... 67 Table 9: Summary of TGA and dTGA data for bacterial cellulose samples after different purification and ultrasound treatments. ... 74 Table 10: Peak wavenumbers of FTIR absorption bands related to cellulose I and regenerated cellulose II, their interpretation according to the literature (Carrillo et al. 2004, Ciolacu et al. 2011, Colom & Carrillo 2002, Colom et al. 2003, Fan et al.
2012, Gea et al. 2011, Halib et al. 2012, Kondo & Sawatari 1996, Kondo 1998, Liu et al. 2005, Ohet al. 2005, Široký et al. 2010). ... 105
List of Tables
Table 11: Explanation of abbreviation names, given to the investigated bacterial cellulose specimens. ... 110
Introduction – problem statement
1. Introduction and problem statement
1.1. Introduction – bacterial cellulose
Plant based cellulose, even though useful for many applications, is not produced in pure state. The presence of lignin, hemicelluloses and other molecules, even though are important for the cell structure of woods, requires intensive processes until is suitable for medical use. In contrast, bacterial cellulose while identical to plant cellulose in chemical structure is produced without contaminant molecules and morphologically differs from plant cellulose. Bacterial cellulose, also known as microbial cellulose, is a promising natural polymer synthesized by certain bacteria. Bacterial cellulose due to its supramolecular structure and high purity, cellulose content demonstrates unique properties. Microbial cellulose is entirely free of “contaminants” such as lignin, hemicelluloses and pectin typical components in plant cellulose of wood. Thus, bacterial cellulose is a very useful biomaterial, which could be used in many different industrial processes.
1.2. Bacterial cellulose biosynthesis
Bacterial cellulose is produced by species of various genera of bacteria including Acetobacter (renamed Gluconacetobacter), Agrobacterium, Achromobacter, Aereobacter, Acanthamoeba, Achromobacter, Sarcina, Rhizobium, Alcaligenes, Zoogloea and others. The most widely studied bacteria is strains of Acetobacter xylinum or nowadays Glucoanacetobacter xylinus due to its high efficient productivity of bacterial cellulose (Chawla et al. 2009, Petersen and Gateholm, 2011).
Synthesis of an extracellular gelatinous film produced from Acetobacter xylinum first time was reported in 1866 by A. J. Brown, but intensive studied of producing bacterial cellulose films started in the second half of the 20th century. Biosynthesis of bacterial cellulose is a precise and specifically adjusted multi-step process, involving a large number of both individual enzymes and complexes of catalytic and regulatory proteins. The process and mechanisms includes the (i) synthesis of uridine diphosphoglucose (UDPGlc) which is the cellulose precursor, followed by formation of β-1,4-glucan chain and glucose polymerization, and (ii) assembly and crystallization of cellulose chains into characteristic
Introduction – problem statement
ribbon-like structure formed by many individual chains (Bielecki et al. 2005, Chawla et al.
2009) (Figure 1).
A detailed description regarding cellulose formation from bacteria is given by Vitta and Thiruvengadam (2012) (Figure 2). The synthesis of bacterial cellulose network is extracellular, occurs between the outer and plasma membranes of the bacterial cell and has two distinct stages: (i) linear polymerization of the cellobiose units catalyzed by the enzyme and (ii) cellulose synthase followed by crystallization of the linear chains. During biosynthesis process, several carbon compounds of the nutrition medium are utilized by the bacteria, polymerized into single, linear β-1,4-glucan chains and finally the fibrils secreted outside the cells through a linear row of pores located on their outer membranes in the culture medium, creating this dense network by self-assembling.
Figure 1: Biochemical process for cellulose synthesis by A. xylinum. CS cellulose synthase, GK glucokinase, FBP fructose-1,6-bi-phosphate phosphatase, FK fructocinase, 1FPk fructose- 1-phosphate kinase, PGI phosphoglucoisomerase, PGM phosphoglucomutase, PTS system of
phosphotransferases, UGP pyrophosphorylase uridine diphoshoglucose, UDPGlc uridine diphosphoglucose, G6PDH glucose-6-phosphate dehydrogenase, NAD nicotinamide adenine
dinucleotide, NADP nicotinamide adenine dinucleotide phosphate (Chawla et al. 2009).
Introduction – problem statement
Around 10 to 15 linear β-1,4-glucan chains aggregate to form subfibrils, which have a width of approximately 1.5 nm. Bacterial cellulose subfibrils are crystallized into microfibrils of width 3.5 nm. Following, microfibrils are combined to form bundles, which shaped into ribbons. The aggregates form bands of width ~100 nm called fibrillar bands.
The thick, gelatinous membrane formed in static culture conditions is characterized by a 3- D structure consisting of an ultrafine network of highly, uniaxially oriented cellulose fibrilar bands, stabilized by the hydrogen bonds existing in cellulose units (Czaja et al 2006, Vitta and Thiruvengadam 2012) (Figure 3).
Figure 2: The synthesis mechanism of cellulose by Acetobacter xylinum at the cell surface. Linear polymer formation takes place in the pore of the cell surface, while
microfibril formation is exogenous (Vitta and Thiruvengadam 2012).
Figure 3: FE-SEM and AFM images of bacterial cellulose network structure
Introduction – problem statement
Figure 4: FE-SEM image of Acetobacter xylinum.
“Bacterial cellulose membranes exhibit uniplanar orientation with the (110) planes parallel to the fiber surface and an additional axial orientational component that depends on the drying procedure” (Fu et al. 2011).
The main effect of the nanosize of the fibrils is an increase in surface area of the bacterial cellulose network, which is reflected in strong interactions with the surrounding environment. Therefore bacterial cellulose, binds large amounts of water, up to 99 % of its own weight during biosynthesis in the aqueous culture media. From this 99% water present in bacterial cellulose, the majority is bound to cellulose and only 10% behaves like a free bulk water (Gelin et al. 2007).
1.3. Acetobacter xylinum
Acetobacter xylinum (Figure 4) was first described by Brown in 1886 who identified a jelly like film formed over the surface of a vinegar fermentation broth. It is a simple, aerobic, Gram-negative, prokaryotic, non-photosynthetic bacterium which has an ability to synthesize a large quantity of high quality cellulose organized as twisting ribbons of microfibrillar bundles. (Czaja et al 2006).
The amount of bacterial cellulose produced from Acetobacter spp. could vary from 1.0 to 4.0 % (w/v) depending on fermentation media and the carbon compounds (Lin et al. 2013).
At pH values ranging from 4 to 6, temperature between 28 and 30 ℃ and duration of
Introduction – problem statement
cultivation from 3 to 7 days the production efficiency is usually around 50% (Chawla et al.
2009, Esa et al. 2014).
1.4. Bacterial cellulose fabrication
Many researchers have investigated the production of bacterial cellulose as well as the factors which influence their productivity, crystallinity, molar mass, Iα/Ιβ (cellulose Iα to cellulose Iβ) ratio and other physicochemical effect of the obtained bacterial cellulose pellicles. These structural differences can be of great significance since they determine the properties and hence the final applications of bacterial cellulose.
Many variables influence the total production process and performance of the biomaterial: (i) type and conditions (time of fermentation, additives) of culture methods, (ii) fermentation medium compounds based on carbon and nitrogen sources, (iii) type of bacterial strains, (iv) environmental factors (pH, temperature, dissolved oxygen content, stirrer speed), (v) post-fermentation operations, (vi) type of efficient, large scale fermentation process.
The two main methods of bacterial cellulose cultivation are static and agitated cultures.
Macroscopic morphology and properties of bacterial cellulose is highly affected by cultivation conditions (Czaja et al. 2004, Sarkono et al. 2014, Uraki et al. 2007, Watanabe et al. 1998).
Acetobacter xylinum has the ability to grow and produce cellulose on a variety of substrates. The fermentation medium contains carbon, nitrogen and other macro- and micronutrients required for the growth of the organism. The changes in the carbon and/or nitrogen sources affect the growth and the product formation directly or indirectly. The productivity of carbon resources could be different in many studies which may be related to the time of fermentation, the carbon source concentration, the surface/volume ratio or the relative surface area of the fermentation system (Khajavi et al. 2011, Pineda et al. 2010, Sheykhnazari et al. 2011).
Many bacterial strains exhibit differences in the cellulose production process as well as in the structure of the obtained cellulose (Castro et al. 2012, Czaja et al. 2007, McKenna et al. 2009, Mohite & Patil 2014).
Introduction – problem statement
Bacterial microorganisms, such as Acetobacter xylinum respond rapidly to environmental changes in many aspects such as induction and repression of protein synthesis and changes in cell morphology (Chawla et al. 2009).
Post fermentation operations such as the degree of dehydration, physical squeezing, and treatment with bases affect the efficiency of the final membrane (Czaja at al 2006).
1.5. Bacterial cellulose structure
Cellulose is a natural, linear polymer consisting of ringed glucose molecules made of β- 1,4 glucopyranose molecules, which are covalently linked through acetal functions between the OH groups of C1 and C4 carbon atoms. The repeat unit is comprised of two anhydroglucose rings (C6H10O5)n bond together in such a way that one molecule is rotated 180 degrees in order to accommodate the bond angles of acetal oxygen bridges. These two adjacent glucose molecules compose the basic repeat cellulose unit called cellobiose (Figure 5).
Physical properties of cellulose are influenced by its hydrogen bonding network. The three kinds of hydroxyl groups bond equatorially in anhydroglucose units under different polarities, and the resulting inter- and intamolecular interactions are responsible for the stabilization, crystalline structure and hydrophilic nature of cellulose (Figure 6).
Figure 5: Molecular structure of cellulose
Introduction – problem statement
Cellulose has different crystalline polymorphs. In native cellulose (cellulose I) found in nature, there are two intramolecular hydrogen bonds, which are between the OH-3···O5΄, and between the OH-2··· Ο6’ for bonding the layers and one intermolecular hydrogen bond, OH-6···O3 for linking the layers laterally, depending on the hydroxymethyl conformation at the C-6 position. (Kondo 2004).
Native cellulose I consists of two distinct crystal phases, namely Iα and Iβ. The Ια/Ιβ ratio defines cellulose properties and varies within the cellulose microfibrils as well as in different cellulose sources. Algae and bacterial cellulose specimens are rich in Iα form, while cotton, wood and ramie fibers are rich in Iβ crystalline allomorph (Habibi et al. 2010).
The crystal structure and hydrogen-bonding system in cellulose Iα and Iβ respectively from synchrotron X-ray and neutron fiber diffraction apparatus are shown in Figure 7 (Nishiyama et al. 2003 and 2002). In both of these structures, cellulose chains are parallel but they differ in their hydrogen bonding patterns, i.e. in the crystalline structure. Iα
corresponds to a triclinic unit cell (a = 0.6717 nm, b = 0.5962 nm, c = 1.040 nm, α = 118.080, β = 114.800 and γ = 80.370) containing only one chain per unit cell, while Iβ exists in a monoclinic unit cell having two cellulose chains (a = 0.7784 nm, b = 0.8201 nm, c = 1.038 nm, α = β = 900 and γ = 96.50). Furthermore, Iα type cellulose is metastable and can be converted irreversibly into the irreversible Iβ.
Figure 6: Hydrogen bonding network structure in cellulose Iα.
Introduction – problem statement
1.6. Bacterial cellulose properties
The chemical structure of bacterial cellulose is like that of plant cellulose, but the degree of polymerization differs. Degree of polymerization is 2,000 to 6,000 for bacterial cellulose, while for plant cellulose is around 13,000 to 14,000 anhydroglucose units. Its nanofibrils have similarities with extracellular matrix components and more particularly with collagen (Bielecki et al. 2005, Khajavi et al. 2011). Bacterial cellulose exhibits higher purity, water- holding capacity, crystallinity and mechanical strength related to plant based cellulose (Sheyknazari et al. 2011).
Bacterial cellulose fibers have high aspect ratio with a diameter of 20-100 nm. The size of bacterial cellulose microfibrils specific surface is 100 times smaller than plant cellulose (3-4 nm thick and 70-80 nm wide). As a result, bacterial cellulose has a large surface area per unit mass that in combination with the hydrophilic nature of cellulose can hold a large
Figure 7: Projections of the crystal structures of cellulose Iα (left) and Iβ (right) down the axes (top), perpendicular to the chain axis and in the plane of the hydrogen bonded sheets (middle) and perpendicular to the hydrogen bonded sheets (bottom).
The cellulose chains are represented by red skeletal models. The asymmetric unit of each structure is also represented in thicker lines with carbons in yellow. The unit cell
of each structure is shown in white (Nishiyama et al. 2003).
Introduction – problem statement
amount of water, up to 200 times of its dry mass (Czaja et al. 2006, Khajavi et al. 2011, Fu et al. 2011).
Bacterial cellulose has a crystallinity of the order of 65-79%. Typically its crystals have square section, there is around 100 cellulose chains per crystals with roughly 40 chains located at the crystal surface (Verlhac and Dedier, 1990). The Young’s modulus of a single filament or microfibril of bacterial cellulose as estimated using a Raman spectroscopy technique is 130-140 GPa (Gea et al. 2011).
Further it is a biocompatible, non toxic with no allergenic side effects material. (Lin et al. 2013). Bacterial cellulose is remarkable for its strength and its ability to be engineered structurally and chemically at nano-, micro- and macroscales in any shape or form. Bacterial cellulose hydrogels demonstrate significant characteristics such as (i) the biofabrication of a dimensional stable hydrogel, (ii) control of 3D shape, which could be reproduced of predetermined shape by the type of cultivation and kind of bioreactor and (iii) control of macroporosity by introduction of porogens (Gatenholm and Klemm 2010, Petersen and Gateholm, 2011).
Rodlike species, such as cellulose, can form ordered liquid crystal phases when their concentration reaches a certain critical value depending on the source and on the hydrolysis conditions. Above the critical concentration, suspensions of cellulose crystallite separate into two phases with very clear phase boundaries. The lower anisotropic phase shows optical properties characteristic of chiral nematic liquid crystals (Hirai et al. 2009).
However, the lack of large scale commercialization production, its low volumetric production and high price of bacterial cellulose restricts its utilization in many practical applications.
1.7. Applications of bacterial cellulose
Beside the drawbacks, described above there are several key practical applications, where the price for example can not play a significant role. Moreover, because of its unique physicochemical and mechanical properties, bacterial cellulose can be utilized in various, specific fields. Several publications have focused on its applications or potential
Introduction – problem statement
applications. The applications of the bacterial cellulose could be summarized in the following applications.
1.7.1. Biological / health care applications
Much work has already focused on designing ideal biomedical devices from bacterial cellulose such as artificial skin, artificial blood vessels, artificial cornea, heart valve prosthesis, artificial urethra, artificial bone, artificial cartilage, artificial porcine knee menisci (Figure 8)(Fu et al. 2013).
1.7.2. Electronic applications
Another future application is to achieve an electronic (OLED) display using bacterial cellulose membrane (Legnani et al. 2008, Ummartyotin et al. 2012). The main advantages of an electronic paper device are its high paper-like reflectivity, flexibility, contrast and biodegradability. The device has the potential to be extended to various applications, for instance e-book tablets, e-newspapers, dynamic wall papers, rewritable maps and learning tools (Shah and Brown 2005), biosensors or actuators (Baptista et al. 2013, Yang et al 2009).
Bacterial cellulose also is a superior material for headphone and loudspeaker membranes Figure 8: Potential biomedical applications of bacterial cellulose based materials
(Fu et al. 2013).
Introduction – problem statement
due to the high modulus of elasticity and large internal loss factor (Gatenholm and Klemm 2010).
1.7.3. Polymer reinforcements
The thermal stability and degree of polymerization of nanocrystals are two crucial factors for their use as reinforcing material in the fabrication of polymer nanocomposites.
1.7.4. Nata de coco
Chemically pure cellulose can be used in processed foods as thickening and stabilizing agent. Bacterial cellulose is mainly produced to make nata de coco, originated from Philippines. Nata de coco is a white, gelatinous dietary sweet used in food applications such as desserts and fruit cocktails. It is usually produced in static cultivation of Acetobacter xylinum with coconut water used as carbon source. The thick sheets of bacterial cellulose are then cut into cubes, washed and boiled in water before cooking in sugar syrup.
Commercial nata de coco is made by large and mid-size companies and small or home industries in Philippines, Indonesia, Thailand and other South East Asian countries (Esa et al. 2014, Phisalaphong & Chiaoprakobkij 2012).
Nata de coco as a source of bacterial cellulose has been intensively examined by a research group in Malaisia. They investigated the physicochemical properties (Halib et al.
2012), solubility behavior (Pandey et al. 2014) and the effect of drying methods (Amin et al. 2014, Pa’e et al. 2014) of nata de coco. Hosakun et al. (2014) utilized bacterial cellulose membranes obtained from nata de coco for CO2/CH4 gas separation, and Blaker et al.
(2010) produced a nata de coco/polylactic acid (PLA) nanocomposite film to obtain 3D scaffolds.
1.8. Acoustic cavitation as a method used for cellulose fiber isolation
There are several methods existing for cellulose fiber isolation. The most important and widely used ones for producing cellulose nanofibrils are the mechanical, chemical, physical and biological methord or combinations of them. The most well known mechanical methods are refining, high pressure homogenization, microfluidization, grinding,
Introduction – problem statement
cryocrushing and ultrasonication. Physical methods include microwave and gamma rays irradiation. Chemical isolations usually include acid hydrolysis with strong acids like sulfuric acid (H2SO4), alkaline hydrolysis mostly with sodium hydroxide (NaOH), organic solvent treatments, ionic liquid treatments. Enzymatic hydrolysis is considered as a biological method. However, cellulose nanocrystalls produced by most of these methods results in reduced crystallinity cellulose or regenerated cellulose II type, or demand large energy amounts (Abdul Khalil et al. 2014, Frone et al. 2011).
Ultrasound generators transform electrical energy into ultrasonic energy, which is a mechanical energy. The effects of high intensity ultrasound depend on many variables such as reaction time characteristics, treatment parameters, ultrasound generator characteristics and size and geometry of treatment vessel, but also on ultrasonication conditions (Raso et al. 1999). The electrical power input into a sonochemical process is related to the energy conversion of an ultrasonic device, thus to the efficiency of sonochemical process (Löning et al. 2001).
According to Zhao et al. (2007) the use of ultrasound, i.e. by acoustic cavitation has been demonstrated to be an efficient tool in cellulose isolation, decomposition, processing and pretreatment in many occasions. Acoustic cavitation is the formation, growth and sudden collapse of microbubbles in liquids, generating high temperature and pressure conditions which can induce chemical and physical transformations. The main chemical effects of cavitation phenomena include free radical formation, due to the decomposition of water.
Wang and Cheng (2009) investigated the effect of six ultrasound parameters, i.e. power, temperature, time, concentration, fibers size and distance of ultrasonic probe to check the efficiency of high intensity ultrasound on cellulose isolation. They concluded that ultrasound could be used to treat cellulosic materials in order to produce small fibrils.
1.9. Piezoelectricity
The famous French brothers Pierre and Jacques Curie in 1880 discovered an unusual characteristic of some crystals. These crystals displayed an electric polarization when mechanical stress was applied (called direct piezoelectric effect) and reverse (called converse piezoelectric effect). This behavior was labeled as piezoelectric effect from the
Introduction – problem statement
Greek word “piezein” meaning to press or squeeze (Stephens 1972). The term
“piezoelectricity” refers to the production of bound electrical charges in the surfaces of a material or crystals specimens by the imposition of some form of elastic, mechanical or electrical stress (Ballato 1996).
Piezoelectric materials owe their capacities generally to their asymmetrical arrangement of positively and negatively charged atoms in their crystal structure. Piezoelectricity is found in many natural substances, such as bone, wood and ice, due to their polar nature and crystal asymmetry in their structure (Fukada 1995). The oldest scientific work about the piezoelectric effect of wood was a paper from 1940 cited in the book “Piezolectric Properties of Wood” by the Soviet researcher Valerie A. Bazhenov (Plackner 2009).
In general, any kind of cellulose (native or regenerated) is capable of producing piezoelectricity. Piezoelectric effect of wood or any other cellulose source (bacterial, tunicates, wooden pulp, ramie etc.) exists due to the chemical and crystalline structure of cellulose fibrils. The magnitude of piezoelectric constant depends on the degree of crystallinity, the alignment of its disordered and amorphous regions and the orientation of cellulose crystals (Fukada 2000, Hirai et al. 2011).
Piezoelectricity in cellulose is generated from dipole orientation and the monoclinic and triclinic crystal structure in cellulose chains. According to Fukada (1968) these dipoles are the hydroxyl groups in crystal lattice of cellulose. Csoka et al. (2012) estimated the shear piezoelectric constant of aligned cellulose nanocrystals thin films to be 0.21 nm/V. The piezoelectric constant of regenerated cellulose was measured to be 0.035-0.06 nm/V (Huang 2008). Tsalagkas et al. (2013) investigated the likelihood of zinc oxide (ZnO)/bacterial cellulose films as material for low powering, energy harvesting devices (Figure 9). Results showed that the measured piezoelectric constant and energy conversion efficiency could be potentially suitable for such kind of applications. However, further research and improvements are still needed to be accomplished.
Introduction – problem statement
1.10. Problem statement
The main purpose of this study was to develop an easy, fast, low cost method for obtaining bacterial cellulose thin films suitable for nanotechnology and energy harvesting applications. To meet these expectations we specified the objectives as follows:
Objective I: Purification of bacterial cellulose obtained from nata de coco
Even though, bacterial cellulose is free from hemicelluloses and lignin contaminants, the ferment broth contains other impurities such as bacterial cellulose debris and culture medium remainings. Thus, the fermented broth needs to be purified, to obtain pure cellulose. The most suitable purification methods for removal of the above mentioned impurities are using distilled water, sodium hydroxide and sodium hypoclorite aqueous solutions, or organic acids like acetic acids (Chawla et al. 2009, Pecoraro et al. 2007).
Highly crystalline cellulose is always in demand as an engineered cellulose to incorporate in production of bio-nanocomposites. The aims of the used purification treatments were to: (i) maintain the native cellulose I form of bacterial cellulose, and (ii) act
Figure 9: Scheme of the piezoelectric cantilever experimental set up, AFM image of ZnO/bacterial cellulose film and its output voltage (Tsalagkas & Csoka 2013).
Introduction – problem statement
as chemical pretreatment and swelling of bacterial cellulose, to enhance the subsequent ultrasound treatment.
Objective II: Isolation of bacterial cellulose microfibrils
To the best of our knowledge there are not many publications related to the influene of ultrasound operating conditions on bacterial cellulose. Tischer et al. (2010) and Wong et al.
(2009) investigated only the effect of ultrasound time periods on bacterial cellulose morphology and properties. Our purpose was to investigate the effect of two main high intensity ultrasonication parameters, specifically the effect of temperature and distance of ultrasonic probe on defibrillation and crystallinity of previously purified bacterial cellulose samples. Additionaly, it was necessary to select the best set of operating conditions so that maximum cavitation effects could be obtained with minimum possible energy consumption.
Objective III: Preparation of bacterial cellulose films
Piezoelectric effect, defined by the piezoelectric, dielectric and elastic coefficients depends on the piezoelectric properties of the material, the dimensions (especially thicknes) of piezoelectric material films, the type and thickness of electrodes, the size and shape of the cantilever and the direction of electrical and mechanical excitation. Piezoelectric performance of cellulose is influenced on the origin of cellulose source, the degree of crystallinity and the orientation and degree of alignment of cellulose nanoparticles.
The ultimate aim of this thesis was to develop a method for producing flexible, thin, homogenous, highly crystalline, thermodynamically more stable and self-sustaining bacterial cellulose films suitable for energy harvesting applications such as piezoelectric strain sensors.
Orientation and alignment of bacterial cellulose nanofibrils is another challenging research to form ordered films for energy harvesting or optical devices. Cellulose nanofibers alignment could be achieved with microfluidic channels, mechanical wet stretching, convective-shear shelf assembly under electric and/or magnetic field
Introduction – problem statement
techniques, Langmuir-Shaeffer technique or electrospinning technique. In our study, we would like to examine the possibility of self-sustained, oriented films due to ultrasonication treatment and casting evaporation drying method.
Nevertheless, in accordance with the results of this research, the most favourable ultrasound treated bacterial cellulose suspensions is aimed to be approached to the future for further investigation on the preparation of oriented films, with other orientation methods also.
Materials and methods
2. Materials and methods
2.1. Materials
Bacterial cellulose was extracted from a commercially available product, Nata de coco.
Nata de coco gel, as a source of bacterial cellulose was purchased in the form of cubes from local importing food company, distributed by PT. Cocomas Indonesia (Cocomas nata de coco gel in syrup). The ingredients of each package are nata de coco, water, sugar, citric acid, sodium benzoate and aroma flavor.
2.2. Experimental details
2.2.1. Purification of Nata de coco
Nata de coco cubes were washed and soaked in distilled water until the pH was neutral (pH 5-7) to remove the citric acid and other components of syrup added for preservation.
This time of period could require up to 10-15 days, and is so on called as water purification (WP).
In order to improve purity of bacterial cellulose, same amounts of water purified nata de coco (≈ 1 g.) were further purified by alkaline treatment to remove any remaining bacterial cell debris, microorganisms and other soluble polysaccharides. The one step and two step purification methods were conducted by the procedure reported by Gea et al.
(2011). After harvesting, nata de coco cubes were immersed overnight in 2.5 m/m NaOH solution. This process hereafter referred to as one step purification (OSP). Another sample was prepared in the same way and subsequently treated in 2.5 m/m NaOCl solution, further referred as two step purification (TSP). A third sample was prepared by boiling a concentration of 0.5 (w/v%) nata de coco in 0.01 M NaOH at 70 ℃ for 2 h under continuous stirring, called as 0.01 M NaOH purification treatment (NaP).
Afterwards, nata de coco cubes were rinsed under distilled water several times at room temperature, to remove any solvent, until the pH of the water became neutral.
Materials and methods
Once neutral pH was reached bacterial cellulose was mechanically ground in a laboratory blender for a few minutes to be homogenized. Bacterial cellulose suspensions were poured into silicon trays and dried up in the oven at 50 ℃.
2.2.2. Ultrasonication of bacterial cellulose films
Bacterial cellulose films after drying at 50 ℃ were cut. The cut films (0.1 w/v%, immersed in 80 mL distilled water) were redispersed and subjected to further grinding, with a hand blender, prior to ultrasonication. The concentration was estimated as dry weight percent of cellulose films in distilled water. High intensity ultrasonication (HIUS) was directly applied to redispersed bacterial cellulose suspensions. Sonication was achieved at low frequency (20 kHz) using an ultrasonic horn (Tesla 150 WS), having a 18 mm tip diameter dipped in the suspension. Two essential parameters of acoustic cavitation, i.e. temperature (no water-, cold water-, ice water bath) and distance of the ultrasonic probe (4 cm and 1 cm from the bottom of container) were considered to evaluate the effects of ultrasound on bacterial cellulose aqueous suspensions (Figure 10). Maximum power (20 W/cm2), ultrasonication time (30 min) and sample concentration (0.1 % w/v, 80 mL distilled water) were maintained constant.
HIUS power was controlled during the ultrasonication process. A time controller was used in the system to adjust treatment time. A mercury laboratory thermometer was used to record temperatures (℃) during the treatments. A metal arm was used to adjust the distance from the tip of the HIUS probe to the beaker bottom.
2.2.3. Preparation of bacterial cellulose films
Thereafter, the liquid supernatant solutions were collected from treated materials and were poured once more, into silicon trays. After this process, the ultrasonicated bacterial cellulose was reconstituted in the form of thin films after casting evaporation drying at 50
℃ for second time. Due to drying evaporation method, properties of the bacterial cellulose films were independent of direction.
Figure 11 demonstrates a flow process diagram of purifying and obtaining the ultrasound bacterial cellulose films.
Materials and methods
Figure 10: A scheme for HIUS treatment using no water bath (NoW, a), cold water bath (CW, b) and ice water bath cooling (IW, c). Ultrasonic probe was placed close
to the top (4 cm distance) and to the bottom (1 cm distance) of the container.
Figure 11: Block diagram of obtaining the bacterial cellulose films.
Materials and methods
2.3. Bacterial cellulose films characterization techniques 2.3.1. Structural analysis of bacterial cellulose films
The cellulose supermolecular structure, i.e. i) hydrogen bonding network, ii) crystallinity changes and iii) cellulose Iα and Ιβ determination of the samples were evaluated by Fourier Transform Infrared Spectroscopy (FTIR) and X-ray powder diffraction (XRD) techniques.
Fourier Transform Infrared Spectroscopy (FTIR)
FTIR spectra of the bacterial cellulose films were obtained using a Jasco FT/IR6300 equipped with a ATR PRO 470-H spectrometer. A total of 50 cumulative scans were taken per sample with a resolution of 4 cm-1, in the wavenumber range of 4000-400 cm-1, in absorbance mode. ATR correction was applied in each measurement. FTIR spectra absorbance of bands between 4000 and 400 cm-1 were analysed using OriginPro 8 software (OriginLab Corporation) and PeakFit v4.12 (Systat software, Inc).
For a good differentiation of the bands the Savitsky-Golay method (second-order polynomial with fifteen data points) was made using OriginPro8. The second derivative of IR spectra intensifies the apparent resolutions and exposes small differences of spectrum, i.e small differences of the samples (Popescu et al. 2009).
The spectra measurements of the 3800-2750 cm-1 were deconvoluted using Gaussian (PeakFit v4.12.) to calculate and compare the integral absorption bands assigned to –OH region.
The most important absorbance bands assigned to crystalline cellulose I and cellulose II, based on previous published references are shown in Appendix (Table 10). These assignments will be used in the discussion of the results.
The Lateral Order Index (LOI) and Total Crystallinity Index (TCI), proposed by Nelson and O’Connor (1964a,b) and O’Connor (1958) respectively, were used to study the crystallinity changes of cellulose samples (Carrillo et al. 2004).
These infrared ratios, obtained from the 1420/893 (LOI) and 1375/2900 cm-1 (TCI) absorbance ratios, produce different values which represent spectral differences, due to the different structural conformation (Colom & Carrillo 2002).
Materials and methods
The absorbance ratio A1420/A893 was defined as an empirical Crystallinity Index (CrI). It should be noted that this method even though is simple and fast provides only relative Cr.I.
values, owing to the spectrum always contains contributions from both crystalline and amorphous regions (Terinte et al. 2011). The absorbance at 1420 and 894 cm-1 wavenumber are sensitive to the amount of crystalline versus amorphous structure in the cellulose, thus broadening of these bands depicts more disordered structure (Fan et al. 2012). The absorption band at 1430 cm-1 wavenumber is known as the “crystallinity band”, indicates that a decrease in its intensity reflects reduction in the degree of crystallinity of the samples, while the FTIR absorption band at 898 cm-1 wavenumber, is designed as an “amorphous”
absorption band, and an increase in its intensity happens in the amorphous samples, compared to the initial ones (Ciolacu et al. 2011).
As for Total Crystallinity Index (TCI), various reports seem not to show a coherent result (Fan et al. 2012). However, according to Colom & Carrillo (2002) previous studies of substrates with a high crystalline cellulose I content demonstrate that this ratio is useful to follow structural changes during caustic treatments. In combination with Lateral Order Index (LOI), is a good method for reporting crystallinity changes of cellulose treated with sodium hydroxide.
In the structure of cellulose there are three hydroxyl groups that are available forming secondary valence bonds. Thus, the hydrogen bonding network in cellulose is considered as one of the most influential factor on the physical properties and chain structure of cellulose and its derivatives (Kondo 2004). The so-called hydrogen bond intensity (HBI), which compares the ratio of absorption bands at 3336 cm-1 and 1336 cm-1, is closely related to the well ordered crystalline phase and the degree of intermolecular regularity. Lower HBI values means fewer available hydroxyl groups to interact by inter- and/or intramolecular hydrogen bonding (Široký et al. 2010, Kondo 2004).
The energy of the hydrogen bonds or hydrogen bonding energy (EH) for the OH stretching band was calculated using equation (Struszczyk, 1986):
= ( ) (1)
where is standard wavenumber corresponding to free –OH groups (3650 cm-1), the wavenumber of the bonded –OH groups and is a constant equal with 2.625x10² kJ.
Materials and methods
The hydrogen bonding distances (Pimentel & Sederholm, 1956) are obtained by using the Sederholm equation:
Δ ( ) = 4.43 ∗ 10 (2.84 − R) (2)
where Δ = −
is monomeric –OH wavenumber (3600 cm-1), the stretching wavenumber observed in the infrared spectrum of the sample.
On the other hand, the mean strength of the H-bonds (MHBS) was calculated as the ratio of AOH/ACH, where A is the absorbance of the stretching vibration of subscript groups (El-Saied et al. 2008).
X-ray powder diffraction (XRD)
The X-ray diffraction patterns were recorded at room temperature in the 5–80° 2 range using an MPD Pro Panalytical diffractometer equipped with a linear Xcelerator detector.
Cu-K _(1.54056˚A) radiation was used with the 0.016° recording step and the 1000 s per step counting time. The samples have been powdered before the analysis.
X-ray diffractograms were analysed using OriginPro 8 software (OriginLab Corporation) and PeakFit v4.12 (Systat software, Inc).
X-ray diffraction parameters
Crystallinity index (CrI):
X-ray diffraction is a more accurate method to determine the degree of order (i.e.
apparent crystallinity or crystallinity index) since considers more contributions of crystalline regions and less of the less ordered fractions of cellulose, in relation to FTIR spectroscopy (Terinte et al. 2011). However, all XRD measurements allow a qualitative or semi-quantitative estimation of crystallinity index. Lack of appropriate cellulose standards, which are necessary for calibration, is the main bottleneck.
The reflection mode geometry is thought to be more suitable for quantitative determination morphological composition, instead of transmission mode. With reflection mode the absorption factor is constant with angle and also there is less risk that the sample
Materials and methods
is perturbed by pressing. Even more, large air scattering effect to the background of reflection mode diffractogram was almost negligible (Terinte et al. 2011, Thygessen et al.
2005).
There are several methods reported in the literature to calculate the degree of crystallinity from an X-ray diffractogram such as: 1. Peak height method (Segal method), 2.
Ruland-Vonk method (amorphous subtraction method), 3. Hermans-Weidinger method, 4.
Jayme-Knolle method and 5. Peak deconvolution method (curve fitting). Crystallinity index varies significantly depending on the measurement method (Terinte et al. 2011, Park et al.
2010). Each of these methods presents several benefits and drawbacks, based on XRD equipment and preparation of the samples and their simplicity, precision and contribution of cellulose and amorphous regions.
In our investigation crystallinity index was determined by i) peak height and ii) peak deconvolution method. XRD peak height method, developed by Segal and coworkers (1959), determines the crystallinity index by the following equation (Eq.3)
!". # =$% $ $&'
% 1(( (3)
where I200 is the peak intensity at the (200) (2θ ≈ 22.5°) plane, and Iam is the minimum intensity at the valley between (200) and (110) peaks (2θ ≈ 18°). The expression requires that the amorphous material diffracts with the same intensity and that the crystalline cellulose does not contribute to the amorphous intensity peak. Peak height is used for relative estimations of crystallinity between cellulose samples and not for estimating the amount of crystalline and amorphous material within a cellulose sample. Due to its simple and rapid way of application, is preferred from many researchers, although compared to all X-ray diffraction approaches, peak height method gave the highest X-ray crystallinity values.
XRD deconvolution method requires software to separate amorphous and crystalline contributions to the diffraction spectrum using a curve fitting process. An important assumption for this analysis is that increased amorphous contribution is the main contributor to peak broadening. For the curve fitting, a few assumptions have to be made, such as the shape and number of peaks. Gaussian, Lorentzian and Voigt functions are commonly used for deconvolution of XRD spectra. Individual crystalline peaks were extracted by a curve-fitting process from the diffraction intensity profiles (Terinte et al.
2011, Park et al. 2010).
Materials and methods
For our investigation PeakFit v4.12 software AutoFit Peaks III Deconvolution (Spectroscopy, baseline linear D2) was used to calculate the areas of 110 (d1), 110 (d2) and 200 (d3) planes of polymorph cellulose I and a broad area at around 18o to 20.5o assigned to the amorphous contribution. The apparent crystallinity (%) is calculated from the ratio of the area of all crystalline peaks to the total area including non-crystalline fraction following the equation:
!". #. = $ $**+ , $** , $%
**+ , $** , $% , $&' 100 (4)
where Cr.I is apparent crystallinity [%], # + represents the area under the first crystalline peak in the diffraction pattern corresponding to the Miller index 110, # and #- stand for the two areas under the second and deconvoluted crystalline peak corresponding to the Miller index 110 and 200 and #./ is the area under the non-crystalline peak of the cellulose diffraction pattern.
The interplanar distances of the crystallites (d-spacings) could be calculated with Bragg’s law,
0 = 21 234 (5)
where λ is the wavelength of the X-rays (and moving electrons, protons, and neutrons), d is the spacing between the crystal planes in the atomic lattice, and θ is the Bragg angle between the incident ray and the scattering planes (Moosavi-Nasab & Yousefi 2010).
The crystallite sizes at d1, d2 and d3 the three main peaks respectively, were determined using the Scherrer equation (Cheng et al. 2009):
!". 5. = .6 7
89: ;<=>89: (6)
where !". 5. is the crystallite size, λ is the wavelength of incident X-rays, ?@ A is the full- width at half-maximum (FWHM) and @ A is the Bragg angle at the corresponding lattice plane.
2.3.2. Thermal analysis of bacterial cellulose films
Thermal analysis techniques, thermogravimetric analysis (TGA) and differential scanning calorimetry (DSC) were used to measure the thermal stability behavior of bacterial cellulose films. Thermogravimetric (TG) data were acquired between 0 and 500 °C using a
Materials and methods
Perkin Elmer Diamond thermal analyzer under nitrogen purging gas (100 cm3min-1) at a heating rate of 2 K min-1. Differential scanning calorimetry (DSC) analysis was carried out on a Netsch DSC204 instrument under nitrogen purging gas (30 cm3min-1) at a heating/cooling rate of 2 K min-1. Temperature and enthalpy were calibrated using the melting transition of standard materials (Hg, In, Sn).
2.3.3. Morphological analysis of bacterial cellulose films
The topography and morphology of bacterial cellulose oven dried films were images using Atomic Force Microscopy and Field Emission Scanning Electron Microscopy images.
Atomic force microscopy (AFM)
AFM experiments were performed using a MultiMode atomif force microscopy 8 with a Nanoscope Veeco V controller (Bruker Nano Surfaces, Santa Barbara, CA, USA) instrument. Small cut pieces of oven dried bacterial cellulose films were placed on magnetic slides and the scans were obtained in no tapping mode with a V-shape cantilever model.
Prior to the measurements, the tip radius and geometry were calculated. Two repetition of imaging (5x5 µm and 1x1µm) were carried out. These experiments were implemented in an environment with constant relative humidity and temperature.
Width measurements of bacterial cellulose microfibrils were calculated from two different images (1µmx1µm). Width was measured by using ImageJ software (ImageJ 1.46, National Institute of Health (NIH), USA) by image analysis.
Field emission scanning electron microscopy (FE SEM)
FE-SEM micrographs were obtained using a Zeiss ULTRA Plus (Oberkochen, Germany) instrument at an acceleration voltages of 1 and 2 kV. The suspensions were filtered through a gilded PC membrane and dried for 1 h at room temp. All samples were coated with a highly conductive film of gold by Bal-Tec SCD 500.
Materials and methods
In total, for this study twenty eight bacterial cellulose samples were prepared for investigation. There were applied four purification sets, with no ultrasound irradiation as follows: water purification (WP), one step purification (OSP), two step purification (TSP) and 0.01 M NaOH purification (NaP) process. Each purified sample was further subjected to six different ultrasound treatments depending on the temperature [no water bath (NoW), cold water bath (CW), ice water bath (IW)] and the distance of the ultrasonic probe from the bottom of the container (1 cm and 4 cm). From each sample, there were taken three repetitions, during their characterization measurements.
In some cases, the group classification of bacterial cellulose treated samples will be referred in abbreviation way. The explanations of their given abbreviation names are presented in Appendix (Table 11).
Results
3. Results
3.1. Structural analysis
3.1.1. Fourier Transform Infrared (FT-IR) spectroscopy
Fourier Transform infrared (FT-IR) spectroscopy is a successful and useful technique for analyzing the structural, physical and chemical changes taking place in cellulose based polymers consisting of native cellulose (I), regenerated cellulose (II) and/or amorphous cellulose domains (Carrillo et al. 2004). Any alteration of the crystalline organization leads to a transformation of the spectral contour through changes in intensity or even disappearance of the bands characteristic of the crystalline domains and provides us with information on the supermolecular structure of cellulose molecules.
The corroboration of the treatments described previously regarding to purity of native cellulose, as well as the influence of acoustic cavitation, were first evaluated by FT-IR spectroscopy.
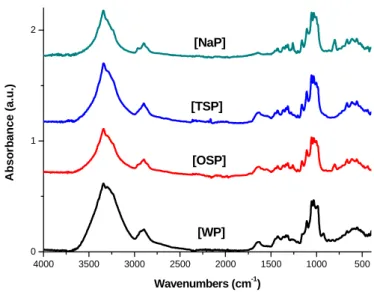
A general view of the infrared spectra of the series of bacterial cellulose treatments in the range of 4000-400 cm-1 are presented in Figures 12-16.
4000 3500 3000 2500 2000 1500 1000 500
0 1 2
[NaP]
[TSP]
[OSP]
[WP]
Absorbance (a.u.)
Wavenumbers (cm-1)
Figure 12: FT-IR spectra in the 4000-400 cm-1 region corresponding to purified and not-ultrasonicated treated samples.
Results
4000 3500 3000 2500 2000 1500 1000 500
0 2
[WP_IW_4cm]
[WP_CW_4cm]
[WP_NoW_4cm]
[WP_IW_1cm]
[WP_CW_1cm]
[WP_NoW_1cm]
[WP]
Absorbance (a.u)
Wavenumbers (cm-1)
4000 3500 3000 2500 2000 1500 1000 500
0 1 2 3
[OSP_IW_4cm]
[OSP_CW_4cm]
[OSP_NoW_4cm]
[OSP_IW_1cm]
[OSP_CW_1cm]
[OSP_NoW_1CM]
Absorbance (a.u)
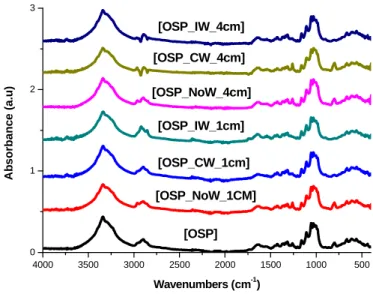
Wavenumbers (cm-1) [OSP]
Figure 13: FT-IR spectra in the 4000-400 cm-1 region corresponding to water purified and ultrasound treated samples.
Figure 14: FT-IR spectra in the 4000-400 cm-1 region corresponding to one step purified and ultrasound treated samples.