Ph.D. Dissertation
University of Sopron (Soproni Egyetem) Simonyi Károly Faculty of Engineering,
Wood Sciences and Applied Arts
The Cziráki József Doctoral School of Wood Sciences and Technologies
Bacterial cellulose-Silk fibroin-Polyvinyl alcohol- Silver nanocubes for flexible and transparent organic
light-emitting diode display
Author: WORAKAN HOSAKUN
Research Supervisor: Prof. Dr. LEVENTE CSÓKA DSc.
Sopron
2018
transparent organic light-emitting diode display Értekezés doktori (PhD) fokozat elnyerése érdekében
a Soproni Egyetem Cziráki József Faanyagtudomány és Technológiák Doktori Iskolája Rosttechnikai és nanotechnológiai tudományok programja
Írta:
WORAKAN HOSAKUN
Készült a Soproni Egyetem Cziráki József Faanyagtudomány és Technológiák Doktori Iskola Rosttechnikai és nanotechnológiai tudományok programja keretében
Témavezető: Prof. Dr. Csóka Levente DSc.
Elfogadásra javaslom (igen / nem)
(aláírás)
A jelölt a doktori szigorlaton …...93... % -ot ért el,
Sopron, 2018.06.07.
………...
a Szigorlati Bizottság elnöke
Az értekezést bírálóként elfogadásra javaslom (igen /nem)
Első bíráló (Dr. …... …...) igen /nem
(aláírás) Második bíráló (Dr. …... …...) igen /nem
(aláírás) (Esetleg harmadik bíráló (Dr. …... …...) igen /nem
(aláírás)
A jelölt az értekezés nyilvános vitáján…...% - ot ért el
Sopron,
………..
a Bírálóbizottság elnöke
A doktori (PhD) oklevél minősítése…...
………..
Az EDHT elnöke
This is to certify that I, the undersigned Worakan Hosakun, hereby declare that this Ph.D. thesis entitled Bacterial cellulose-Silk fibroin-Polyvinyl alcohol-Silver nanocubes for flexible and transparent organic light-emitting diode display was carried out by me for the degree of Doctor of Philosophy in English under the guidance and supervision of Prof. Dr. Levente Csóka, Institute of Wood Based Products and Technologies, University of Sopron. This entire material belonging to my PhD dissertation, which now I submit for assessment, is entirely my own work except where due reference has been made in the text.
Sopron, December 7th, 2018
…….……….………
Worakan Hosakun
Abstract
Transparent, light in weight, and flexible displays for organic light-emitting diode substrate (OLED) were studied. In this work, bacterial cellulose (BC), silk fibroin protein (SF), and/or polyvinyl alcohol (PVA) were chosen as raw materials. These materials are environmentally friendly and has biodegradability in order to decrease electronic wastes (e-waste). The BC-PVA, SF-PVA, pristine PVA, BC-SF, and BC- SF-PVA films obtained were further modified by impregnation with silver nanocubes (AgNC). Therefore, ten samples were achieved (S1 to S10), characterized by UV-vis, x-ray diffraction analysis (XRD), field emission scanning electron microscope (FESEM), attenuated total reflectance fourier transform infrared (ATR–FTIR) spectroscopy, differential scanning calorimetry (DSC), thermogravimetric analysis (TGA), tensile tester, dynamic mechanical analysis (DMA), and complex conductivity (conductance) and comparison of properties to the standard requirements of OLED display. The influences of the PVA and AgNC were also investigated. It was found that the transparency of the films significantly increased due to the presence of PVA polymer. In addition, PVA can better penetrate to the BC-SF fibrils than SF-PVA (S2) blended film because the inferior interaction between SF and PVA polymer occurs from PVA crystallization or the aggregation of SF molecular chains. AgNC was impregnated in the films and it was observed that PVA was a good dispersant confirmed bybetter uniform distribution and no aggregation of AgNC in PVA-AgNC film (S6), and BC-SF-PVA-AgNC film (S7) compared to SF-PVA-AgNC (S5) film.
According to XRD results, it shows that the nanosilk was in amorphous state. In the case of ATR-FTIR analysis, the remarkable spectra was found at 3285 cm-1 that is corresponding to the BC stretching vibrations of inter-hydrogen bonding. This is owing to an improvement of the intermolecular H-bonds between OH groups of BC cellulose and NH in the amide groups of SF, in contrast with a decrease in intramolecular H-bonds of cellulose. However, AgNC did not affect the native structure of the films. In the case of DSC analysis, glass transition temperature (Tg) of all samples are showed the single temperature. The addition of BC (S1) increased the Tg of pure PVA, the hydrophilic character of both the BC and PVA, they are extremely miscible and thus the formation of strong hydrogen bond between the BC
and PVA matrix. Similar to S2, it presented high thermal stability which might be ascribed to the high crystallinity. Obviously, the glass transition peak of S7 was unrecognizable, only the endothermic peak appeared at 166.67°C due to the highly crosslinked structure of the substances. The thermal degradation behaviour from TGA and DTG curves showed that the samples which contained bacterial cellulose (S1, S4, and S7) initiate to degrade before 206°C for the main weight loss.The increasing in thermal stability was observed with the presence of the silver nanocubes in the BC, SF, and PVA films (S4, S5, S6, and S7). Dynamic mechanical analysis (DMA) indicated that the silver nanocubes affect the BC-SF and BC-SF-PVA films in a different way.This is probably a consequence of the reduced chain mobility of the SF chains induced by nanocubes. S7 film when studied the viscoelastic properties at elevated temperature showed very sensitive to the presence of light during the DMA experiment. The storage (E′) and loss (E″) shear moduli curves of S7 film recorded in the dark and under illumination with white light are strongly related to the presence of silver nanocubes. The illumination probably induces similar effects in BC fibrils i.e. a rise in dipole moments, which are obviously amplified in the presence of silver nanocubes. These effects might not be significant below the glass transition temperature. However, above the glass transition, the mobility of the matrix chains is much higher and the photo-illumination effects may contribute to the shear forces induced by external periodic loading. For this reason, there is a strong influence of light on the position and intensity of the high-temperature relaxation transition in S7 sample. In the case of conductivity measurement, at the beginning of the test, the sample was kept in the dark and the white light was applied in the time interval from 47 to 67 s. It can be mentioned that PVA containing films are more sensitive to illumination. Obviously, photo-generation of the electrons does not depend solely of the presence of more conductive silver nanocubes.Flexible and transparent film for OLED display was successfully fabricated by using natural materials which are BC, SF and PVA modified with AgNC owing to high thermal stability, mechanical strength, and electrical conductivity.
Table of contents
Chapter Page
Chapter I Introduction and Problem statement………...15
1.1 Organic light-emitting diode (OLED) display………....15
1.1.1Working principle of OLED device……….…16
1.1.2 Types of OLED………....17
1.2 Cellulose……….…………20
1.2.1 Bacterial cellulose (BC)………...21
1.2.2 Bacterial cellulose production………..…23
1.3 Silk fibroin protein………..25
1.3.1 Structure of silkworm cocoons………...26
1.3.2 Silk fibroin Properties………..28
1.4 Polyvinyl alcohol polymer (PVA)………..29
1.5Cellulose and silk fibroin for flexible electronic substrate……….31
1.6Conductive materials for OLED device………..31
1.7 Problem statement………...34
Chapter II Materials and Methods………...36
2.1 Raw materials and chemicals………...36
2.2 Experimental details………...……….36
2.2.1 Purification of Nata de coco and preparation of dried microfibrillated and nanocrystalline bacterial cellulose films……….………..36 2.2.2 Degumming of silk cocoons and preparation of nano-silk fibroin films.37
2.2.3 Preparation of polyvinyl alcohol solution………38
2.2.4 Synthesis of silver nanocubes (AgNC)………38
2.2.5 Fabrication of dried sample films by evaporation drying technique…...39
2.3 Characterization methods used for testing the samples……….…….40
2.3.1 Ultraviolet-visible (UV-VIS) spectroscopy……….40
2.3.2 X-Ray Diffraction Analysis (XRD)……….41
2.3.3 Morphological analysis of the nanocomposite films by FE-SEM microscopy………41
2.3.4ATR-FTIR spectroscopy………...42
2.3.5Differential Scanning Calorimetry (DSC)………...42
2.3.6Thermogravimetric Analysis (TGA)………43
2.3.7 Tensile tests of sample films………..………..44
2.3.8 Dynamic mechanical analysis (DMA)………...44
2.3.9 Complex conductivity (Conductance)……….44
Chapter III Results and Discussions……….……46
3.1 The effect of acid hydrolysis on BC and SF fibres……….46
3.2 Film characteristics………...47
3.2.1 Optical transmittance………...50
3.2.2 Transparent and flexible electronic display standard………...51
3.3 Field Emission Scanning Electron Microscope analysis (FESEM)………52
3.4 Angle Dispersive X-ray Diffraction (ADXRD)………..54
3.5 Attenuated total reflectance Fourier transform infrared spectroscopy…………...56
3.6 Differential Scanning Calorimetry (DSC)………...58
3.7 The thermogravimetric and derivative thermogravimetric analyses …………...60
3.8 Tensile strength………...65
3.9 Dynamic mechanical analysis (DMA)………66
3.10 Complex conductivity (Conductance)………..72
Chapter IV Conclusions……….74
Chapter V References……….80
List of Figures
Figure Page
Figure 1.1 The evolution of television panels and constituting parts of LCD/LED vs
OLED TV………...16
Figure 1.2 A typical OLED parts and a basic small molecule organic light-emitting diode (SM-OLED) device structure………..16
Figure 1.3 PMOLED structure………..18
Figure 1.4 AMOLED structure………...18
Figure 1.5 Transparent OLED structure………...19
Figure 1.6 Top-emitting OLED structure………...19
Figure 1.7 Hierarchical structures of wood………...21
Figure 1.8 The model of BC microfibrils versus the fringed micelles of plant cellulose fibrils……….22
Figure 1.9 Production of cellulose microfibrils by Acetobacter xylinum…………....25
Figure 1.10 Life cycle of silkworm ………..26
Figure 1.11 Constituent of raw silk, 2D schematic of the silk fibroin heavy chain and light chain, FTIR spectrum of silk fibroin thin film deposited on ITO/glass, and molecular structure of SF. The silk fibroin consists of turn (T), random coil (R), β - sheet, and side chain; according to the curve-fitting results………28
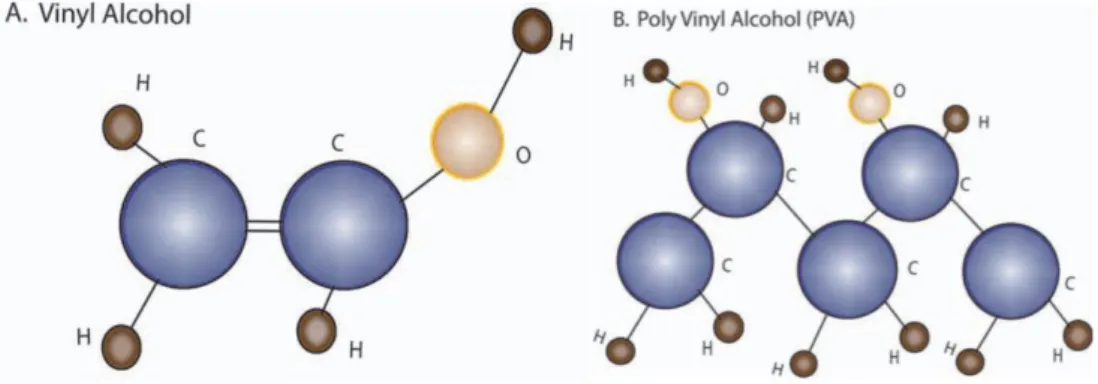
Figure 1.12 The structure of vinyl alcohol and PVA synthesized by the hydrolysis of polyvinyl acetate……….…..30
Figure 1.13 DSC thermograms of neat PVA film………...30
Figure 2.1 Raw Nata de coco and Bombyx mori silk cocoons……….36
Figure 2.2 Purification of Nata de coco and purified BC……….37
Figure 2.3 Hydrolyzed and degummed SF………...38 Figure 2.4 Silver nanocubes synthesized by polyol process………..………...39 Figure 2.5 Samples preparation, sputter coating, and FESEM instrument…………...42 Figure 2.6 DSC instrument and aluminum sample pans covered with the lids………43 Figure 2.7 TGA instrument and reference and sample pans were on a sensitive microbalance……….44 Figure 2.8 Photo of the home-made cell used in photo-electrical characterizations of the films………45 Figure 3.1 Mechanism of acid hydrolysis of cellulose fibres………...46 Figure 3.2 Optical images of transparent films of BC-PVA (S1), SF-PVA (S2), PVA (S3), BC-PVA-AgNC (S4), SF-PVA-AgNC (S5), PVA-AgNC (S6), BC-SF-PVA- AgNC (S7), BC-SF (S8), BC-SF-AgNC (S9), and BC-SF-PVA (S10) placed on a bookcover………..48 Figure 3.3 Scattering regimes between wavelength (x-axis) vs particle size (y-axis)..49 Figure 3.4 Transmittance versus wavelength graph for Polyethylene (PE), SF-PVA (S2), PVA (S3), SF-PVA-AgNC (S5), and PVA-AgNC (S6) substrates……….50 Figure 3.5 FESEM images of BC-SF-PVA-AgNC (S7), SF-PVA (S2), and pure PVA film (S3)………53 Figure 3.6 FESEM images of the distribution of silver nanocubes embedded in SF- PVA film (S5), the size of the isolated silver nanocubes, PVA-AgNC film (S6), and BC-SF-PVA-AgNC film (S7), the yellow points indicate the AgNC……….….54 Figure 3.7 Diffraction peaks of nanosilk………..55 Figure 3.8 FT-IR spectra of BC-SF-PVA-AgNC (S7), BC-SF (S8), BC-SF-AgNC (S9), and BC-SF-PVA (S10) films………...56
Figure 3.9 DSC second heating curves of BC-PVA (S1), SF-PVA (S2), pure PVA (S3), BC-PVA-AgNC (S4), SF-PVA-AgNC (S5), PVA-AgNC (S6), and BC-SF-PVA- AgNC (S7) at heating rate of 10 K/min……….…...59 Figure 3.10 TGA and DTG curves of (S1) BC-PVA, (S2) SF-PVA, (S3) pure PVA, (S4) BC-PVA-Ag, (S5) SF-PVA-Ag, (S6) PVA-Ag, and (S7) BC-SF-PVA-Ag..…..61 Figure 3.11 Main chain of PVA reactions under heating……….…64 Figure 3.12 Stress vs Strain curves of BC-SF-PVA-AgNC (S7), BC-SF (S8), BC-SF- AgNC (S9), and BC-SF-PVA (S10) films………....65 Figure 3.13 Storage and loss shear moduli of the films as a function of temperature. a) BC-SF (S8) and BC-SF-AgNC (S9) samples, b) BC-SF-PVA-AgNC (S7) and BC-SF- PVA (S10) samples. The measurements were carried out under the white light illumination………..….67 Figure 3.14 Storage and loss shear moduli of the BC-SF-PVA-AgNC (S7) film recorded in dark and under the white light illumination. The frequency of the external force was 1 Hz………..……68 Figure 3.15 Storage modulus (E′) and dynamic loss tangent (tan δ) at different frequencies (a and b) of basic BC and BC-SF films………..…...71 Figure 3.16 Specific conductance (G) and susceptance (B) of BC-SF-PVA-AgNC (S7), BC-SF (S8), BC-SF-AgNC (S9), and BC-SF-PVA (S10) films at 22 kHz as a function time. The samples were illuminated in the period from 47 to 67 s, which is indicated by vertical lines……….…………72
List of Tables
Table Page
Table 1.1 Level of Bacterial cellulose structure………...……23
Table 1.2 Mechanical properties of silkworm silk and other natural and synthetic fibrous materials………...….29
Table 1.3 The main criteria of a transparent electrode with expected performance for some applications. Plus signs indicate better values……….……32
Table 1.4 Regular information according to fabrication methods for transparent conductive material electrode………...……33
Table 2.1 Component of each sample………...40
Table 2.2 Initial weight of DSC and TGA analysis………..41
Table 2.3 The samples characterization………42
Table 3.1 Types and properties of flexible displays……….51
Table 3.2 Spectral characteristics at various wavelengths for BC-SF-PVA-AgNC (S7), BC-SF (S8), BC-SF-AgNC (S9), and BC-SF-PVA (S10) films……….….57
Table 3.3 Differential Scanning Calorimetry Results of seven samples………….….59
Table 3.4 Degradation temperatures of S1, S2, S3, S4, S5, S6, and S7 determined by TGA and DTG results……….…..62
Table 3.5 Mechanical strength of BC-SF, BC-SF-AgNC, BC-SF-PVA, and BC-SF- PVA-AgNC films……….66
Table 3.6 Relative changes of specific conductance (∆G) and susceptance (∆B) of the films induced by illumination. Sample 7: BC-SF-PVA-AgNC, Sample 8: BC-SF, Sample 9: BC-SF-AgNC, Sample 10: BC-SF-PVA……….……73
List of Abbreviations
Ala Alanine
AMOLED Active-matrix organic light-emitting diode
ATR-FTIR Attenuated total reflectance Fourier transform infrared
BC Bacterial cellulose
BC-PVA Bacterial cellulose embedded in polyvinyl alcohol BC-PVA-AgNC Bacterial cellulose embedded in polyvinyl alcohol and
silver nanocubes
BC-SF Bacterial cellulose embedded in silk fibroin
BC-SF-AgNC Bacterial cellulose embedded in silk fibroin and silver nanocubes
BC-SF-PVA Bacterial cellulose embedded in silk fibroin and polyvinyl alcohol
BC-SF-PVA-AgNC Bacterial cellulose embedded in silk fibroin, polyvinyl alcohol and silver nanocubes
CTE Coefficient of thermal expansion
DMA Dynamic mechanical analysis
DSC Differential Scanning Calorimetry
Gly Glycine
FESEM Field Emission Scanning Electron Microscope FOLED Foldable organic light-emitting diode
ITO Indium tin oxide
OLED Organic light-emitting diode
PMOLED Passive-matrix organic light-emitting diode PVA-AgNC Polyvinyl alcohol embedded in silver nanocubes
Ser Serine
SF-PVA Silk fibroin embedded in polyvinyl alcohol
SF-PVA-AgNC Silk fibroin embedded in polyvinyl alcohol and silver nanocubes
TGA Thermogravimetric analysis
TOLED Transparent organic light-emitting diode
XRD X-ray Diffraction
CHAPTER I
INTRODUCTION AND PROBLEM STATEMENT
1.1 Organic light-emitting diode (OLED) display
In recent years, the development of flexible display has been taken place a flat panel for using in electronic devices, i.e. smartwatch, smartphone, and television panel. Figure 1.1a shows the evolution of television panels, development from cathode ray tube (CRT), plasma display panel (PDP), liquid crystal display (LCD), and liquid crystal display/light-emitting diode (LCD/LED), and organic light-emitting diode (OLED) TV screen. The distinction between LCD/LED and OLED can be described by Figure 1.1b. OLED is extremely thinner, with lighter, good viewing angle, and consumes less energy than LCD/LED. Therefore, one of the outstanding substrate is OLED which is the device made of organic semiconductor film. The backlight is not required and presents extremely thin screen, reduces the weight and greatly provides individual pixels that switch off for perfect black as the superior characteristics of OLED TV display. However, OLED technology is used mostly in phones nowadays. It is strongly becoming more prevalent, with over 400 million AMOLED screens manufactured in 2017 and continues growing in the market.
Nowadays the smartphones are launching the new models to replace the obsolete devices every year, raise electronic wastes (e-waste) after a few short years of the consumers use. The out-of-date electronic wastes are rapidly filling the landfill sites of the globe. As such, the concerning for handling of e-waste issue is also an interesting topic. In this work, biodegradable materials were used for solving this e-waste problem. Generally, the producers use glass or plastic for fabricating display application. There are also polymer blends as one of the most capable methods to have new material with required properties. Therefore, bacterial cellulose (BC), silk fibroin protein (SF), and polyvinyl alcohol polymer (PVA) were studied in this work. First, each materials’ characteristics and properties were explained. After that, the blended composites displays were reviewed.
Figure 1.1 The evolution of television panels (a) and constituting parts of LCD/LED vs OLED TV (b). (“IFA 2015 Directions for LG Electronics’ OLED TV?”,2015; “What makes it the best TV
ever”)
1.1.1 Working principle of OLED device
Six different layers of a simple OLED was depicted in Figure 1.2a. The top layer is sealed, the bottom layer is a substrate, followed by the anode (a positive terminal) and cathode (a negative terminal). The emissive layer, where the light is produced, and conductive layers are in between those layers.
Figure 1.2A typical OLED parts (a) and a basic small molecule organic light-emitting diode (SM- OLED) device structure (b). (“What is OLED and how does it work”, 2016;“OLEDs - Organic
Light Emitting Diodes”, 2004)
Organic molecules were used to produce their electrons and holes. According to Figure 1.2b, when voltage is applied for making the OLED light up, the cathode starts receiving electrons and the anode begins losing them. The emissive layer changes to negatively charged and in contrast, the conductive layer becomes positively charged.
The positive holes are more mobile than electrons, they cross the boundary from the conductive layer to the emissive layer. When a hole meets a negative electron, it occurred a rapid brief burst of energy in the form of photon. The OLED device produces continuous light in the process for as long as the power is on.
1.1.2 Types of OLED
Six types of OLED were distinguished: Passive and active matrix, transparent, top-emitting, foldable, and white OLED (Chen et al., 2003, Karzazi, 2014 and Kunić
& Šego, 2012).
- Passive-matrix OLED (PMOLED)
The structure of PMOLED comprises of organic layers and strips of cathode positioned perpendicular to the anode strips (Figure 1.3). The layer where the pixels are generated is the intersection between anode and cathode. The brightness of each pixel depends on the proportional of the applied current amount. The turn on and off of the pixels rely on the applied external circuit to selected strips of anode and cathode. The advantages of PMOLED are easy and cheap to fabricate, and consume less power than an LCD and LED. On the other hand, PMOLED displays are usually small (up to 3 inches) and are used to display character data or small icons because of restriction in resolution and size: they are being used in MP3 players, mobile phone sub displays, etc. (Karzazi, 2014).
Figure 1.3 PMOLED structure (Kunić & Šego, 2012)
- Active-matrix OLED (AMOLED)
The AMOLED structure differs from PMOLED (Figure 1.4). It has full sheets of cathode, organic active layers and anode. In case of switching each pixel to turn on or off, a thin film transistor (TFT) plane in parallel to an anode is formed a matrix.
Therefore, the display will show the black image whenever the pixels switch off which means that this can increase the battery life of the device. This OLED type is the least power consuming among others. The AMOLEDs are used for computer screens, large-screen TVs and electronic signs or billboards (Karzazi, 2014).
Figure 1.4 AMOLED structure(Kunić & Šego, 2012)
- Transparent OLED
The structure of transparent OLEDs (TOLEDs) has only transparent parts which are substrate, cathode and anode layers (Figure 1.5).
Figure 1.5 Transparent OLED structure (Kunić & Šego, 2012)
TOLED can be categorized into both the active and passive matrix OLED.
According to all transparent components, light can pass to both directions when the display switches on. Thus, TOLED can produce screens that are top as well as bottom emitting. One advantage is it good contrast even in bright sunlight. The applications for TOLED are in head-up displays, laptops, mobile phones and smart windows (Karzazi, 2014).
- Top-emitting OLED
OLEDs that emit light from the top surface of devices refer to top-emitting OLED (Figure 1.6).
Figure 1.6 Top-emitting OLED structure (Kunić & Šego, 2012)
The substrate for top-emitting OLEDs can be both opaque and reflectivee.g. a metal foil or silicon wafers. Top-emitting OLEDs are proper for pixel circuits in
active-matrix OLED since they can be more easily integrated with a non-transparent transistor backplane and can give higher display quality. Producers use this top- emitting OLED display in smart cards application (Karzazi, 2014 and Chen et al., 2003).
- Foldable OLED
Substrates for foldable OLEDs (FOLEDs) made of very flexible metallic foils or even plastics. The properties of FOLEDs are flexible, lightweight and durable. This type is mainly used in GPS devices, mobile phones, smart clothing, and large curved screen TVs. FOLEDs have rapid response time and high contrast images for television (Karzazi, 2014).
- White OLED
The last type of OLED is white OLEDs. This large sheet is cost-effective and also consumes less power than fluorescent lamps. The qualities of white OLEDs are creating the true-color of lighting and emit bright white light. It is used for car lighting because it can display very deep black as well as light and also very thin and lightweight (Karzazi, 2014).
1.2 Cellulose
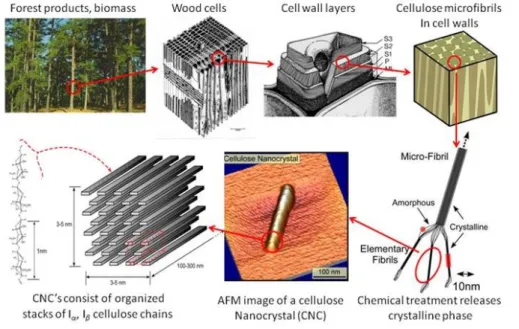
The source of abundant and relatively cheap carbohydrate polymer – cellulose normally extracted from plants or their biomass. Cellulose is a polysaccharide derived from β-D-glucopyranose units comprising of a straight chain polymer where no branching presents with containing hundreds to above ten thousands linked D-glucose units by β(1→4)-glycosidic linkages and is an organic compound with a chemical formula of (C6H10O5)n. The microfibrils with high tensile strength were formed by the hydroxyl groups connected with oxygen atoms on the same chain or a neighbour chain of glucose, carrying the chains strongly together. Finally, cellulose microfibrils are meshed and become a cell wall as depicted in Figure 1.7, generating the high tensile
strength. Cellulose has several crystalline structures based on the location of hydrogen bonds, resulted in a complicated organization (cellulose I, II, III, and IV structures).
Cellulose I is the natural or native cellulose. It comprises of rod-like crystalline microfibrils with the different structure Iα and Iβ. Bacteria and algae can produce cellulose Iα whileIβ was mainly found in cellulose in high plants. Cellulose II comes from regenerated cellulose fibres which is more stable allomorph. With different kinds of chemical treatments, cellulose III and cellulose IV were produced from cellulose I.
The properties of cellulose are odorless, hydrophilic, insoluble in water and most organic solvents, and biodegradable (Li, Y, 2014). According to these great characteristics, demand on derivatives of plant cellulose is increasing and had increased wood consumption as raw material. It caused deforestation and global environmental problem.
Figure 1.7 Hierarchical structures of wood (“Size Scale of Cellulose-based Particles”)
1.2.1 Bacterial cellulose (BC)
In spite of the fact that plant is the major contributor of cellulose, many bacteria are also able to produce cellulose. Bacterial cellulose is an extracellular product made by some bacteria belonging to the genera Acetobacter, Rhizobium, Agrobacterium, Aerobacter, Achromobacter, Azotobacter, Salmonella, Escherichia, and Sarcina were
first reported by Brown in 1988 (Sulaeva, Henniges, Rosenau, & Potthast, 2015). It was first served as a diet food in Asia and also as a traditional dessert in Philippines called nata de coco (Foresti, Vázquez, & Boury, 2017). Many researches on BC indicated that it is chemically similar to plant cellulose, but its macromolecular structure and properties are unlike the latter, exhibited in Figure 1.8. Subfibrils were formed by aggregation of nascent chains of BC. Then, they were crystallized into microfibrils, these into bundles, and finally the latter into ribbons (“Bacterial cellulose”). As shown in Table 1.1, the structure levels of BC are also presented. The BC structure has abundant surface of hydroxyl groups that describing it as hydrophilic, biodegradable, and chemical-modifying capacity. According to its unique properties, BC has gained much attention in the field of material science and biomedical applications such as wound dressing and blood vessel regeneration (Foresti, Vázquez, & Boury, 2017).
Figure 1.8 The model of BC microfibrils (right) versus the fringed micelles of plant cellulose fibrils (left) (“Bacterial cellulose”)
Table 1.1 Level of Bacterial cellulose structure
Overview of BC structural organization References 3-dimensional
network structure
(Y Hosakun, Halász, Horváth, Csóka, &
Djoković, 2017)
Microfibril bundle to microfibrils
(Sulaeva, Henniges, Rosenau, &
Potthast, 2015)
Polymer chain (Foresti,
Vázquez, &
Boury, 2017)
Monomer unit (Sulaeva,
Henniges, Rosenau, &
Potthast, 2015)
1.2.2 Bacterial cellulose production
In this work, bacterial cellulose from Acetobacter species was used. This cellulose production was initially discovered by A.J. Brown in 1886. He investigated that in the presence of oxygen and glucose, the resting cells of Acetobacter were produced cellulose (Chawla, Bajaj, Survase, & S. Singhal, 2009).
Bacterial cellulose which can be produced in different forms is fermented under static, agitated, or even stirred conditions. The static condition produces three- dimensional interconnected reticular pellicle. On the other hand, irregular shape sphere-like cellulose particle is formed by agitating and stirring conditions. The production of cellulose under static condition has to supply by air from medium surface and the concentration of the carbon source effect the yield also. However, the
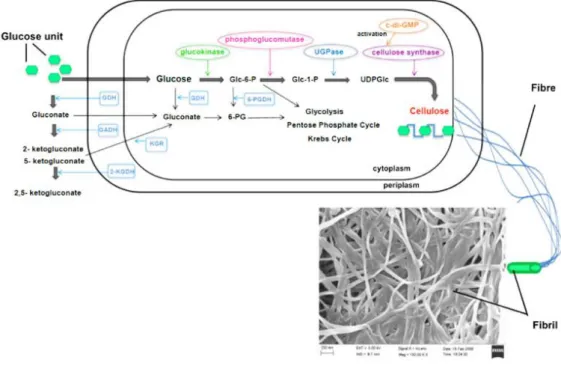
formation of BC with hydrogen and C-H bonding will increase by the increasing of growth time. Bacteria turn into inactive because of insufficient oxygen source. The pellicles will growth downward when the process reaches its limit and all bacteria are entrapped. In order to producing cellulose from bacteria (Figure 1.9), possibility of operation present in the pentose-phosphate cycle or the Krebs cycle, relying on the physiological state of the cell coupled with gluconeogenesis (K.-Y. Lee, Buldum, Mantalaris, & Bismarck, 2014). The oxidation of carbohydrates referred to the pentose-phosphate cycle, on the other hand, the Krebs cycle associates with the oxidation of acetate-derived carbohydrates, fat, and proteins. Individual enzymes, catalytic complexes, and regulatory proteins are all involved in the biosynthesis of cellulose which contains four key enzymatic steps when carbon source is glucose.
Phosphorylation of glucose by glucokinase comes first, followed by isomerization of glucose-6-phosphate (Glc-6-P) to glucose-1-phosphate (Glc-1-P) by phosphoglucomutase, after that synthesis of UDPglucose (UDPGlc), which is common in many organisms and the direct cellulose precursor, by UDPG- pyrophosphorylase (UGPase), and finally, cellulose synthase reaction. Two processes of synthesized cellulose are in microorganisms. 1,4-β-glucan chains formation and the assembly and crystallization of cellulose chains. The cellulose molecules are started to synthesize inside the bacteria. Then, these moleculesare formed protofibrils by spun through cellulose export components. These protofibrils are then formed a ribbon shaped microfibril. The glucose unit is catalyzed by cellulose synthase and become into the 1,4-β-glucan chains (K.-Y. Lee, Buldum, Mantalaris, & Bismarck, 2014).
Figure 1.9 Production of cellulose microfibrils by Acetobacter xylinum (K.-Y. Lee, Buldum, Mantalaris, & Bismarck, 2014)
The alkaline treatment of BC pellicles for purification of BC fibrils has been described (Tsalagkas, 2015 and Santos et al., 2015). Most of non-cellulosic materials, proteins and nucleic acids, and other impurities were eradicated by cell lysis (breaking down of the cell) and chemical bond breakage from alkali treatment to achieve pure BC. Sodium hydroxide (NaOH) in large amounts can solubilize amorphous cellulose which enhances the material crystallinity, purity, and viscosity. Therefore, the crystalline cellulose was formed (Santos et al., 2015). Generally, the common procedure of this treatment use 0.1 M NaOH solution with warm conditions because alkali can well penetrate into the fibrils than at the ambient conditions (Tsalagkas, 2015).
1.3 Silk fibroin protein
Silk fibroin (SF) is a fibroin protein-based polymer which is produced by spiders, silkworms, scorpions, mites, and flies (Melke, Midha, Ghosh, Ito, &
Hofmann, 2016 and Shang, Zhu, & Fan, 2013). Normally, Bombyx mori silk cocoons are mainly consisted of 72–81% of a fibrous protein fibroin core and a surrounding
19–28% sericin protein. Silk fibroin protein has discovered for various applications such as tissue engineering or other biomedical applications because of its high tensile strength, biocompatibility, biodegradability, and non-cytotoxicity (Acharya, Ghosh, &
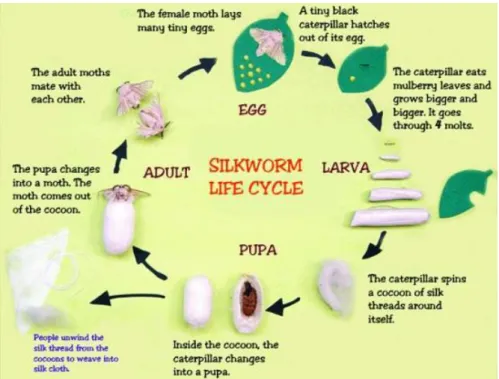
Kundu, 2008). In this work, Bombyx mori silkworm cocoons were used. Generally, the total life-cycle of silkworm ranges from 6-8 weeks. As shown in this Figure 1.10, in brief, tiny eggs hatch out into a tiny black caterpillar. Then, it eats mulberry leaves and goes through four molts. The caterpillar spins a cocoon of silk threads around itself. Starting the pupa state, the caterpillar changes itself inside the cocoon. The silk treads from the cocoon are used in manufacture to produce many products. Hundreds of milligrams of silk proteins were produced from one larva to make a robust cocoon (Teramoto & Kojima, 2014).
Figure 1.10 Life cycle of silkworm (“Silk”, 2016)
1.3.1 Structure of silkworm cocoons
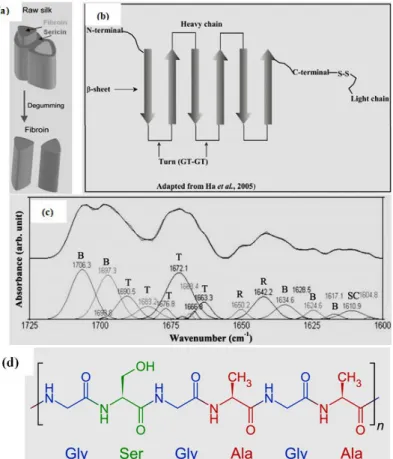
The raw silk comprises of silk fibroin protein covered with sericin protein on their surfaces as presented in the Figure 1.11a (Koh et al., 2015). Sericin protein consist of different polypeptides (weight of 24 to 400 kDa), on the surface of cocoon.
They are identified by eccentric 40% of serine content together with 16% of glycine
(Kundu, Dash, Dash, & Kaplan, 2008). Normally, sericin has five types of polypeptides, s-1, s-2, s-3, s-4, and s-5. They have been reported from different parts of the middle silk gland (MSG) and s-1, s-2, and s-3 are the main components. Serine, glycine, and aspartic acid were observed in the polypeptides. Some researchers reviewed the applications of sericin as skin care for anti-wrinkle, anti-aging effect, moisturizing, conditioning, and cleansing properties etc. (Kundu, Dash, Dash, &
Kaplan, 2008 and J. H. Lee, Song, Park, & Um, 2016). In case of amino acid constituent of silk fibroin primarily consists of glycine (G), alanine (A), and serine (S) in the molar ratio of 3:2:1. Figure 1.11b displays silk fibroin basic structure. Silk fibroin composes of a light chain (~25 kDa) and a heavy chain (~390 kDa) in the ratio 1:1 connected by a single disulphide bond. The alignment of silk fibroin along the fiber axis linked together by the network of hydrogen bonds interchain could form β- sheet structures. In Figure 1.11c, Hota et al., 2012 studied to produce the biomaterial for bio-memristor devices from silk fibroin protein. From the infrared absorption spectra of static amide I region, they found that the observed spectrum comes from the secondary structure of SF. Fourier deconvolution method was considered to obtain more information. β-sheets structures (B), turn structures (T), alpha-helix (A), random coil (R), and side chains (SC) were found.It can be concluded that SF film presented amorphous structure.
Figure 1.11 Constituent of raw silk (a), 2D schematic of the silk fibroin heavy chain and light chain (b), FTIR spectrum of silk fibroin thin film deposited on ITO/glass (c), and molecular structure of SF (d). The silk fibroin consists of turn (T), random coil (R), β -sheet, and side chain;
according to the curve-fitting results (Hota, Bera, Kundu, Kundu, & Maiti, 2012, Ha, Gracz, Tonelli, & Hudson, 2005, and “Unit - Chemistry of Garments: Animal Fibres”, 2016)
In order to separate fibroin from sericin (silk gum), a conventional process known as degumming is considered. Raw silkworm cocoons were degummed by thermo-chemical treatment, resulting in the changes in microstructure of fibroin and mechanical properties (Jiang et al., 2006). In general raw silk may be degummed by submerging the cocoon in boiling water, sometimes with detergent or salt to improve the treatment efficiency. The sericin which is eliminated will be in the liquor’s suspension.
1.3.2 Silk fibroin Properties
According to Table 1.2, the mechanical properties of silkworm and some other fibrous material were presented. Both breaking strain and toughness of silk fibroin fibre has higher values than Kevlar. Besides, Wu et al., 2009 claimed that the mechanical properties of silk are closely correlated with its hierarchical structures.
Table 1.2 Mechanical properties of silkworm silk and other natural and synthetic fibrous materials (Koh et al., 2015)
Materials Young’s
modulus (GPa)
Ultimate strength (MPa)
Breaking strain (%)
Toughness (MJ m-3) Silkworm silk fibroin
(Bombyx mori)
10-17 300-740 4-26 70-78
β-sheet crystallites (Bombyx mori)
16-18 n/a n/a n/a
Spider silk (Nephila clavipes)
10.9 875 16.7 n/a
Nylon 1.8-5 430-950 18 80
Kevlar 130 3600 2.7 50
Wool 0.5 200 50 60
1.4 Polyvinyl alcohol polymer (PVA)
Polyvinyl alcohol (PVA), a synthetic polymer, is a partial or full hydrolysis product of polyvinyl acetate for eliminating the acetate groups and a water-soluble polymer as shown in Figure 1.12 and has high tensile properties (24 to 79 MPa) (Bondeson & Oksman, 2007). PVA has the advantages of good film forming properties and high resistance to water, oil, grease, and solvent makes it adaptable for various applications (Baker, Walsh, Schwartz, & Boyan, 2012). It is known as a biodegradable material, biocompatible, nontoxic, noncarcinogenic and extensively used in paper sizing, fiber coating, adhesives, emulsion polymerization, and medical field (Kawai & Hu, 2009). Also, PVA films present outstanding barrier properties for food packaging systems.
Figure 1.12 The structure of vinyl alcohol (left) and PVA synthesized by the hydrolysis of polyvinyl acetate (right) (Baker, Walsh, Schwartz, & Boyan, 2012)
According to Figure 1.13, an endothermic curve at 221°C was presented. Tg of PVA was noted at 70°C. However, many researches were attempted to blend PVA with other material to form thin-films or membranes. Lu et al., 2008 also revealed that cellulose and PVA polymer matrix has a good dispersion caused a good reinforcement. The interpenetration of PVA molecules into cellulose structure comes from the long duration of mixing. The hydroxyl groups on PVA interact with the hydrophilic surfaces of the cellulose. The high transparency film was presented as a result of the homogeneous dispersion of cellulose in PVA. They found that after cellulose presence, the crystallinity of PVA was increased owing to the nucleating effect of nano-sized cellulose fibers.
Figure 1.13 DSC thermograms of neat PVA film (Lu, Wang, & Drzal, 2008)
1.5 Cellulose and silk fibroin for flexible electronic substrate
Okahisa et al., 2009 studied the cellulose nanofibres from Douglas fir (Pseudotsuga menziesii) reinforced with acrylic matrix resins to fabricate a substrate for flexible organic light-emitting diode displays. They mentioned that the thickness of nanocomposite films were 90-100 μm and presented the light transmittance in the range of 82-85%. Moreover, these nanocomposites possess appropriate mechanical properties for continuous roll-to-roll processing. Legnani et al., 2008 used BC as flexible substrates for fabricating the organic light emitting diodes (OLED). Indium tin oxide (ITO) as a transparent conductive layer was functionalized on BC membrane. Normally, ITO was used for optoelectronic applications owing to its high transmittance in the visible region and high conductivity. SiO2 was also deposited by magnetron sputtering for increasing the smoothness of the film surface and to avoid surface reactions between the BC substrate and the deposited ITO film. They found that it produced highly effective in light emission and performance of the OLED device. Ummartyotin et al., 2012 also studied the development of a transparent and flexible BC and poly-urethane (PU) based resin nanocomposite film as a substrate for OLED display. They suggested that the characteristics of flexibility, optical transparency, high of light transmittance and dimensional stability in terms of coefficient of thermal expansion (CTE) of as low as 18 ppm/K was achieved the criteria for OLED substrate.Liu et al., 2014 used natural SF films as substrates instead of glass or synthetic polymers and blended it with silver nanowires (conductive material). The substrate presented a conductivity about 11 Ω/sq together with a transparency of more than 80% at 600 nm. According to the measurement of resistance after bending test, the resistance of the substrates slightly raises after being bent 500 times, but maintained lower than 20 Ω/sq. That is better than traditional flexible indium stannum oxide-polyethylene naphthalate (ITO-PEN) substrates.
1.6 Conductive materials for OLED device
Table 1.3 exhibited general information about the average requirements of some type applications. Indium tin oxide (Indium stannum oxide) (ITO) has been the most widely used anode material in OLED and LCD. The important properties are
high transparency (∼90% at 550 nm), low resistivity (∼2×10⁻⁴ Ω cm), and relatively high work function (∼4.8 eV) but its elements are becoming increasingly expensive, and it is brittle, causing it unreasonable for flexible screen. Therefore, it is desirable to develop other possibilities for transparent and flexible electrodes.
Table 1.3 The main criteria of a transparent electrode with expected performance for some applications. Plus signs indicate better values from very good (+++) to acceptable (+) (Daniel et
al., 2013)
Application Transparency Conductivity Flexibility
Photovoltaics +++ +++ +
OLED/PLED ++ ++ +
Film heaters + +++ ++
Touch screens +++ ++ ++
Graphene is a good candidate for conductive materials but it has disadvantage that it shows poorer current efficiencies than ITO-based devices (T.-H. Han et al., 2012). One of the favourable materials is silver, it has remarkable characteristics. It can produce the highest electrical conductivity, transparent conductive electrodes for optoelectronics, and the lowest optical losses of all metals (Berkhout, 2015). In this manner, AgNWs was used and can be covered onto flexible substrates by cost- effective and scalable roll-to-roll fabrication. According to Table 1.4, it represents the needs of each electrode for fabrication. The ranges of temperature were corresponding to the processing temperature during device fabrication.
Table 1.4 Regular information according to fabrication methods for transparent conductive material electrode. Plus signs indicate very good (+++), good (++), and acceptable (+) (Daniel et
al., 2013) Fabrication method Transparent
conductive oxides (TCOs)
Graphene Carbon nanotube networks (CNTs)
Silver nanowires
(AgNWs) Chemical vapour
deposition
+++ +++ + -
Sputtering +++ - - -
Spin coating - + ++ ++
Spray deposition ++ + +++ +++
Screen printing - - + ++ ++
Cost Low-High High High Medium
Processing temperature (°C)
>200b–1000 RT–1000c RT–700c RT–700c
Uniformity +++ + to +++ ++ ++
Typical thickness (nm)
100-300 <5 <10 25 > 600d
Typical transmission (at 550
nm)
80–97% 80–96% 80–91% 80–96%
aFabrication method refers to the production of electrodes directly, not to the production of the constituent components which are used to fabricate the network.
bDeposition temperatures of TCOs usually require several hundred degrees celsius or the use of vacuum processes such as sputtering.
cNetworks can be fabricated at room temperature (RT) but if device fabrication requires high temperature processes vacuum or encapsulation are required to stabilize the films.
dThickness is diameter and density dependent though with high mechanical pressure it can be reduced to the diameter of a single nanowire.
1.7 Problem Statement
Regarding to the frequent changing of the new trend of smartphone nowadays, many people simply decide to replace it with the latest flagship after having it for 2 or 3 years, hence, the problems of electronic wastes are going to increase. The main objective of this work was to prepare and investigate the properties of the flexible, thin, and transparent composite films produced from bacterial cellulose (BC), silk fibroin protein (SF), polyvinyl alcohol polymer (PVA), silver nanocubes (AgNC) making a substrate for organic light-emitting diode (OLED). These materials are environmentally friendly. This implies that they are biodegradable and are easily decompose. The minor objectives are defined to reach the goals as follow;
Objective I: Preparation of flexible and transparent substrate for OLED display
Bacterial cellulose, silk fibroin protein, polyvinyl alcohol, silver nanocubes were used to prepare the thin films for OLED substrate. To the best of our knowledge, this is the first invention of the flexible displays by using these materials mixed together. BC and SF fibrils were first hydrolyzed by fuming acid to obtain the nano- size fibrils. Then, ten samples were prepared; BC-PVA (S1), SF-PVA (S2), PVA (S3), BC-PVA-AgNC (S4), SF-PVA-AgNC (S5), PVA-AgNC (S6), BC-SF-PVA-AgNC (S7), BC-SF (S8), BC-SF-AgNC (S9), BC-SF-PVA (S10). In case of AgNC, it was synthesized and used as a conductive material.
Objective II: Investigation of physical, mechanical, thermal, and electrical properties of ten samples
First, the visually transparent of each film were compared by photographs.
Then, the properties of ten films were studied by using UV-Vis spectroscopy, XRD, FESEM, ATR-FTIR, DSC, TGA, Tensile tester, DMA, and Complex conductivity analysis. The effect of PVA, AgNC, and acid hydrolysis were also examined. Some of those films were performed on the influence of light and investigate the mechanical and conductivity properties.
Objective III: Comparison the characteristics of these samples according to the Standard requirement of flexible electronic display
Not only the basic properties need to studies, but the requirements of these substrates also important to consider. Recently, the flexible electronic substrate has the standard regulations. Therefore, our films need to be compared with glass, plastic, or other polymer composite films. Finally, our ten substrates were chosen for the preferential to further fabricate the OLED display for smartphone.
CHAPTER II
MATERIALS AND METHODS
2.1 Raw materials and chemicals
Nata de coco was kindly supplied by Thongaumphai’s production, Thailand.
Cocoons of silkworm Bombyx Mori were obtained from Chul Thai Silk Co., Ltd., Thailand. Sodium hydroxide (NaOH), sodium carbonate (Na2Co3), 37% hydrochloric acid solution (fuming HCl), polyvinylpyrrolidone (PVP), polyvinyl alcohol (PVA), potassium bromide (KBr), ethylene glycol (EG), copper(II) chloride (CuCl2), silver nitrate (AgNO3), and methanol (CH3OH) were purchased from Sigma-Aldrich Co., Hungary. All chemicals were used as received without further purification (Figure 2.1).
Figure 2.1 Raw Nata de coco (left) and Bombyx mori silk cocoons (right)
2.2 Experimental details
2.2.1 Purification of Nata de coco and preparation of dried microfibrillated and nanocrystalline bacterial cellulose films
The procedure for the purification of Nata de coco and preparation of dried BC films are based on Y Hosakun et al., 2017, briefly, raw Nata de coco was first cut and boiled in water until reached pH~7. Then, it was purified in 0.1 M NaOH solution at 80°C to eliminate non-cellulosic materials. This process changed the color from yellow to transparent gel. Then, the gel was boiled in distilled water several times until the pH become neutral. The gel was blended by a blender and dried in an oven to
get dried microfibrillated BC films (Figure 2.2). These films were further used for preparing nanocrystalline BC films.
Figure 2.2 Purification of Nata de coco (left) and purified BC (right)
The dried microfibrillated BC films (approximately 1.2 g) were placed in a desiccator which contained 37% HCl solution inside. The degradation of cellulose occurred and the nanocrystalline cellulose was achieved during this step. Then, it was dried in an oven to calculate the remaining weight of BC after hydrolysis (~ 1.1 g was prepared for further analyses).
2.2.2 Degumming of silk cocoons and preparation of nano-silk fibroin films
The process of degumming of silk cocoons was carried out similar to Y Hosakun, Halász, Horváth, Csóka, & Djoković, 2017, briefly, the cocoons were boiled in 0.02 M Na2CO3 and washed in water for several times at 50°C. Then, the degummed SF was put into an oven to dry. According to hydrolysis reaction, the dried degummed SF (approximately 0.7 g) was placed into desiccator with 37% HCl vapor inside to obtain nano-silk fibroin (Figure 2.3). The nanosilk was then dried in an oven for calculating the weight after hydrolysis (~ 0.5 g was prepared for further analyses).
.
Figure 2.3 Hydrolyzed and degummed SF
2.2.3 Preparation of polyvinyl alcohol solution
In order to prepare 5%wt PVA solution, 2.5 g PVA powder was dissolved in 50 ml distilled water. After that, the solution was heated and continuously stirred at 95°C for 2 hours until clear solution obtained. Approximately 50 mL of solution was prepared for further use.
2.2.4 Synthesis of silver nanocubes (AgNC)
In order to synthesize AgNC, a mixture of 0.668 g of PVP, 0.010 g of KBr, and 20 ml of EG was heated and kept temperature constant in a flask at 170°C with continuous stirring. Subsequently, 0.050 g CuCl2 was added to the flask. The combined solution was allowed to mix for 3 minutes. Then, 0.220 g of AgNO3 powder was titrated for 10 minutes into the flask. To ensure the growth to be completed, the flask was heated for 2 hours. After the solution was cooled down, it was centrifuged at 2000 rpm for 30 minutes to separate the cubes which remained in the supernatant. The supernatant was then centrifuged twice to precipitate the cubes at 6000 rpm for 30 minutes. After the supernatant which contain EG, PVP, and other impurities was discarded, the sediment of AgNC was stored in 5 ml of methanol (Hu, Kim, Lee, Peumans, & Cui, 2010) (Figure 2.4).
Figure 2.4 Silver nanocubes (AgNC) synthesized by polyol process
2.2.5 Fabrication of dried sample films by evaporation drying technique - S1 was prepared by blending of micro- and nanofibrillated BC at an amount according to Table 2.1. Both types of BC were soaked in 80 mL of distilled water and the obtained dispersed colloid was treated in an ultrasonic instrument at low frequency (20 kHz) using a horn with a tip diameter of 18 mm. The suspension of BC after sonication was mixed with PVA solution and stirred overnight.
- S2 was fabricated from nanosilk and PVA. First, SF was immersed in water of 80 mL. After that, it was sonicated until well dispersed colloid was achieved. PVA solution was blended to the suspension and stirred overnight.
- S3 contained only PVA solution.
- S4 was prepared similar to S1 but AgNC was added into the colloid.
- S5 was made according to S2 except blending of AgNC.
- S6 was similar to S3 and embedded with AgNC.
- S7 was blended for all components. Firstly, both types of BC and nanosilk were immersed in 80 mL of distilled water and to achieve dispersed colloid, an ultrasonic instrument at low frequency (20 kHz) was applied. The suspension after sonication was mixed with PVA and AgNC solution, then, stirred overnight.
- S8 comprised of BC and SF. Micro- and nanofibrillated BC and nanosilk were steeped in 80 mL of distilled water and an ultrasonic instrument was applied to obtain well dispersed colloid.
- S9 was prepared similar to S8 and blended with AgNC.
- S10 was fabricated by mixing of BC, SF, and PVA analogous to S9, no AgNC.
The samples were poured onto trays (diameter 7 cm). The trays were put in an oven at 40°C for 3 days until the dried films were obtained. Ten types of the flexible and transparent samples were obtained according to Table 2.1 below.
Table 2.1 Component of each sample Sample
code
Microfibrillated BC dried film (mg)
Nanofibrillated BC dried film
(mg)
Dried Nanosilk
(mg)
5% wt PVA solution
(mL)
AgNC (mL)
S1 20 60 - 1 -
S2 - - 26.7 1 -
S3 - - - 1 -
S4 20 60 - 1 0.07
S5 - - 26.7 1 0.07
S6 - - - 1 0.07
S7 20 60 26.7 1 0.07
S8 20 60 26.7 - -
S9 20 60 26.7 - 0.07
S10 20 60 26.7 1 -
Three pieces of each samples (S1-S10) were prepared for further analysis.
2.3 Characterization methods used for testing the samples
The ten different types of samples were characterized by using eight types of measurements discussed below. Not all samples were used in every test (Table 2.2).
2.3.1 Ultraviolet-visible (UV-VIS) spectroscopy
Ultraviolet-visible (UV-Vis) spectra were investigated on WPA lightwave S2000 UV/VIS spectrophotometer for recording the light transmittance of the samples over the visible wavelength of 400-800 nm. A base line was recorded and calibrated using air. Measurement was conducted in triplicates.
Table 2.2 The samples characterization. Performed (✓) and not performed (-)
Sample Code
Light transmittance
FESEM FTIR DSC TGA Tensile strength
DMA Conductance
S1 ✓ ✓ - ✓ ✓ ✓ - -
S2 ✓ ✓ - ✓ ✓ ✓ - -
S3 ✓ ✓ - ✓ ✓ ✓ - -
S4 ✓ ✓ - ✓ ✓ ✓ - -
S5 ✓ ✓ - ✓ ✓ ✓ - -
S6 ✓ ✓ - ✓ ✓ ✓ - -
S7 ✓ ✓ ✓ ✓ ✓ ✓ ✓ ✓
S8 - - ✓ - - ✓ ✓ ✓
S9 - - ✓ - - ✓ ✓ ✓
S10 - - ✓ - - ✓ ✓ ✓
2.3.2 X-Ray Diffraction Analysis (XRD)
X-ray diffraction measurement of nanosilk was performed on the Angle dispersive XRD beamline (BL-12) of Indus-2 synchrotron source, RRCAT (India), using an image plate area detector (MAR345dif). The X-ray wave length (1.1 Å) used for the present study was accurately calibrated by doing X-ray diffraction on LaB6 NIST standard.
2.3.3 Morphological analysis of the nanocomposite films by FE-SEM microscopy
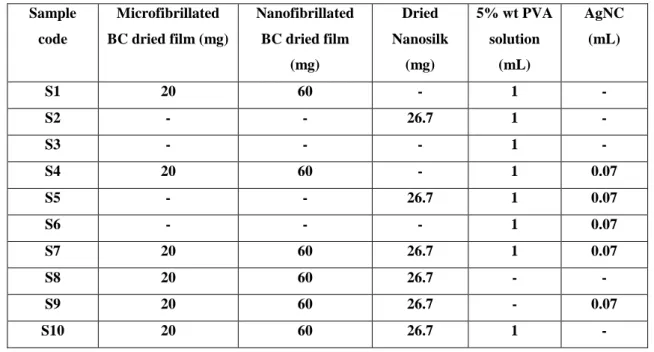
The morphologies of seven types of nanocomposite films (S1, S2, S3, S4, S5, S6, and S7) were carried out by using a field emission scanning electron microscope (SU8230) at an accelerating voltage of 5 and 10 kV. The samples were cut in the size of 5×5 mm in the rectangular shape and carbon was painted at the edge of the surface.
The films were coated with a thin layer of Au for 45 sec prior to analysis (Figure 2.5).
Figure 2.5 Sample preparation (left), sputter coating (middle), and FESEM instrument (right)
2.3.4 ATR-FTIR spectroscopy
ATR-FTIR data collection was conducted on a Jasco FT/IR6300 equipped with an ATR PRO 470-H spectrometer. All spectra were measured using air as a background. A total of 25 cumulative scans were taken per sample with a resolution of 4 cm-1, in the absorbance mode, in the frequency range of 4000-400 cm-1. The test was done at room temperature, in triplicates.
2.3.5 Differential Scanning Calorimetry (DSC)
Differential Scanning Calorimetry (DSC) measurements for the S1, S2, S3, S4, S5, S6, and S7 samples were carried out using Mettler Toledo DSC 3+ instrument under nitrogen purge (50 mL/min). The heating and cooling rates were 10°C/min. An initial mass of each sample was shown in the Table 2.3.
Table 2.3 Initial weight of DSC and TGA analysis
Sample code Initial mass (mg)
DSC TGA
S1 2.25 8.51
S2 2.10 8.90
S3 2.28 8.39
S4 2.94 9.67
S5 2.44 9.55
S6 2.19 7.22
S7 2.31 9.97
They were sealed in a standard aluminum pan (40 μL) (Figure 2.6). In this measurement a heat-cool-heat system was used and the second heating scan thermogram applied for thermal analysis. First, the sample was heated from 0 to 220°C to erase thermal history. Then, it was cooled down to 0°C before re-heating it to 220°C. The glass transition temperature (Tg) was obtained as the inflection point of the particular heat increment at the transition of the glass-rubber state.
Figure 2.6 DSC instrument (left) and aluminum sample pans (40 μL) covered with the lids (right)
2.3.6 Thermogravimetric Analysis (TGA)
The thermogravimetric analyses were carried out using Mettler Toledo TGA/DSC 3+. The S1, S2, S3, S4, S5, S6, and S7 samples were cut and placed into an experimental sample pans with a sensitive microbalance (Figure 2.7). A furnace was provided with nitrogen atmosphere at the rate of 50 mL/min, in the temperature range from 25 to 500°C. The heating rate was 10°C/min. The curves were plotted between percent of weight loss and temperature. The first derivative of the mass loss curves also were plotted against temperature (DTG).
Figure 2.7 TGA instrument (left) and reference and sample pans were on a sensitive microbalance (right)
2.3.7 Tensile tests of sample films
Tensile tests were performed on the INSTRON 3345 Tensile Tester. A length and a width of the strips of BC and SF containing nanocomposite films was 45 mm and of 15 mm, respectively. The applied cross-head speed was 5 mm/min on all five specimens of each samples (S7, S8, S9, S10).
2.3.8 Dynamic mechanical analysis (DMA)
DMA measurement of BC nanocomposite films (S7, S8, S9, and S10) was performed in shear mode on a METRAVIB DMA50 machine with a DYNATEST 6.9 software. Specimens were prepared to dimensions of approximately 2×10×0.034 mm.
First, frequency sweep was studied. The frequency of the loading was varied from 0.2 Hz to 20 Hz at room T. Temperature scans were run from -100 to 200°C at a heating rate of 3°C/min with a frequency of 1 Hz. All samples were carried out under the white light illumination and measured the value of storage modulus (E′) and loss tangent (tan δ). In case of S7, the light effect was investigated; therefore, it was stored in the dark for more than 12 hours and measured without any light.
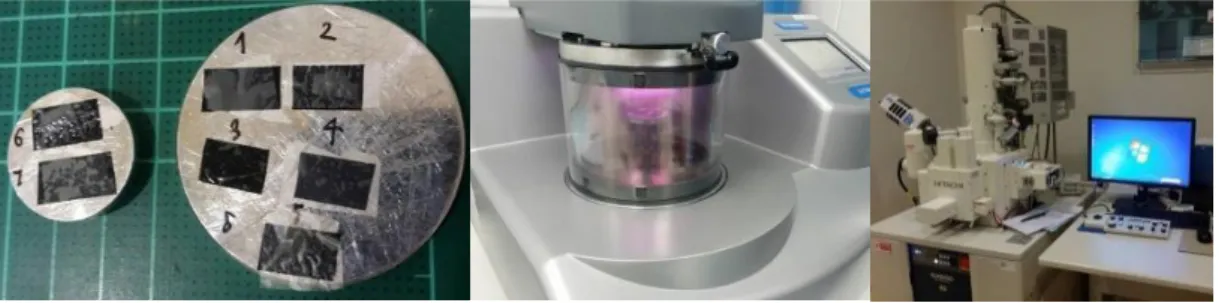
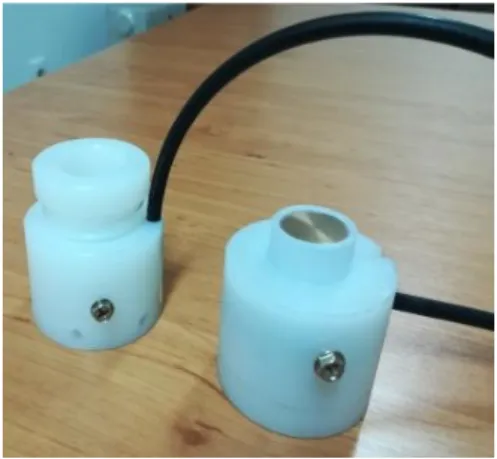
2.3.9 Complex conductivity (Conductance) measurements
Four types of samples (S7, S8, S9, and S10) were used for measuring the conductivity at 2.4 kHz in the homemade cell and there were no contact with the