** Óbuda University, Bánki Donát Faculty of Mechanical and Safety Engineering, Institute of Mechatronics and Vehicle Engineering. Óbudai Egyetem Biztonságtudományi Doktori Iskola. ORCID: 0000-0002-1442-4037
** University Professor, Obuda University. ORCID: 0000-0001-6702-6000 ÖSSZEFOGLALÁS: A hálózatról tölthető elektromos járművek egyre népsze- rűbbek a fejlett országokban a levegőszennyezési problémák, a kimerülő olajkészletek, fosszilis üzemanyagok és a növekvő üzemagyagárak miatt.
A megfelelő távolsági tömegközlekedési infrastruktúra megléte egyelőre ki- fejezetten fontos feltétele az elektromos járművek széleskörű terjedésének, mivel ezek hatótávolsága napjainkban még korlátozott. Egy általános töltőhá- lózat kiépítése rendkívül fontos annak érdekében, hogy a felhasználók az otthonuktól távol is képesek legyenek tölteni elektromos autóikat és ezzel nagyobb utak megtétele után se okozzon gondot a hazatérés. Az autóiparra egyre nagyobb társadalmi és kormányzati nyomás nehezedik, hogy csökken- jen a szennyezőanyag-kibocsájtás és jobban elterjedjenek a tisztább, fenn- tarthatóbb közlekedési eszközök, mint amilyenek a tisztán elektromos jármű- vek is. Az alábbi tanulmányban körbejárjuk az elektromos járművek töltési technológiáit, áttekintjük a globális elektromos járműpiacot és a töltőhálózat kiépítését befolyásoló tényezőket.
ABSTRACT: Plug-in electric vehicles (PEVs) are becoming increasingly popu- lar in developed countries in order to overcome pollution problems, depleting natural oil reserves, fossil fuels, and rising gasoline costs. The availability of public transport infrastructure is a critical factor in increasing the adoption of PEVs because long journeys cannot be achieved through the limited electric range of PEVs. Therefore, providing a general charging service to reach the home is an essential requirement.
Moreover, the automotive industry is facing increasing social pressure and renewed government regulations to reduce emissions and adopt cleaner and more sustainable technologies such as PVS. In this paper, we describe the electric Vehicle Charging technologies, the global electric vehicle market, and the main features of charging placement infrastructures.
KEY WORDS: Plug-in electric vehicles, global electric vehicle market, public transport infrastructure.
KULCSSZAVAK: elektromos járművek, globális elektromos járműpiac, tö- megközlekedési infrastruktúra
Haya Altaleb* – Dr. Rajnai Zoltán**
Electric Vehicle Charging Infrastructure and Charging Technologies
I
ntroductIonElectric vehicles had a long history until they achieved the present level of widespread usage. This industry had be- come a priority in most metropolitan communities between 1832-1839; the First electric carriage was invented by Rob- ert Anderson in Scotland (Kurniawan and Wulandari 2013).
The researchers continued with the small scale electric and non-rechargeable electric cells, then a better storage battery was invented by Gaston Planet in France. Later on, some improvements were made by Camille Faure in 1881 (Mar- tínez-Lao et al. 2017). In the 19th century, sales of electric cars were higher than gas-powered cars because their tech- nology did not require gear changes or had the vibration or noise associated with gasoline-powered cars. The thirty years between 1930 and 1960 became the Electric Car
“dead years” due to cheaper gasoline-powered car technol- ogy and the construction of highways that required long- distance driving vehicles (Nishimwe and Reine 2017).
The electrical vehicle charging infrastructure is abso- lutely necessary to increase the electric vehicle (EV) market all over the world. In other words, the availability of public transport infrastructure is a critical factor in increasing the adoption of PEVs because long journeys cannot be achieved through the limited range of PEVs. As a result of the growth of production volumes and decreasing battery costs over the next years, electric vehicles are approaching cost-competitiveness with conventional vehicles. In the past few years, electric vehicles have gone from new tech- nology with no mass production to a fast-growing part of
the vehicle market. In early 2017, two-million electric vehi- cles were sold (Hall, Cui, and Lutsey 2017), and electric vehicles surpassed 10% of new vehicle sales in multiple markets. Several automakers are expecting to sell more than 15 million electric vehicles per year by 2025 (Hall, Cui, and Lutsey 2017).
Many governments have launched programs to encour- age the construction of charging infrastructure through regula tions, incentives, and partnerships. Nonetheless, there is comparatively little consensus about the optimal distribution of charging infrastructure and the relationship between electric vehicle uptake and charging infrastructure.
Transportation electrification is considered an essential step toward climate, energy, and air quality independence goals.
To achieve these goals, governments have invested sub- stantial funding to promote electric vehicles and the associ- ated charging infrastructure (Hall and Lutsey 2017). Charg- ing infrastructure is the main priority for governments seek- ing to accelerate electric vehicle adoption, but there is a specific relationship between charging infrastructure avail- ability and increased electric vehicle sales as well. What is more, there are no universally specific goals or standards for charging infrastructure density, either on a per-capita or per- vehicle basis. However, in the past few years, several stud- ies have provided useful insights into this question.
In this paper, section one will describe the electric Vehi- cle Charging technologies, section two is about the recent global electric vehicle market, the third section discusses the Charging placement infrastructures, and finally, con- clusion and recommendations.
E
lEctrIcV
EhIclEc
hargIngtEchnologIEsC
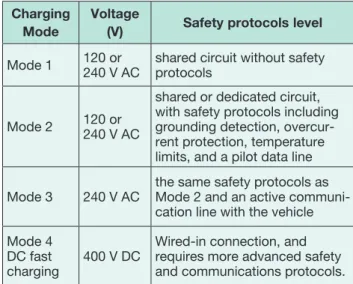
hargingspeedsClassifiCationCharging infrastructure is divided into three categories depending on speed: Level 1, Level 2, and direct current (DC) fast charging (sometimes referred to as Level 3). The time required to charge a vehicle is defined as charging power measured in kilowatts (kW); orders of magnitude across charge points can vary it. A small household outlet may charge as slowly as 1.2 kW, while the most advanced rapid charging stations can charge at up to 350 kW, 400 V DC, in public (DERİCİOĞLU et al. 2018). Moreover, charg- ing infrastructure is classified by mode, as shown in Table 1.
Table 1. Charging infrastructure categorized by mode (Tie and Tan 2013)
Charging Mode
Voltage
(V) Safety protocols level Mode 1 120 or
240 V AC shared circuit without safety protocols
Mode 2 120 or 240 V AC
shared or dedicated circuit, with safety protocols including grounding detection, overcur- rent protection, temperature limits, and a pilot data line
Mode 3 240 V AC the same safety protocols as Mode 2 and an active communi- cation line with the vehicle Mode 4
DC fast
charging 400 V DC Wired-in connection, and requires more advanced safety and communications protocols.
Charging infrastructure can also be categorized into three types: rapid, fast, and slow. Each charger type has an associated set of connectors, which are customized for low or high power use, and either AC or DC charging (Hu et al. 2016).
Rapid chargers are considered as the fastest method to charge an EV. Rapid devices supply high power direct or alternating current – DC or AC – to recharge a car to 80%
in 20-40 minutes. Mostly, the charging unit’s power goes down when the battery is around 80% full to protect the battery and prolong its life. Rapid charging can only be used on vehicles with rapid-charging capability (Serradilla et al. 2017). Rapid DC chargers provide power at 50 kW (125A) and use either the CHAdeMO or CCS (Combined Charging Standard). These are the most popular types of rapid EV charge points currently, and they have been the
standard for the best part of a decade (DERİCİOĞLU et al.
2018). Ultra-Rapid (DC) chargers provide power at 100 kW, 150 kW, or 350 kW – though other maximum speeds are also possible. For all EVs capable of accepting 100 kW or more, charging times are 20-40 minutes for a typical charge (Atmaja and Amin 2015). Even if an EV is only able to accept a maximum of 50 kW DC, it can still use ultra- rapid charge points, as the power will be limited to whatever the vehicle can deal with. As with 50 kW rapid devices, cables are connected to the unit and provide charging via either CCS or CHAdeMO connectors (Dewalska-opitek 2019). Tesla’s Supercharger network provides rapid DC charging using either Tesla Type 2 connector or a Tesla CCS connector – depending on the model. These are able to charge at up to 120 kW, though 150 kW charging is being rolled out. All Tesla models have been developed for use with Supercharger units, but many Tesla owners use adaptors which enable them to use 50 kW rapid units fitted with a CHAdeMO connector. Although these provide less power than a Supercharger, they are more common in the UK and elsewhere. Tesla Type 2 connectors can be used by both Model X and Model S drivers, and they can be fitted to all Supercharger units. On the other hand, Tesla Model 3 drivers must use the Tesla CCS connector, which is being phased in across all Supercharger units (Sull and Reavis 2019).
Fast chargers are usually classified at 7 kW or 22 kW (single- or three-phase 32A). A 7 kW charger will recharge an electric vehicle with a 40 kWh battery in 4-6 hours, while a 22 kW charger takes 1-2 hours (Atmaja and Amin 2015).
Most of the fast chargers supply AC charging. Nevertheless, some networks are installing 25 kW DC chargers with CHAdeMO or CCS connectors (DERİCİOĞLU et al. 2018).
The fast chargers are usually located at car parks or leisure centers where the customers are likely to be parked at for an hour or more. Charging rates of the fast chargers will depend upon the car’s on-board charger, while not all models are able to obtain 7 kW or more. Those models can be plugged into the charge point, but will only receive the maximum power accepted by the on-board charger. For example, Nissan Leaf with a 3.3 kW onboard charger will only receive a maximum of 3.3 kW, even if the fast charger is 7 kW or 22 kW.
Slow charging units are rated at up to 3 kW, and a full charge on a 3 kW unit will typically take 6-12 hours (Atmaja and Amin 2015). Slow charging is a popular and easier method of charging electric vehicles, used to charge EVs at home overnight. Basically, slow charging can be carried out via a three-pin socket by a standard 3-pin socket.
Figure 3 below shows the slow connectors, which can be used by any plug-in EV with the appropriate cable. The vast majority of home units have the same Type 2 inlet as found on public chargers, or they are equipped with the Type 1 connector where this is suitable for a particular EV (Atmaja and Amin 2015).
Figure 1. Rapid chargers
C
onneCtorsandCablesThe vehicle’s inlet port and the socket determine the choice of the connector’s type. On the charger-part, rapid chargers use CCS (European Combined Charging System or ‘Combo’), CHAdeMO, or Type 2 connectors.
Figure 4. Main parts of electric vehicle charger (Atmaja and Amin 2015)
EVs are designed with two cables for fast and slow AC charging, one with a Type 2 connector charger-side, and the other with a three-pin plug. Both of them are fitted with
a suitable connector for the car’s inlet port. These cables allow electric vehicles to connect to most untethered charge points, while the use of tethered units requires using the cable with the correct connector type for the vehicle. For example, the Nissan Leaf MkI is typically supplied with a Type 2-to-Type 1 cable and a 3-pin-to- Type 1 cable. So DC connectors include CHAdeMO (Japanese JEVS), CCS (European Combined Charging System, or ‘Combo’) and Tesla’s proprietary supercharger connectors. On the vehicle-part, European EV models (Mercedes, VW, BMW, Audi, Renault, and Volvo) head for Type 2 inlets and the corresponding CCS rapid standard, while the Asian manufacturers (Mitsubishi and Nissan) tend to select a Type 1 and CHAdeMO inlet combination.
However, an increasing number of Asian manufacturers are switching to European standards for vehicles sold in the region. The pure-electric models use Type 2 CCS, and Kia and Hyundai plug-in models all feature Type 2 inlets (Standard 2002).
Figure 2. Fast chargers
Figure 3. Slow connectors
Figure 5. The global electric vehicle market
E
lEctrIcV
EhIclEglobalmarkEtThe electric mobility sector has undergone rapid growth in the past few years. In 2018, the global electric car fleet surpassed 5.1 million, up 2 million from the last year, and the number of new electric car registrations nearly dou- bled. Owning around half (45%) of the global stock of EVs with 2.3 million electric vehicles in active use, China stayed the world’s biggest EV market in 2018. Europe and the US are relatively far behind with 1.2 and 1.1 million EVs, re- spectively. By the end of 2018 there were 250 000 units of light commercial vehicles (LCVs), while the number of elec- tric buses reached 460 000, and medium electric truck sales were in the range of 1 000-2 000. During 2018 the global electric vehicle stock was provided by 5.2 million light-duty vehicle (LDV) chargers (540 000 of which were accessible for the public), complemented by 157 000 fast chargers for buses. EVs on the road in 2018 consumed about 41 million tons of carbon dioxide equivalent emissions (Mt CO2-eq) and 58 terawatt-hours (TWh) of electricity.
Compared with an equivalent internal combustion engine fleet, 36 Mt CO2-eq was saving (Till Bunsen et al. 2019).
According to the New Policies Scenario of 2030, global EV sales will reach 23 million and the stock exceeds 130 million vehicles (excluding two/three-wheelers). Also, EV sales and inventory will nearly double by 2030: sales
than 250 million. China preserves its world lead with a 57%
share of the EV market by 2030, Europe comes after with 26%, and Japan with 21%. With the expected size of the global EV market, the development of battery manufacturing capacity will hugely be driven by electrification in the vehicles market. Consequently, this strongly supports the increasing consensus that the electrification of cars will be a crucial driver in cutting unit costs of automotive battery packs (Till Bunsen et al. 2019) (WEC 2011).
c
hargIngplacEmEntInfrastructurEsThe placement of charging stations in optimal locations at a local level leads to maximized usage, avoiding traffic and parking issues, and it minimizes stress on the power grid.
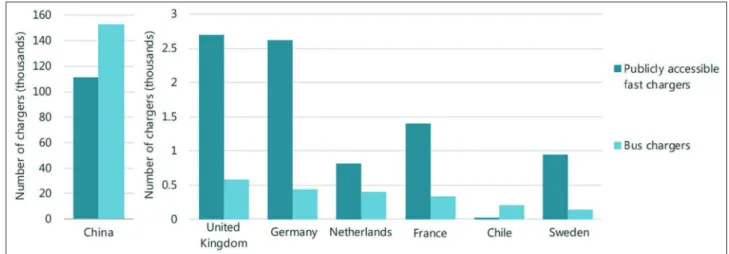
The main factors of charging placement infrastructures for both standard and DC fast charging are population density and the prevalence of multi-unit domiciles. A coordination of the efforts between multiple stakeholders when funding and deploying electric vehicle charging infrastructure is needed to enable private-sector and government partners to create guidelines that will maximize the use of infra- structure (Yi and Bauer 2016). Some of the studies and models addressing this issue in-depth are summarized by Harrison and Thiel, including the considerations used in Figure 6. Dedicated bus chargers and publicly accessible fast chargers by country, 2018
Sources: IEA estimate based on country submissions, complemented by Chinabaogao (2019) and EAFO (2019).
Figure 7. Electric car stock and publicly accessible chargers by country, 2018
Sources: IEA analysis based on country submissions, complemented by Chinabaogao (2019) and EAFO (2019)
type of data required, they also include considerations with regard to parking, transit, and the power supply in Bolzano and South Tyrol, Italy (Harrison and Thiel 2017). Wirges, Linder and Kessler take into consideration the commute patterns, transit, and business locations in a dynamic spa- tial model of the development of charging infrastructure for electric vehicles in the German metropolitan region of Stuttgart (Wirges, Linder, and Kessler 2012). Yi and Bauer focuse on energy consumption, cost, and parking in Chi- cago and South Bend, United States (Yi and Bauer 2016).
Their considerations include traffic impacts and vehicle range in Singapore, as well.
c
onclusIonandrEcommEndatIonsThe authors have given an overview of the charging infra- structure technologies, connectors, cables and charging speed classifications which are commonly used in the electric vehicles sector, and included a brief overview of the global EV market according to 2030 polices and plans.
Regarding the research topic, the authors have some rec- ommendations and ideas to increase the use of electric vehicles, which are the following: Better financial incen- tives, more abundant charging, test drive events, better media coverage, electric car rentals, electric vehicles ac- cess to HOV lanes, bus lanes, and toll roads (for free), electric car-sharing, and using electric buses. The estab- lishment of charging stations based on population density, free parking at markets, schools, universities, medical complexes, airports and factories, and high ways with proper distance calculation between the stations are also paramount to achieving the above objective.
r
EfErEncEsAtmaja, Tinton Dwi, and Amin. 2015. “Energy Storage System Using Battery and Ultracapacitor on Mobile Charging Station for Electric Vehicle.” Energy Procedia.
https://doi.org/10.1016/j.egypro.2015.03.274.
DERİCİOĞLU, ÇAĞLA, EMRAK YİRİK, ERDEM ÜNAL, MEHMET UĞRAŞ CUMA, BURAK ONUR, and MEHMET TÜMAY. 2018. “A Review of Charging Technologies for Commercial Electric Vehicles.”
International Journal of Advances on Automotive and Technology 2 (1): 61–70. https://doi.org/10.15659/
ijaat.18.01.892.
Dewalska-opitek, Anna. 2019. Development of Transport by Telematics. Vol. 1049. https://doi.org/10.1007/978- 3-030-27547-1.
Hall, Dale, Hongyang Cui, and Nic Lutsey. 2017. “Electric Vehicle Capitals of the World : What Markets Are Leading the Transition to Electric ?” no. November.
Hall, Dale, and Nic Lutsey. 2017. “EMERGING BEST PRACTICES FOR ELECTRIC VEHICLE CHARGING INFRASTRUCTURE,” no. October.
Harrison, Gillian, and Christian Thiel. 2017. “An Explor- atory Policy Analysis of Electric Vehicle Sales Competi- tion and Sensitivity to Infrastructure in Europe.”
Technological Forecasting and Social Change 114:
165–78. https://doi.org/10.1016/j.techfore.2016.08.007.
Hu, Junjie, Hugo Morais, Tiago Sousa, and Morten Lind.
2016. “Electric Vehicle Fleet Management in Smart Grids: A Review of Services, Optimization, and Control Aspects.” Renewable and Sustainable Energy Reviews 56: 1207–26. https://doi.org/10.1016/j.rser.2015.12.014.
Kurniawan, Bayu, and Diah Wulandari. 2013. “Rancang Bangun Sistem Suspensi Double Wishbone Pada Mobil Listrik Garnesa.” Jurnal Rekayasa Mesin 1 (01): 50–53.
Martínez-Lao, Juan, Francisco G. Montoya, Maria G.
Montoya, and Francisco Manzano-Agugliaro. 2017.
“Electric Vehicles in Spain: An Overview of Charging Systems.” Renewable and Sustainable Energy Reviews 77 (November 2015): 970–83. https://doi.org/10.1016/j.
rser.2016.11.239.
Nishimwe, Auteur, and Antoinette Marie Reine. 2017.
“Travail de Fin d ’ Études : “ Potential Use of Electric Vehicle in Wallonia “.”
Serradilla, Javier, Josey Wardle, Phil Blythe, and Jane Gibbon. 2017. “An Evidence-Based Approach for Investment in Rapid-Charging Infrastructure.” Energy Policy 106 (September 2016): 514–24. https://doi.
org/10.1016/j.enpol.2017.04.007.
Standard, Automotive Industry. 2002. “Electric Vehicle Conductive Charging System AC Electric Vehicle Charging Station.” IEC Standard 6185-22 138 (January).
Sull, Donald, and Cate Reavis. 2019. “Tesla ’ s Entry into the U . S . Auto Industry” 6 (March 2016): 1–27.
Tie, Siang Fui, and Chee Wei Tan. 2013. “A Review of Energy Sources and Energy Management System in Electric Vehicles.” Renewable and Sustainable Energy Reviews 20: 82–102. https://doi.org/10.1016/j.
rser.2012.11.077.
Till Bunsen, Pierpaolo Cazzola, Léa D’Amore, Marine Gorner, Sacha Scheffer, Renske Schuitmaker, Hugo Signollet, Jacopo Tattini, and Jacob Teter. Leonardo Paoli. 2019. “Global EV Outlook 2019 to Electric Mobility.” OECD Iea.Org, 232. www.iea.org/publica- tions/reports/globalevoutlook2019/.
WEC. 2011. Global Transport Scenarios 2050. World Energy Council. https://doi.org/10.1016/j.
enpol.2011.05.049.
Wirges, Johannes, Susanne Linder, and Alois Kessler.
2012. “Modelling the Development of a Regional Charg- ing Infrastructure for Electric Vehicles in Time and Space.” European Journal of Transport and Infrastruc- ture Research 12 (4): 391–416. https://doi.org/10.18757/
ejtir.2012.12.4.2976.
Yi, Zonggen, and Peter H. Bauer. 2016. “Optimization Models for Placement of an Energy-Aware Electric Vehicle Charging Infrastructure.” Transportation Research Part E: Logistics and Transportation Review 91: 227–44. https://doi.org/10.1016/j.tre.2016.04.013.
(Illusztrációk a szerző gyűjteményéből)
A Haditechnika megvásárolható:
Líra Könyváruház, Récsei Center 1146 Bp., Istvánmezei út 6., (telefon: 411-1543);
Stúdió könyvesbolt 1138 Bp., Népfürdő u. 15/D, (telefon/fax: 359-1964, 359-6461);
HM Zrínyi Nonprofit Kft. Ügyfélszolgálat (Budapest II., Fillér u. 14., 1087 Budapest Kerepesi út 29/b.
Nyitva tartás: H.–P. 9–15 óra www.topomap.hu).