Design of Experiments for Battery Aging Estimation ?
Anna I. P´ozna∗ Katalin M. Hangos∗∗,∗ Attila Magyar∗,∗∗
∗Department of Electrical Engineering and Information Systems, Faculty of Information Technology, University of Pannonia, Egyetem
str. 10., Veszpr´em, H-8200, Hungary (e-mail:{pozna.anna, magyar.attila}@virt.uni-pannon.hu)
∗∗Process Control Research Group, HAS Research Institute for Computer Science and Control, Kende str. 13-17., Budapest, H-1111,
Hungary (e-mail: hangos@scl.sztaki.hu)
Abstract:Li-ion batteries are widely used in EV applications and are imposed to several aging effects during their lifetime. Since battery health cannot be measured directly, information about its health can be obtained by iteratively re-estimating the parameters of the model describing its dynamical behavior.
The optimal design of experiments is investigated in this paper. The proposed method applies families of input signals (PRBS current and constant current-constant voltage (CC-CV) signals) to the batteries to estimate the key aging factors. Simulation experiments have been used to analyze the statistical properties of the estimators as a function of the design parameters of the input signal families.
The results show that the CC-CV charging-discharging cycle has the possibility to gain the most information out of the battery model parameter estimation.
Keywords:Input and excitation design; Model formulation, experiment design; Energy storage operation and planning; Electric and solar vehicles;
1. INTRODUCTION
Lithium-ion batteries are popular energy sources of our everyday life because of their high energy density, low self- discharge and light weight. Most of portable electronic de- vices (mobile phones, laptops), home electronics, electronic tools and electric vehicles run on some type of lithium-ion battery. Just like any other battery, the performance of the lithium-ion battery is not constant but slowly degrades during the operation. The battery health status cannot be measured directly therefore it should be estimated based on measurable quantities.
Battery aging is associated with the storage and the dy- namic usage. Calendar aging describes the aging process caused by the storage of the battery. The degradation of the battery caused by the charging and discharging is known as cycle aging. Capacity fading and the increasing internal resistance are the most conspicuous signs of bat- tery aging (Lu et al., 2013; Rezvanizaniani et al., 2014).
There are several factors which affect the battery aging.
The most important ones are the depth of discharge, current rate, cut-off voltage, resting time between cycles and temperature (Su et al., 2016; Barr´e et al., 2013).
? This research is partially supported by the National Research, Development and Innovation Office - NKFIH through grants No.
115694 and No. 120422. A. Magyar was supported by the J´anos Bolyai Research Scholarship of the Hungarian Academy of Sciences.
A. I. P´ozna acknowledges the support from the ´UNKP-17-3. New National Excellence Program of the Ministry of Human Capacities.
Experiment design is applied for the optimal charge of batteries in most of the related papers available in the literature, see e.g. Abdollahi et al. (2017); Liu and Luo (2010). The aspect from which optimality is examined is usually battery aging. The authors of Prochazka et al.
(2013); Mathieu et al. (2017) used experiment design in order to find the parameters responsible for aging. They have also built an aging model for batteries. In Forman et al. (2012) a battery health model is used and all of its ten parameters are being estimated.
At the same time, only a few works applies experiment design for identification of battery parameters. The papers of Rothenberger et al. (2015) and Mendoza et al. (2017) propose an experiment design solution that is optimal from the parameter identification point of view, where solution space is a sinusoidal signal family applied as charging/discharging current. On the other hand, experi- ment design (Kitsos (2014)) can also be used in order to maximize the information content of the battery charging- discharging related measurement dataset in order to esti- mate battery parameters more precisely.
In our previous work (P´ozna et al., 2017) we proposed a parameter estimation method for lithium-ion batteries based on their first order equivalent circuit model. The aim of this paper is to propose an optimal method for design of battery experiments for determining the key parameters responsible for battery aging.
R i(t)
vnonl(t) vbatt(t)
Fig. 1. Electrical circuit for the battery model. Voltage vnonl(t) of the controlled voltage source is different in the case of charge and discharge.
2. PARAMETRIC BATTERY MODEL
Batteries can be modeled by several modeling techniques, for example by electrochemical, equivalent electrical cir- cuit, empirical and black-box models, see e.g. Zhang et al.
(2014). The equivalent electrical circuit model (EECM) is a popular modeling technique due to its simplicity (Nejad et al. (2016)). EECMs are composed of basic electrical components like voltage sources, resistances, capacitances and sometimes nonlinear elements. The advantages of EECMs are that the construction of the model is easy, it does not require much computational effort and only a few model parameters should be taken into consideration.
A nonlinear EECM shown in Fig. 1 was used for our study.
edves The battery voltage during charging and discharging can be expressed with two models as in Tremblay and Dessaint (2009), that differ in their nonlinear terms in the equations below.
Charge model:
vbatt(t) =E0+Ri(t)−K Q
xSOC(t) + 0.1Qi∗(t)−
−K Q
Q−xSOC(t)i(t) +A exp(−B xSOC(t)) (1)
Discharge model:
vbatt(t) =E0−Ri(t)−K Q
Q−xSOC(t)xSOC(t)−
−K Q
Q−xSOC(t)i∗(t) +Aexp(−B xSOC(t)) (2)
where i∗(t) and xSOC(t) change according to the state equations (3) and (4), below
d
dtxSOC(t) =i(t) (3) d
dti∗(t) =−1
τi∗(t) +1
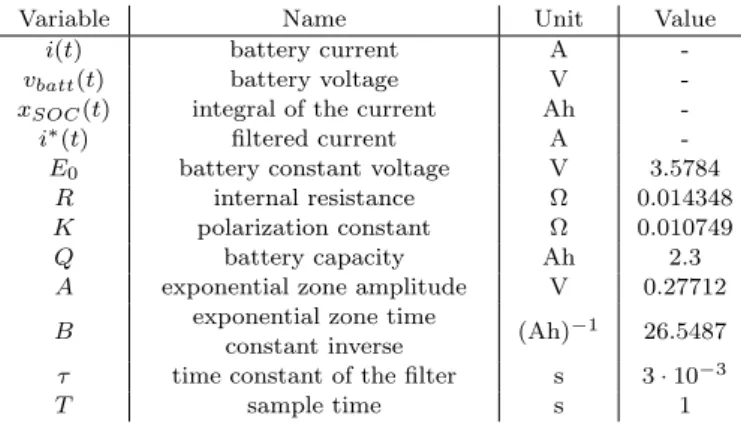
τi(t) (4) Summarized, the system is a linear state space model with hybrid and nonlinear output equations according to the charge and discharge models. The input of the system is the charging/discharging currenti(t) and the output is the voltagevbatt(t). The variables and the nominal parameters of the model for the Li-ion battery used in the experiments are shown in Table 1.
2.1 Parameter sensitivity analysis of the model
Parameter estimation is chosen as the main method of investigating the battery health in this work. As a first step, the battery model (1-4) has been analyzed with respect to parameter sensitivity. Instead of applying the classical methods of sensitivity analysis involving sensitiv- ity equations we used the same empirical method described
Table 1. Battery variables and parameters of the examined Li-ion battery
Variable Name Unit Value
i(t) battery current A -
vbatt(t) battery voltage V -
xSOC(t) integral of the current Ah -
i∗(t) filtered current A -
E0 battery constant voltage V 3.5784
R internal resistance Ω 0.014348
K polarization constant Ω 0.010749
Q battery capacity Ah 2.3
A exponential zone amplitude V 0.27712 B exponential zone time
constant inverse (Ah)−1 26.5487 τ time constant of the filter s 3·10−3
T sample time s 1
in P´ozna et al. (2017) i.e. changing the parameter values one by one with ±10% with respect to their nominal value and evaluated the differences of the nominal and the perturbed models outputs using the cost function
Ws(˜θ) = 1 N
N
X
k=1
1 2
vbatt(θ;k)−vbatt(˜θ;k)2 (5) where θ denotes the parameter vector, and ˜θ is the per- turbed parameter vector. The initial value ofxSOC(t) was 0.5Q for all the experiments and for the current input i(t) a PRBS signal (PRBS parameters: imin = 0.575 A, imax = 2.3 A) was used. The results of the sensitivity analysis is shown in Table 2. It is apparent that the battery
Table 2. Results of the parameter sensitivity analysis. All values are scaled down by 10−6.
E0 R K Q A B
+10% 6.4·104 2.893 3.292 3.482 0 0
−10% 6.4·104 2.893 3.292 3.446 0 0
model is highly sensitive for the battery constant voltage E0, and it is sensitive for parametersK, Q andRas well.
The poor sensitivity for the exponential parameters is probably due to the fact that the battery was half charged at the beginning of the experiment and the exponential term has its highest impact onvbatt for the fully charged case (see (Tremblay and Dessaint, 2009)).
3. EXPERIMENTAL SETUP
In order to simplify the design of experiments, some assumptions and limitations are made as follows.
• The parameters of the battery together with the tem- peratures (battery and environmental) are supposed to be constant during the experiment.
• The battery state of charge is assumed to be within 10 % and 90 %.
• The maximal C-rate is 2C during charging and dis- charging, i.e. the maximal battery (charging or dis- charging) current is supposed to be 4.6 A in our case.
• The parameters (R, K, Q, E0,) of the battery are estimated from measurement data with the method described in Section 3.2.
• ParametersA, Bare obtained from data sheets of the battery.
0 0.2 0.4 0.6 0.8 1 1.2 1.4 1.6
·104
−imax
-0.50.50 imax
t[s]
i(t)[A]
0 0.2 0.4 0.6 0.8 1 1.2 1.4 1.6
·104 vmin
3.55 vmax
t[s]
vbatt(t)[V]
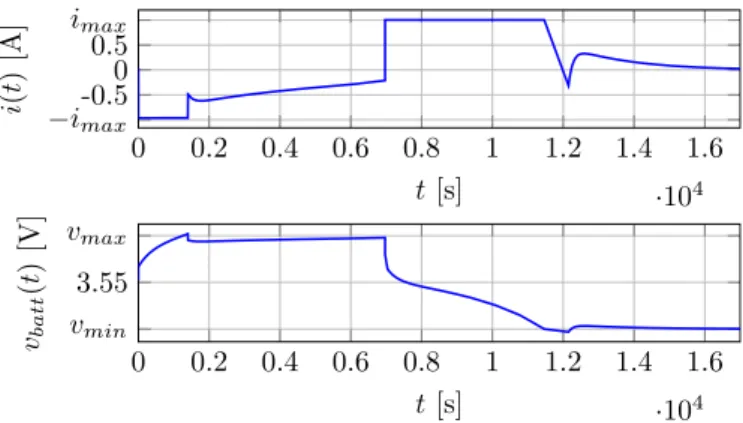
Fig. 2. Constant Current - Constant Voltage excitation.
The parameters of the CC-CV cycle arevmin= 3.5 V, vmax = 3.6 V and imax = 1 A, itrickle = 0.01 A, thold= 5000 s
3.1 Input Signal
The two basic choices of the excitation signal are the pseudo-random binary sequence (PRBS) widely used for parameter estimation (Ljung, 1999) and the constant current-constant voltage (CC-CV) cycle used for battery charging/discharging applications (see e.g. Zhang (2006)).
The basic operation of the CC-CV cycle is given in Algorithm 1. The parameters of this input are the voltages vmin, vmax, currents imax and itrickle and time thold. Fig. 2 shows the input i(t) and the vbatt(t) output of the model (1-4) for a CC-CV cycle. For the experiment design purposes, only the parametersvmin, vmaxandimax
are taken into account, while itrickle and thold are held constant.
Algorithm 1 Constant Current - Constant Voltage cycle
1: procedureCC-CV(vmin, vmax, imax, itrickle, thold) 2: loop
3: while do(vbatt(t)< vmax) 4: constant current charge atimax
5: end while 6: t=T ime
7: while do(|i(t)|> itrickle) and ((T ime−t)< thold) 8: constant voltage float atvmax
9: end while
10: while do(vbatt(t)> vmin) 11: constant current discharge atimax
12: end while 13: t=T ime
14: while do(|i(t)|> itrickle) and ((T ime−t)< thold) 15: constant voltage float atvmin
16: end while 17: end loop 18: end procedure
As an other possible choice, PRBS input can also be used for the parameter estimation. In this case, at each time instant the value of the input signal changes between two distinct values (imin andimax) with a probability of 0.5
i(t) =
imin, ifη <0.5 imax, ifη ≥0.5
whereηis a random variable following a uniform distribu- tionU(0,1).
0 0.2 0.4 0.6 0.8 1
·104 imin
-0.50.50 imax
t [s]
i(t)[A]
0 0.2 0.4 0.6 0.8 1
·104 3.5
3.55 3.6
t [s]
vbatt(t)[V]
Fig. 3. PRBS excitation of the battery model. The param- eters of the PRBS current input areimin=−1 A and imax= 1 A
3.2 Parameter Estimation
According to Table 2, all parameters E0, R, K and Q can be estimated successfully. However, during the aging process the most significantly changing parameters of the battery are the capacity (Q) and the internal resistance (R). These parameters are to be determined from input- output measurements. E0 and K are supposed to be estimated once before use.
Because of the hybrid nature of the battery output the data has to be separated to two distinct sets according to the charge and discharge.
Cost function The cost function to minimize during parameter estimation is the sum of squares defined by
W(Q, R) = 1 N
N
X
k=1
1
2 ˆvXbatt(k)−vXbatt(Q, R;k)2
(6) X∈ {charge;discharge}
where ˆvXbatt(k) = ˆvXbatt(k T) is the measured value of the battery voltage at the k-th sample, vbattX (Q, R;k) is the output of the model (1-4) with parameter valuesQandR for the capacity and internal resistance, respectively. The valueN is the total number of samples.
The nonlinear cost function (6) is optimized by direct min- imization using the well-known Nelder and Mead (1965) method.
4. DESIGN OF OPTIMAL EXPERIMENTS The aim of the experiment design is to find optimal experimental conditions in terms of the input signal type and its parameters. For this purpose, the norm of the covariance matrix of the estimates is used as a quality indicator. According to the Cram´er-Rao rule, if the norm Tr(cov) of the covariance matrixcov is minimal, then the Fisher information matrix is maximal (in a suitable norm) which means, that the measurement data contain maximal information about the parameters to be estimated (Rand Qin this case).
4.1 Covariance Matrix Estimation
As the parameter estimation was based on optimization, no statistical properties of the estimation (e.g. covariance
0 2
4
·10−2 2.2 0 2.4
5
·10−3
R[Ω] Q[Ah]
W(Q,R)
Cost function 95 % contour
Fig. 4. The cost function as a surface over the parameter planeQ−R for a discharge experiment using PRBS input. The initial charge was 50 %, imin = 0.575 A, imax= 2.3 A
matrix, or confidence regions) could be obtained. However, a good approximation of the confidence region in the parameter space can be obtained by computing the 1.05· Wmin level set of the cost function, where Wmin is its minimum value, and 95 % is the confidence level (see in Fig. 4). Using the locally quadratic nature of the cost function near its minimum, an approximate ellipse is being determined using elliptical regression as it can be seen in Fig. 5. The sum of the semi-minorband the semi-majora axes is used as an approximation of the trace norm of the covariance matrixcov, i.e.
Tr(cov)≈a+b . (7)
It means, that the optimal experiment design problem is equivalent to the minimization of the value (7) in the parameter space of the excitation input. If the input signal family is PRBS then the parameter space is the plane imin imax, if the CC-CV cycle is used, then it is the three dimensional space vmin, vmax, imin. Note, that if only charge (discharge) data is used for estimation, then parametervmin (vmax) “disappear“.
0 1 2 3 4
·10−2 2.3
2.4
R[Ω]
Q[Ah]
95 % contour Elliptical regression Semi-major axisa Semi-minor axisb
Fig. 5. Elliptical regression of the level set according to the 95 % confidence interval for the experiment of Fig. 4.
4.2 Unbiasedness of the estimate
Another important statistical descriptor of an estimation is the bias, i.e. the difference between the expected value
of the estimator and the actual value of the quantity to be estimated.
In the experiments of Section 5, the Euclidean distanced of the actual parameter pair (R, Q) and the estimated one (Rest, Qest) is used as an approximation of the bias:
d=p
(R−Rest)2+ (Q−Qest)2 (8) 5. SIMULATION RESULTS
The simulation experiments were implemented in Matlab Simulink using the Simscape Power Systems toolbox. All the simulations were performed on a PC (Intel i5 CPU with 4 GB RAM).
5.1 Model
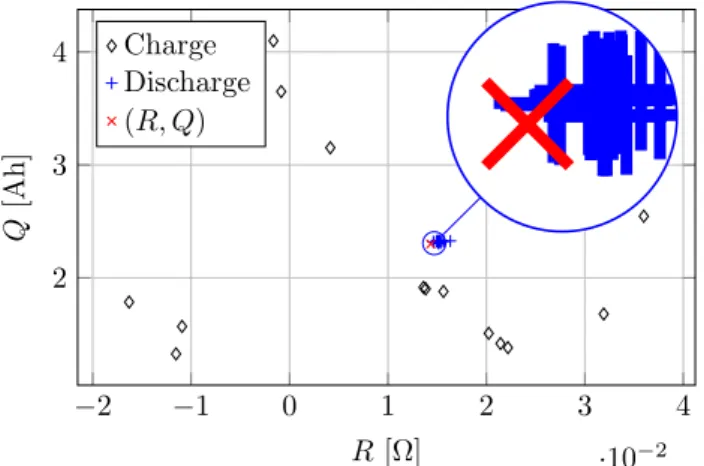
The first set of experiments investigate the accuracy of the estimators based on the charge- and the discharge models. The results of 18 independent experiments are shown in Fig. 6. During the experiments, the CC-CV parameters are from the cross product of the setsimax= {1.725A,2.3A,4.6A},vmin={3.4V,3.45V,3.5V},vmax= {3.6V,3.65V,3.7V}, while PRBS parameters are from the cross product of the setsimin ={0.575A,1.15A,1.725A}, imax={2.3A,3.45A,4.6A}, respectively. The results show that the discharge model can be used for parameter es- timation purposes with a good accuracy. In three cases, the charge model based estimator returned physically meaningless results. It is probably caused by the wrong structure of the charge model.
−2 −1 0 1 2 3 4
·10−2 2
3 4
R [Ω]
Q[Ah]
Charge Discharge (R, Q)
− 2 − 1 0 1 2 3 4
· 10 − 2 2
3 4
R [Ω]
Q [Ah]
Charge
Discharge (R, Q)
Fig. 6. The point estimates of the charge- and discharge model based estimators. The initial SOC was 50 % in each cases. The actual values of the parameters (R, Q) are denoted by red x (see Table 1). It is apparent, that the discharge model based estimator performs better.
5.2 Excitation
In the second set of experiments the two possible input signal families were compared. Based on the results of the previous experiments, only the discharge process was used for parameter estimation. The excitation parameters are from the same sets used in Section 5.1 before. Fig. 7 clearly shows that the estimators are biased in both cases. The main difference is the variance, it is easy to see that PRBS input results in an estimator with considerably smaller variance.
1.45 1.5 1.55 1.6 1.65
·10−2 2.3
2.31 2.32 2.33
R[Ω]
Q[Ah]
CC-CV PRBS (R, Q)
Fig. 7. The point estimates of the discharge model based estimators for CC-CV and PRBS inputs. The initial SOC was 50 % in each cases. The actual value of the parameters (R, Q) are denoted by a red x. The results show that both CC-CV and PRBS inputs results biased estimators, however, the variance is smaller in the PRBS case.
5.3 Covariances
In the next set of experiments, the approximated value Tr(cov) was investigated as a function of the excitation parameters, which are imin and imax in the PRBS case and imax and vmin in the CC-CV case. Fig. 8 and Fig. 9 show the results of the simulation experiments.
3 4 5
0.5 1
1.5 2
0.12 0.14
imax [A]
imin [A]
a+b
Fig. 8. Approximation of Tr(cov) of the estimator for PRBS excitation over the planeimin−imax.
It can easily be seen from both figures that the value of Tr(cov) poorly depends on the actual excitation parame- ters. However, the average value of Tr(cov) is smaller for the CC-CV based case.
5.4 Bias
In the next set of experiments, the Euclidean distance (8) of the actual parameter pair (R, Q) and the estimated one (Rest, Qest) has been examined with respect to the excitation parameters. It is apparent in Fig. 10 that the dependency of the bias on the discharging current is much higher than on vmin. This can be explained by the structure of the CC-CV input (1). The currentimaxdefines
2.5 2 3.5 3
4 3.3
3.4 3.5
0.12 0.14
imax[A] vmin[V]
a+b
Fig. 9. Approximation of Tr(cov) of the estimator for CC- CV excitation over the planevmin−imax.
2 3
4 3.3 3.35 3.4
3.45 3.5 1
2 3
·10−2
imax [A]
vmin [V]
d
Fig. 10. Euclidean distance between the actual parameter (R, Q) and the estimate in the parameter space R− Qa for CC-CV excitation with different parameters vmin andimax.
3 4 5
0.5 1
1.5 2
1 2 3
·10−2
imax[A]
imin[A]
d
Fig. 11. Euclidean distance between the actual parameter (R, Q) and the estimate in the parameter spaceR−Q a for PRBS excitation with different parametersimin
andimax.
the value of the discharge current, whilevminis only a limit voltage. Increasing the discharge currentmakes the input more exciting from the sense of parameter estimation.
6. CONCLUSION AND FUTURE WORK A simulation based optimal design of battery charge- discharge experiment has been presented in this paper.
The base of the method is a nonlinear charge and a dis- charge model and two possible input signal families, PRBS charging current and CC-CV cycle, respectively. The opti- mality of the experiment design has been investigated with respect to the estimated trace of the covariance matrix and the measure of unbiasedness of a nonlinear least squares parameter estimation.
The results show that the different modes of the hybrid model (1-4) perform differently. Fig. 6 clearly shows, that the discharge model can be used with a higher estimation accuracy.
The second important question was the excitation perfor- mance of the two possible input signal families, PRBS, and CC-CV. It is apparent in Fig. 7 that the estimator is biased for both inputs.
A set of experiments has been performed to analyze the statistical properties of the estimator for different parameters of the two excitation signal families. The results show, that the estimate of the covariance matrix trace norm does not really depend on the excitation parameters neither in the PRBS, nor in the CC-CV case.
However, the CC-CV excitation gives an average value for the trace norm of 0.12 as opposed to the average 0.14 for the PRBS excitation. The Euclidean distance between the actual parameters (R and Q) and the estimate for different excitation parameters has also been generated as an indicator of the unbiasedness of the estimator. The results (Fig. 10 and Fig. 11) show, that the only parameter that has any effect on the unbiasedness isimaxin the CC- CV cycle. So it can be stated that the CC-CV excitation outperforms the PRBS input in both criteria (covariance and unbiasedness).
The future work is twofold. One of the possible directions is to involve parametersE0 andK to the experiment design since they can also hold information about battery health.
On the other hand, the method described in this paper is valid only at one point of the battery life. It cannot even be stated that the same input signal is the best for a half- used battery than that for a new one. That is why further experiments will be performed to analyze this phenomena along the battery life.
REFERENCES
Abdollahi, A., Han, X., Raghunathan, N., Pattipati, B., Balasingam, B., Pattipati, K., Bar-Shalom, Y., and Card, B. (2017). Optimal charging for general equivalent electrical battery model, and battery life management.
Journal of Energy Storage, 9, 47 – 58.
Barr´e, A., Deguilhem, B., Grolleau, S., G´erard, M., Suard, F., and Riu, D. (2013). A review on lithium-ion battery ageing mechanisms and estimations for automotive ap- plications. Journal of Power Sources, 241, 680–689.
Forman, J.C., Moura, S.J., Stein, J.L., and Fathy, H.K.
(2012). Optimal experimental design for modeling battery degradation. InProceedings of ASME Dynamic Systems and Control Conference, volume 1, 309–318.
Kitsos, C. (2014). Optimal Experimental Design for Non- Linear Models: Theory and Applications. SpringerBriefs in Statistics. Springer Berlin Heidelberg.
Liu, Y.H. and Luo, Y.F. (2010). Search for an optimal rapid-charging pattern for li-ion batteries using the
Taguchi approach. IEEE Transactions on Industrial Electronics, 57(12), 3963–3971.
Ljung, L. (1999). Systems Identification: Theory for the user (2nd edition). Prentice Hall Inc.
Lu, L., Han, X., Li, J., Hua, J., and Ouyang, M. (2013).
A review on the key issues for lithium-ion battery management in electric vehicles. Journal of Power Sources, 226, 272–288.
Mathieu, R., Baghdadi, I., Briat, O., Gyan, P., and Vinassa, J.M. (2017). D-optimal design of experiments applied to lithium battery for ageing model calibration.
Energy, 141, 2108 – 2119.
Mendoza, S., Rothenberger, M., Liu, J., and Fathy, H.K.
(2017). Maximizing parameter identifiability of a com- bined thermal and electrochemical battery model via pe- riodic current input optimization.IFAC-PapersOnLine, 50(1), 7314–7320.
Nejad, S., Gladwin, D., and Stone, D. (2016). A systematic review of lumped-parameter equivalent circuit models for real-time estimation of lithium-ion battery states.
Journal of Power Sources, 316, 183–196.
Nelder, J.A. and Mead, R. (1965). A simplex method for function minimization. The Computer Journal, 7(4), 308–313.
P´ozna, A.I., Magyar, A., and Hangos, K.M. (2017). Model identification and parameter estimation of lithium ion batteries for diagnostic purposes. In2017 International Symposium on Power Electronics (Ee 2017), 1–6.
Prochazka, W., Pregartner, G., and Cifrain, M. (2013).
Design-of-experiment and statistical modeling of a large scale aging experiment for two popular lithium ion cell chemistries. Journal of The Electrochemical Society, 160(8), A1039–A1051.
Rezvanizaniani, S.M., Liu, Z., Chen, Y., and Lee, J. (2014).
Review and recent advances in battery health monitor- ing and prognostics technologies for electric vehicle (EV) safety and mobility.Journal of Power Sources, 256, 110–
124.
Rothenberger, M.J., Docimo, D.J., Ghanaatpishe, M., and Fathy, H.K. (2015). Genetic optimization and experimental validation of a test cycle that maximizes parameter identifiability for a li-ion equivalent-circuit battery model. Journal of Energy Storage, 4, 156–166.
Su, L., Zhang, J., Wang, C., Zhang, Y., Li, Z., Song, Y., Jin, T., and Ma, Z. (2016). Identifying main factors of capacity fading in lithium ion cells using orthogonal design of experiments. Applied Energy, 163, 201–210.
Tremblay, O. and Dessaint, L.A. (2009). Experimental val- idation of a battery dynamic model for EV applications.
World Electric Vehicle Journal, 3(1), 1–10.
Zhang, C., Li, S., McLloone, and Yang, Z. (2014). Battery modelling methods for electric vehicles-a review. Euro- pean Control Conference (ECC), 2673–2678.
Zhang, S.S. (2006). The effect of the charging protocol on the cycle life of a Li-ion battery. Journal of Power Sources, 161(2), 1385 – 1391.