1.Ferenc FARKAS, 2.Andras SAPI, 1.Andras MAKAI, 2.Laszlo NAGY,
2.Imre SZENTI, 1.Adam BALINT, 3.David SPALEK
USAGE AND TESTING OF LITHIUM-ION BATTERIES
1.Faculty of Engineering, University of Szeged, H-6724, Mars ter 7, Szeged, HUNGARY
2.Faculty of Chemistry, University of Szeged, H-6720, Rerrich Bela ter 1, Szeged, HUNGARY
3.Faculty of Physics, University of Szeged, H-6720, Dom ter 9, Szeged, HUNGARY
Abstract: A significant development in the automotive industry increasing attention is trending towards electric-powered vehicles. At the same time, people buying activity for electric-powered cars is increasing which causes favorable environmental effects in the city. However, it sets out new challenges to promote its decent operation. Li-ion batteries dominate the rechargeable battery market, but their safety is a major issue that has aroused public concern and attracted the attention of researchers. If a Li-ion battery is short-circuited or exposed to high temperature, exothermic reactions can be triggered, resulting in a self-enhanced increasing-temperature loop known as “thermal runaway”. Our investigation is a part of a project (EFOP- 3.6.1-16-2016-00014) run for four years, which is to reveal opportunities for Li-ion batteries and their testings.
Keywords: Li-ion batteries; Examinations; Testing of cells
INTRODUCTION
The University of Szeged, Faculty of Engineering together with the Szeged Transport Company participate in a HORIZON2020 tender called “ELIPTIC” (Electrification of Public Transport in Cities) research-development project, which was started on 1st June 2015 and ends on 31st May 2018.
The object of this program is to test the battery-driven trolleybuses in battery mode and to extend the trolley bus lines of trolley-wire without configuration, taking advantage of the possibility of self-propelling mode.
With the use of self-propelling, namely trolley wire and battery-trolley buses in more districts of Szeged can be covered where no public transport at night. (1) For the self- propelling mode in Szeged Transport Company 13, IKARUS- SKODA type trolleybuses 575 Kg weight Li-based batteries provide the energy which charges upon the trolley-wire section. When breaking, they are able to save kinetic energy.
So, the vehicle propellant consumption decreases. (2) The driving and braking of the trolleybuses are insured by a 248 KW (337 horsepower) asynchronous electric motor. The modern driven system transforms 600 V direct current trolley-wire voltage for the electric motor into tri-phase alternating current and it charges direct current batteries.
The self-propelling mode among the others made spectacular use of ‘overhead connectors’ necessary for automatic connection of pantographs. The battery needs one hour to fully recharge and the vehicle can go in battery mode more than 7 km with full weight. However, the trolleybuses could reach double of this distance in optimum case.
The average consumption of trolleybuses is 200–250 kWh/100 km which greatly depends on the demand for heating and air conditioning. This number is more favorable for diesel buses (diesel fuel cost is 30–40% of the electric cost). The modern trolleybuses with lower propellant consumption produce less noise pollution than diesel buses and they naturally don’t encumber the urban air with
harmful emissions. The 13 IKARUS-SKODA self-propelling trolleybuses will redeem the burning of 400,000 liters of gasoline in the city in one year. So, this will contribute to clean air. (3) One of the main aims of our new project (EFOP- 3.6.1-16-2016-00014) is testing of this Li-ion trolley battery cells.
TESTING OF LI-ION CELLS
The performance of these two battery types is defined by energy storage, also known as the capacity and the nature of electricity transmission also known as charged or energy.
The energy and power characteristics are determined by the particle size of the electrodes.
The growth of the particles increases the surface area and maximum capacity to reducing the material particles achieves higher performance.
Reducing the particle size reduces the presence of electrolyte filling the cavities. The volume of electrolyte in the cell adjusts the capacity of the battery. Reducing the particle size reduces the cavities between the particles, thereby reducing the electrolyte content. Too little electrolyte reduces the mobility of ions and effects performance.
Energy cells
A lithium-ion energy cell is produced with a maximum capacity to provide long run-times. The Panasonic NCR18650B energy cell (Figure 1) is a high capacity, permanently less when discharged at 2C. At 3V/cell discharge limit, a 2C discharge produces only about 2.3 Ah, a 3.2 Ah site. It is a cell ideal for portable computing and simple easy tasks. The 3200 mAh energy cell was discharged at 0.2C, 0.5C, 1C, and 2C. At 3V/cell line, a circle at 2C indicates the discharge point.
Figure 1. Discharge characteristics of NCR18650B energy cell by Panasonic [https://batteryuniversity.com/]
Power cell
The Panasonic UR18650RX power supply (Figure 2) has a medium capacity and excellent load capacity. Discharge 10A (5C) means minimal capacitance loss at 3V cut-off voltage.
This cell works well and can be used when a high load current is required by power tools. The 1950 mAh cell is discharged at 0.2, 0.5, 1, 2, and 10C. Each reaches a 3V/cell isolation line at approximately 2000 mAh. The power supply has moderate capacity but provides high power.
Figure 2. Discharge characteristics of UR18650RX power cell by Panasonic[https://batteryuniversity.com/]
The gearbox allows continuous 10C discharge. This means that 18650 cells with a nominal speed of 2000 mAh can provide a continuous load of 20A (with 30A Li-phosphate).
Excellent performance is achieved in part by reducing internal resistance and optimizing the surface area of active cells. Low resistance allows high flow with minimal temperature rise. Operating at the maximum allowable discharge current, the Li-ion power cell heats up to approximately 50°C, the temperature is limited to 60°C (140°F).
To meet the load measurements, the package designer can either use an energy cell to meet the discharge C-speed requirement or locate the energy cell and oversize the package. The energy cell has approximately 50% more capacity than the energy cell but the load needs to be reduced. This can be done by oversizing the package. This method is used by the Tesla EV. The battery achieves exceptional runtime, but it is expensive and heavy.
One of the main goals of the research is to optimize the 2.7–
4.2V range of lithium polymer batteries currently in use and given as a factory value. During the optimization not only the life and efficiency of the batteries is the important point, but their high degree of safety and long-term stability play at least as important role. An incorrectly selected voltage range can lead to faster battery failure. In the worst case, overcharging can cause the battery to ignite.
Figure 3. Cell voltage [Szabolcs Szocske Kocsis, Dr. István Lakatos Ph.D.: Investigation of the temperature effects of lithium-
polymer batteries used in electric vehicles during discharge]
Overcharging can damage cells cause significant capacity loss and in some cases can lead to complete battery failure.
To secure the long life of the battery cells or packs, it is necessary to find the voltage range that damages the cells.
Due to the lower immersion range specified by the manufacturers, the batteries become too hot and start to hump. The goal is to select a voltage range that does not involve heating, but approximately 100% of its capacity can be used.
The dynamic performance of a charged and discharged battery is the speed at which power can be taken in and out of the store. The connector voltage rises and falls during charging and discharging. The charge and discharge dynamics of batteries can be characterized by measuring the inputs of constant voltage and discharge current. Figure 4 show the battery at low, medium, and high speeds. A high- speed discharge case indicates that the voltage drops rapidly, so only a portion of the capacity can be used at a high discharge rate.
Figure 4. Jiahui Liu: Charge and discharge characterization of Lithium-ion electrode materials through coin cell testing 2015
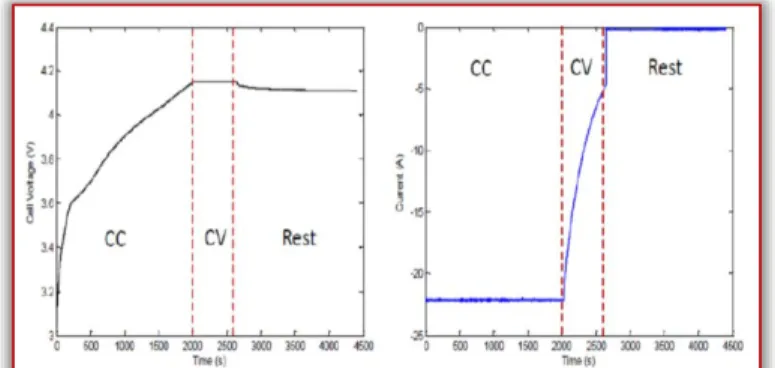
Charging can be controlled by current or voltage. Charging usually consists of constant current (CC) and/or constant voltage (CV) during the charging period. Figure 5 is an example of a CC-CV filling profile. The voltage must be calculated with constant current until the voltage is raised to the constant voltage level. If it is at the beginning of the resume charge, the current will be too high and an excessive temperature rise may occur. As soon as the voltage has reached the desired voltage, CV charging will start and the current will decrease. If we simply charge the cell to the desired voltage and then interrupt the current, the voltage of the cell is likely to drop and eventually stabilize to a value lower than the desired voltage, indicating that the cell was not fully charged.
Figure 5. Jiahui Liu: Charge and discharge characterization of Lithium-ion electrode materials through coin cell testing 2015 During the charging period, the battery is first charged with constant current, and then voltage increases. Charge with constant voltage after the battery voltage has reached a fixed value. During constant voltage charging, the battery current gradually decreases. The battery will stop charging when the current reaches the end of the charging current. The discharge voltage and current curve will be displayed during the discharge period after charging are complete. During discharge, the voltage gradually decreases under constant current. The battery will stop discharging when the voltage reaches the final discharge voltage. We can see that the capacity of the Li-ion battery in the package gradually decreases through repeated charging and discharging cycles.
Figure 6. Kazuhiko Takeno, Masahiro Ichimura, Kazuo Takano, Junichi Yamaki, Shigeto Okada: Quick testing of batteries in Lithium-ion battery packs with Impedance measuring technology
2004
Figure 6 shows the change in the voltage curves in a Li-ion battery pack due to capacity degradation for 350 cycles. Each curve was plotted by measurement after 1-350 charge and discharge cycles. Figure 6 shows the capacity of the battery between the cycles of 1 and 350 cycles of 3 samples. It can be seen from Figure 6 that the discharge time and battery capacity decrease with the increasing number of cycles.
Figure 7. Long-term 100 – 350 cycles measurement results [https://ec-labor.hu/li-ion-akkumulatorok-tesztelese/]
During this time, the capacity of the batteries has decreased by 20% compared to the initial level. But, the comparison of the two figures shows that batteries with a higher initial short-term capacity performed better. The simplest explanation for this is that the fewer side reactions that occur during charging/discharging, the closer the CE value is 10,000. If there is a very little side effect in the current, there is no reason to degrade the battery parameters during multiple cycling/discharge and the battery life will increase.
The self-discharge mechanism must be considered during the manufacture. It depends on the corrosion and contamination of the electrodes and develops in changes in self-discharge not only from each dose but also from the cells.
The quality manufacturer checks the self-emptying of each cell and rejects those that exceed the tolerances.
Regular charging and discharging caused unwanted lithium metal deposition on the Li-ion anode (negative electrode), which causes a loss of capacity due to depletion of the lithium stock and the possibility of internal short-circuiting.
Internal short-circuiting is often preceded by increased self- discharge, and further research is needed in this area to determine what level of self-discharge can cause a hazard that can lead to heat leakage. Unwanted lithium deposition also increases internal resistance which reduces charging capacity.
Figure 8 compares the self-discharge of a new Li-ion cell with a cell that performed forced deep discharges and with a cell that was completely emptied, short-circuited for 14 days, and then recharged. A cell exposed to a deep discharge of more than 2.5V/cell shows a slightly higher self-discharge than a new cell. The highest self-discharge is seen on the cell stored at zero volts. Cells that had been stressed with deep discharges and kept at 0V show a higher self-discharge than a new cell.
Figure 8. Self-discharge of new and stressed Li-ion cells [https://batteryuniversity.com/]
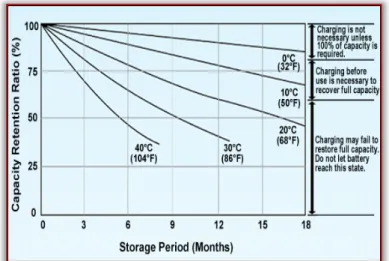
Figure 9 illustrates the self-discharge of a lead-acid battery at different temperatures. At room temperature 20 °C, self- discharge is around 3% and the battery can be stored for 12 months without recharging. The warm temperature at 30 °C, self-discharge will increase and recharge after 6 months.
Leaving the battery below 60% carbon dioxide for a while can cause sulfation.
Figure 9. Self-discharge of the lead-acid battery as a function of temperature Lead-acid should never drop below 60% SoC.
Charge more often when warm [https://batteryuniversity.com/]
Cycle life
The effects of voltage and temperature on cell damage are usually inadvertently evident, but their effect on cycle life is less obvious. We have seen above that effects outside the recommended operating window can cause irreversible loss of capacity in cells. The cumulative effect of these abnormalities is as if it were a contraceptive disease that affects cell life or in the worst case causes sudden death if the mark is exceeded.
In the above figure, the service life gradually decreases when working at a lower temperature <15°C and above 50°C.
However, at 70°C, there is a risk of thermal release. The battery heat treatment system should be designed to operate in a sweet place at all times to avoid premature wear of the cells.
Figure 10. Cycle life versus temperature [https://www.mpoweruk.com/lithium_failures.htm]
MATERIAL AND METHOD
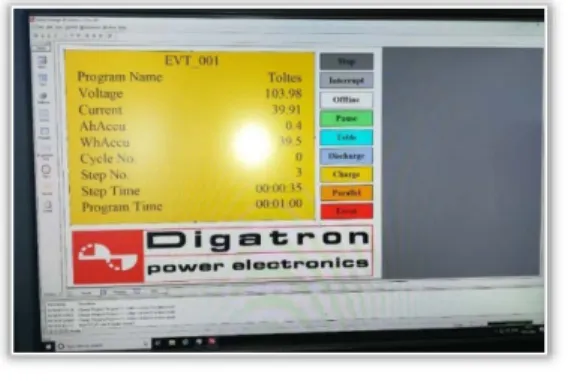
The DIGATRON battery charger and tester (Figure 11) had been installed last November to it’s temporary position in the „Szeged Transport Company” site, but the owner it is the University of Szeged. The final position and installation of the device will be in the „Competence centre of vehicle industry” of our university that is due to be finished in December 2022. The commissioning and user training activity had been carried out by the employees of the supplier company that is the Energotest Kft.
Figure 11. DIGATRON BE 300-600
Figure 12. Specifications
Installation of an electrical load unit
The result of the continuous negotiation with the SZKT leaders, a 1-year loan of the Trolley battery package consisting of 120 Li-ion cells was secured on March 6, 2020.
The electrical connection of the “drawer” that allows to connect the first 30 cells is shown in Figure 13.
The first test of the battery pack had been carried out 25 March 2020
Figure 13. Connection of the 30 cells
The values of the technical parameters specific to the current operating status are displayed on the screen of the battery charger in accordance with the color markings.
Figure 14 shows the measuring image of the "Charging"
function in yellow base color.
Figure 14. Charging function
Various parameters (values of loads and time intervals) can be pre-set on the tester, on the basis of which the device performs the specified operating cycles.
In Figure 15, a factory pre-set, so-called. ”Test-1” cycle can be seen. Firstly, the machine had been operated with these settings, of course, it is also possible to specify different parameters.
Figure 15. Test 1 settings
Equipment operation
≡ Battery cell monitoring program
The two electrical cabinets have 25 measuring panels (Figure 16). Each measuring panel can measure the voltage of up to 12 elemental cells simultaneously.
The measured voltage of a cell is referred to in the program as the cabinet ID, the measurement panel ID, and the cell signal ID within the panel. Because data from 300 cells can be measured, but only a limited number of cell names can be printed, the names of cells that can be displayed on printing are limited to 60 (in 3 columns).
An item in the list has 3 data. The value is the colour (which colours the display column according to the voltage), the background colour (which colours the background of the display column), and the voltage value (which tells you that the given colour code is valid up to this voltage value).
Screen elements:
1: List of main data of previously completed data recordings.
2: A list of elementary cell data recorded in the selected measurement.
3: Graphical (chart) display interface of the selected measurement and controls that change the display.
In the upper half of the screen, the data of the previously completed data recordings are shown in a table.
Figure 16. Cell data (V)
Using the “SCOPE” module of the battery tester The use of the Scope module in the "Battery Tester" was introduced during the training.
It is a module for tracking, displaying, analysing and exporting displayed data in a device controlled by user software.
As of some modes record and store all of the displayed data in the computer's memory, under certain circumstances, it can cause that other programs that run on your computer may slow down due to significant memory usage or, in extreme cases, the program can crash.
The scope module has 3 main parts (Figure 17). The data display section (1), where the data of the selected channels is displayed and drawn by the module. The setting panel (2), where the channels to be monitored can be selected and their display characteristics can be set. The control panel (3), where the various functions of the scope can be accessed and the basic characteristics of the operation can be set.
The adjustment and control panels can be removed from the display area with a red X in the upper right corner of both panels as and if needed. Later, of course, it can be displayed
again if required (right-click on the display area and then select the appropriate menu item). The settings panel can be displayed on both the right and left side, depending on which side of the module you right-click on.
Figure 17. The Scope module
During use, the first step is to select the channels to be monitored. The display parameters can be adjusted of the selected channels according to the needs and visibility (colour, line thickness, Y range, etc.).
The operating mode of the scope must be selected, it also determines the way the data is displayed and hot the graphs are drawn.The sampling frequency must be set, so it will affect the detail of the curves that appears. The scope function (data recording and display) must be started. The scope must be left on for the desired time, then the scope function must be stopped, at which point the data recording will also stop.
The recorded data can be analysed and evaluated in detail, even with magnification. If required the measured data can be exported in CSV format.
In operation, the X axis of the chart is the location of the upper half of the drawing area. The X axis shows the time schedule.
Figure 18. Selecting the channels
The Y-axis shows the range and scale values of a certain channel to be displayed, which often differ from the Y-axis characteristics of other channels. The Y axes of the other channels can be displayed as required, so that the Y axes of several channels can be displayed at the same time. The colour of the drawn Y-axis and the scales is the same as the colour selected by the added channel. In addition, the name of the displayed Y-axis channel is displayed vertically on the left side of the Scope window. (Figure 18)
The original software did not include so-called “Test report,”
at our request, was prepared by the program development engineer afterwards. This is shown in the figure below.
(Figure 19)
Figure 19. Test report RESULTS
After exporting the data using the Energotest program, the given file format has a .CSV extension. The serial number of the examined data is 0044, the measurement name is “Test measurement”, and the measurement note is “Measurement of a presumably bad cell”. Based on the data, the length of the test is 1334 seconds, during which time the instrument recorded 234,258 data sets. This would be too much and presumably redundant data for analysis, so only every 10th data was included in the CSV format, representing 23,425 data sets. Based on these data, 0.057 seconds elapsed between recordings of each data set, resulting in a recording frequency of 17.56Hz.
The diagram of the Energotest interface below clearly shows that most cells have the correct voltage, however, one cell is faulty. For easier analysis, the exported data is transferred to the Origin software so that individual cells can be analysed individually.
Figure 20. The diagram of the Energotest interface It is worth examining the imported values of the 3 panels separately, in order to get a more accurate picture of the values of each cell, and thus to make the values easier to see.
Cabinet #1
All 12 cells of the panel can be displayed on a graph, as they have no protruding data points, the voltage of all cells is between 3.26V and 3.44V. Plotted on a graph, the “X” axis symbolizes time (ms) and the “Y” axis represents the current voltage (V). Since there are no values outside the 3.26V and 3.44V ranges, these values are the limits of the “Y” axis.
Figure 21.Panel 2 in Cabinet #1
Figure 22.Panel 1 in Cabinet #1
Similar to panel #1, the results of cell #2 can be represented in a similar way, it can be seen here that not all cells have the same voltage, or at least approximately the same.
For panel #2, the presumed defective cell is cell #6. Its voltage values can be seen in the figure, but when examined separately, it shows a more transparent result. Its initial value is 0V, and highest value is about 2.4V, which is way smaller than the other cells, and the initial value also indicates a faulty cell.
Figure 23.Panel 2 in Cabinet #1
The graph below shows the cell values in panel #3. Similar to panel #1, no bad cell was found. Higher limits can be observed for cell number 1, this cell is worth paying attention later on. The limits for all cells range from 3.2V to 3.55V so they can be plotted.
Figure 24.Panel 3 in Cabinet #1
Cabinet #2
The figure below clearly shows that the voltage of the cells is very similar, so presumably all the cells are in good condition.
The limits for all cells are between 3.3V and 3.6V, so these two values are the limits for the “Y” axis.
Figure 25.Panel 1 in Cabinet #2
Figure 26.Panel 2 in Cabinet #2
As with panel 1, panel 2 does not have a faulty cell. Limits for all cells are between 3.3V and 3.6V, these are “Y” limits, no out-of-range value found.
For panel #3, similar to panels #1 and #2, no faulty cell was found. Their values fall between 3.3V and 3.6V, these 6 cells do not have any outstanding values, so they can be considered good cells.
Figure 27.Panel 3 in Cabinet #2
Cabinets #3 and #4
In the case of cabinets #3 and #4, similarly to cabinet #2, there are no faulty or weaker cells.
Figure 28.Panel 1 in Cabinet #3
Figure 29.Panel 2 in Cabinet #3
Figure 30.Panel 3 in Cabinet #3
The graphs below show the voltages of the cells in the first, second, and third panels of cabinet #3. No outliers were found, cells have nearly the same values.
The diagrams below show the cell values in Cabinet #4. In this case, too, the value of all the cells can be said to be good, but there are a few slightly weaker cells that will pay attention later.
For Panel 1, these two cells are #5 and #6. For panel #2, no weaker cell was found. In the case of Panel #3, no weaker cell can be observed either
Figure 31.Panel 1 in Cabinet #4
Figure 32.Panel 2 in Cabinet #4
Figure 33.Panel 3 in Cabinet #4
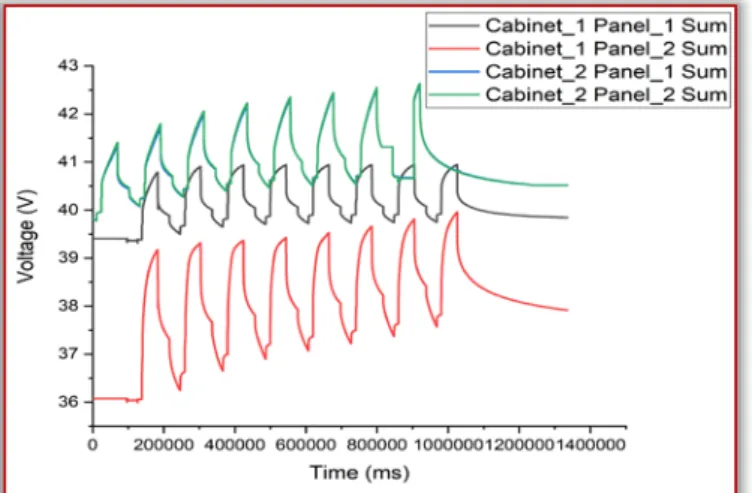
It is also worth checking the total voltage of each panel. In this case, the first two cells of cabinets #1 and #2 should have similar values, and the panel values 3-3 of the two cabinets are also nearly identical. This is because there are 12-12 cells for panels 1 and 2 and 6 cells have been tested for panels #3.
However, cell 6 of panel 2 of the cabinet 1 is defective, so the total voltage of this panel is also less than that of the other three. This difference is clearly seen in the figure below.
Figure 34.Cabinet #2
For both cabinets, it is advisable to display panels 1 and 2 separately from panel 3, so that the values are more transparent.
Figure 35. Panels 1 and 2 in Cabinet #1 and in Cabinet #2
In the case of cabinet #2, the difference between the total voltages of panels #1 and #2 is very small, therefore not possible to distinguish between the two data sets. To do this, this should be plotted on a separate graph.
Figure 36. Panels 1 and 2 in Cabinet #4
As there is no faulty cell in cabinet #3 and #4 no separate sum of panel’s voltage are required. Below the graph shows all the total voltage of 12 panel’s in the 4 cabinets.
As an overview picture of the health of all cabinets, each panel’s sum of voltage are## plotted in one graph. On this graph it is also visible that due to the faulty cell in cabinet #1, panel #2, cell #6 the panel’s initial value significantly lower compared with the others.
Figure 37. An overview of the health of all cabinets SUMMARY
While using the lithium-ion battery, we need to monitor the voltage and intension electronics. Moreover, to build a reliable and higher voltage battery, we also need to prepare for pre-charging and discharging circuits, insulation testing, and error monitoring.
Several factors can cause the failure of Li-ion batteries, some of which only result in malfunction, while others can lead to the explosion of the batteries, which is a serious danger to the users. Short-circuited, overcharged, or over-discharged batteries, for example, can enter a dangerous self-inducing exothermic reaction cascade, known as thermal runaway.
The study also highlighted the importance of using something like high performance battery tester equipment.
Acknowledgment
This project has received funding from the EFOP-3.6.1-16-2016- 00014, many thanks for it.
References
[1] Gál J. – Tóth I.T. – Véha A. - Keszthelyi-Szabó G.: Hibrid trolikkal a kulturális és szakmai programokra
[2] Gál J. – Tóth I. T.: Közösségi közlekedés színvonalának utas elégedettségi vizsgálata – előfelmérés Szegeden [3] Jiahui Liu: Charge and discharge characterization of
Lithium-ion electrode materials through coin cell testing 2015
[4] Kazuhiko Takeno, Masahiro Ichimura, Kazuo Takano, Junichi Yamaki, Shigeto Okada: Quick testing of batteries in Lithium-ion battery packs with Impedance measuring technology 2004
[5] Náday A. –Újhelyi N.: ] Kiemelt önjárások 2016-ban, Összefoglaló anyag, SZKT, Szeged, 2016.
[6] Sz. Szocske Kocsis-I. Lakatos: Investigation of the temperature effects of lithium polymer batteries used in electric vehicles during discharge. ISBN 978-963-88875-3- 5 2015
[7] https://batteryuniversity.com/learn/article/discharge_cha racteristics_li
[8] https://batteryuniversity.com/learn/article/elevating_self_
discharge
[9] https://ec-labor.hu/li-ion-akkumulatorok-tesztelese/
[10] https://www.mpoweruk.com/lithium_failures.htm
ISSN: 2067-3809
copyright © University POLITEHNICA Timisoara, Faculty of Engineering Hunedoara, 5, Revolutiei, 331128, Hunedoara, ROMANIA
http://acta.fih.upt.ro