Temperature dependent dynamics in water-ethanol liquid mixtures
Szilvia Pothoczki1. László Pusztai1.2 and Imre Bakó3
1Wigner Research Centre for Physics, Hungarian Academy of Sciences, H-1121 Budapest, Konkoly Thege M. út 29-33., Hungary
2International Research Organization for Advanced Science and Technology (IROAST), Kumamoto University, 2-39-1 Kurokami, Chuo-ku, Kumamoto 860-8555, Japan
3Research Centre for Natural Sciences, Hungarian Academy of Sciences, H-1117 Budapest, Magyar tudósok körútja 2., Hungary
Abstract
Temperature dependent hydrogen bond energetics and dynamical features, such as the diffusion coefficient and re-orientational times, have been determined for ethanol-water mixtures with 10, 20 and 30 mol % of ethanol. Concerning pairwise interaction energies between molecules, it is found that water-water interactions become stronger, while ethanol-ethanol ones become significantly weaker in the mixtures, than the corresponding values characteristic to the pure substances. Concerning the diffusion processes, for all concentrations the activation barrier of water and ethanol molecule become very similar to each other. Re-orientational motions of water and ethanol become slower as ethanol concentration is increasing. Characteristic re-orientational times of water in the mixtures are substantially longer than these values in the pure substance. On the other hand, this change for ethanol is only moderate. Re-orientational motions of water (especially the ones related to the H-bonded interaction) become very similar for those of ethanol in the mixtures.
1. Introduction
Aqueous binary mixtures are of great importance in chemistry and biology. Mixtures of water and alcohols are among the simplest materials in which there is a competition between hydrophobic and hydrophilic (hydrogen-bonding) interactions in defining the properties of the system. It is also well-known that thermodynamic and transport properties (diffusion coefficient, reorientation correlation time) of their mixtures show an anomalous behavior [1-15]. The anomalies of liquid water are more pronounced in the low temperature regime [16-19]. In most cases, analogous non-ideal behaviour is more pronounced (showing minima or maxima) in the low alcohol concentration region. Despite the large efforts in order to construct a well-defined atomistic picture [20-27] and a molecular-scale understanding of their behavior, no single, widely accepted model exists for these liquid mixtures.
Perturbation of the hydrogen-bond (HB) network is thought to be one of the reasons behind these anomalous properties. One of the first explanations was proposed by Frank and Ewans [1], suggesting the formation of an ‘iceberg’ (clathrate) like hydration shell around the hydrophobic moiety of the alcohol molecule. In this shell the strength of H-bonds would be significantly stronger than in bulk water. There are quite a lot of theoretical and experimental evidence for [1,5,7,8,14] and against [12,15] this model in the literature. Furthermore, it is known that near the hydrophobic surface the translational and orientational motions of water molecules are retarded.
Some of the authors connected the activation energy of the re-orientational motion to the energy of H-bond breaking [35,43,50].
Quite recently we studied the structural changes in methanol and ethanol-water mixtures as a function of temperature in the water rich region [28,29]. In these works we focused mainly on the changing properties of cyclic entities. We found in both systems that the number of hydrogen bonded rings has increased with lowering the temperature. However, for ethanol-water mixtures the dominance of not the six-, but of the five-fold rings could be observed.
One of the main goals of the present work is to describe changes of the interaction energy between the constituent molecules. To this end, we explore more accurately the energetics of the interactions around water and ethanol molecules in 2 dimensions (OO distance and energy). We also study that how some important dynamical properties (diffusion constant, reorientation correlation times) change as a function of the temperature in these mixtures.
2. Computational details
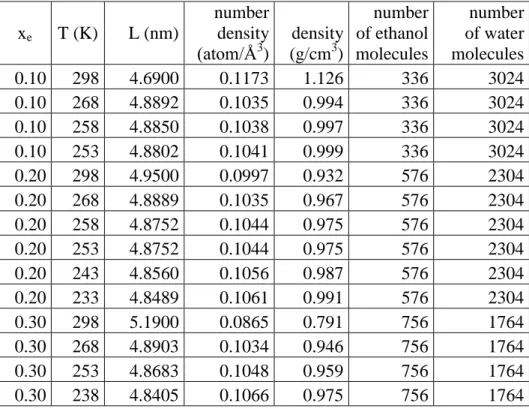
All the molecular dynamics simulations were performed by the GROMACS simulation package [30] (version 5.1.1), using the leap-frog algorithm for integrating Newton's equations of motion, with a time step dt=2 fs. Essential simulation parameters of the models (box lengths, number of ethanol and water molecule) are listed in Table 1.
Table 1 Temperatures, box lengths, number densities and bulk densities of the simulated systems.
xe T (K) L (nm)
number density (atom/Å3)
density (g/cm3)
number of ethanol molecules
number of water molecules
0.10 298 4.6900 0.1173 1.126 336 3024
0.10 268 4.8892 0.1035 0.994 336 3024
0.10 258 4.8850 0.1038 0.997 336 3024
0.10 253 4.8802 0.1041 0.999 336 3024
0.20 298 4.9500 0.0997 0.932 576 2304
0.20 268 4.8889 0.1035 0.967 576 2304
0.20 258 4.8752 0.1044 0.975 576 2304
0.20 253 4.8752 0.1044 0.975 576 2304
0.20 243 4.8560 0.1056 0.987 576 2304
0.20 233 4.8489 0.1061 0.991 576 2304
0.30 298 5.1900 0.0865 0.791 756 1764
0.30 268 4.8903 0.1034 0.946 756 1764
0.30 253 4.8683 0.1048 0.959 756 1764
0.30 238 4.8405 0.1066 0.975 756 1764
All simulations used the ‘all atom type’ OPLS-AA potential [31] for ethanol and the SPC/E [32] model for water. The cut-off radius for non-bonded interactions was set to 1.1 nm. All the simulations have been conducted with N>1000 molecules. In an earlier study, Gereben et al.
showed [33] that such a system size may be used to study the dynamical properties of water.
Initially, an energy minimisation procedure was performed for each composition at room temperature, using the steepest descent method. This was followed by a 5 ns equilibration run in the NPT ensemble; the temperature and pressure were controlled by a Berendsen thermostat and barostat [34], with temperature coupling time constants set to 0.1 ps and 0.5 ps, respectively.
Following this long equilibration procedure, additional 1 ns production runs in the NVT ensemble were carried out, in which particle configurations were saved after every 10 steps for additional statistical analyses.
The diffusion coefficient (D) was estimated using the Einstein-Smoluchowski relation, from the mean squared displacements of the centres of mass of water and ethanol molecules:
𝐷 = lim𝑡→∞ 1
6𝑁𝑡⟨∑𝑁𝑖=1(𝑟𝑖(𝑡) − 𝑟𝑖(0))2⟩ (1) where ri(t) and ri(0) are the positions of the centres of mass of water or ethanol molecules at time t and 0, respectively, and the … denotes an ensemble average. The effect of using every x-th saved configuration (x=1,5,20) during the MSD calculation was negligible, as it has already been shown by Gereben et al. [33] for the SPC/E water model.
Reorientational dynamics have been characterized by the autocorrelation functions:
𝐶𝑙(𝑡) = ⟨𝑃𝑙(𝑒(𝑡) ∙ 𝑒(0) ⟩ (2)
where 𝑒(𝑡) is the unit vector along a well-defined molecular axis (O-H vector, perpendicular to the HOH water molecular plane, or C1C2O ethanol plane) and Pl is the l-th Legendre polynomial.
The characteristic decay time C2(𝑂𝐻(𝑡)) is measurable using NMR experiments [35]. The decay time of these autocorrelation functions, , is estimated by computing the integral of Cl(t) with respect to time, that is:
𝜏 = ∫ 𝐶𝑙
∞
0 (𝑡)𝑑𝑡 (3)
3. Results and Discussions 3.1 Energy distributions
A deeper analysis of the composition and temperature dependence of the strength of intermolecular associations of water and ethanol molecules can be performed by studying the pair energy (Coulomb + Lennard-Jones terms) distributions. The computed pair energy distributions for pure ethanol and SPC/E water are shown in Fig.1.
Fig.1. Pair energy distributions for pure liquid ethanol and water as a function of temperature
The pair energy distribution of H-bonded liquids has a characteristic shape, with (1) a spike near 0.0 kcal/mol that represents the interaction with distant molecules in the bulk, and (2) a low energy band for hydrogen bonded neighbors (following the first well defined minimum). The distribution of pair energies for water-water (‘wa-wa’) and ethanol-ethanol (‘et-et’) interactions in pure water and ethanol exhibits peaks at negative values of Eij at −5.4–6.0 kcal/mol, where the position of maxima decreases with decreasing temperature. We were able to identify a minimum after the first maximum for water and ethanol at 3.0 and 2.4 kcal/mol, respectively. The average
-10 -8 -6 -4 -2 0 2 4
298 K 268 K 233 K
P(E)
E(kcal/mol) ethanol
-6 -4 -2 0 2 4
298 K 268 K 233 K
P(E)
E(kcal/mol) water
pair interaction energy of ethanol molecules that corresponds to the strongly interacting (H- bonded) dimers changes from -5.4 kcal/mol to -5.8 kcal/mol as the temperature is decreased from 298 K to 233 K. The same quantity for water changes from -5.03 kcal/mol to -5.23 kcal/mol over the same temperature range.
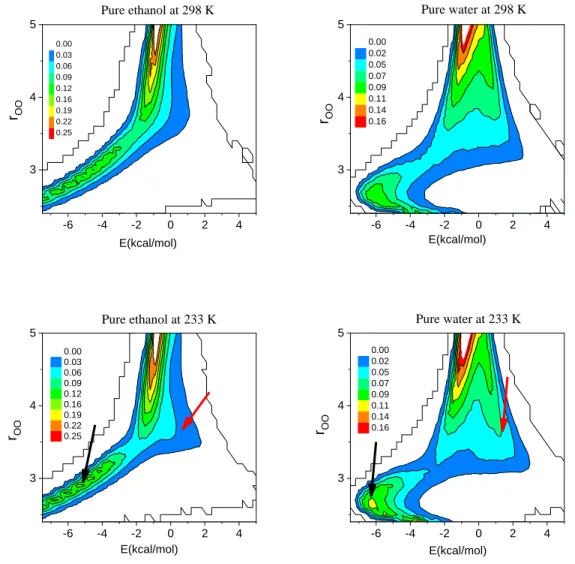
In order to better understand these changes we have calculated the O-O distance-energy distribution for pure liquid water and ethanol; these data are presented in Fig. 2. A significant change, in terms of the intensity, can be observed for both H-bonded ethanol dimers and water dimers (denoted by black arrows) as temperature decreases. Additionally, another noticeable change (denoted by red arrows) is apparent at around 3.6 Å and +1.0 kcal/mol, for both pure liquids.
Fig. 2. Distance-pair energy distributions for pure liquid ethanol and water at 298 and 233 K. The positions where significant changes may be detected are denoted by black and red arrows.
-6 -4 -2 0 2 4
3 4 5
E(kcal/mol)
rOO
Pure ethanol at 298 K
0.00 0.03 0.06 0.09 0.12 0.16 0.19 0.22 0.25
-6 -4 -2 0 2 4
3 4 5
rOO
E(kcal/mol) 0.00
0.02 0.05 0.07 0.09 0.11 0.14 0.16
Pure water at 298 K
-6 -4 -2 0 2 4
3 4 5
E(kcal/mol) 0.00
0.03 0.06 0.09 0.12 0.16 0.19 0.22 0.25
Pure ethanol at 233 K
rOO
-6 -4 -2 0 2 4
3 4 5
E(kcal/mol)
rOO
0.00 0.02 0.05 0.07 0.09 0.11 0.14 0.16
Pure water at 233 K
These distance-pair energy distributions allow us to find more precise energetic criteria for H-bond definition, applicable during studies of also mixtures of ethanol and water. This is demonstrated in Fig. 3: a threshold at about -3.0 kcal/mol may be set for a proper H-bond definition for each (water-water, ethanol-ethanol and ethanol-water) pair. In pure liquid water, this is also an accepted value for H-bond definition [36].
Fig. 3 Average ethanol-ethanol, water-water (upper left panel) and ethanol-water (lower left panel) pair energies, as well as and their distributions (right panels; for one composition only) for ethanol-water mixtures, as a function of temperature.
230 240 250 260 270 280 290 300 -6.0
-5.8 -5.6 -5.4 -5.2 -5.0 -4.8
ethanol xe=0.1 xe=0.2 xe=0.3 ethanol-ethanol
230 240 250 260 270 280 290 300 -5.4
-5.2 -5.0
E(kcal/mol)
water xe=0.1 xe=0.2 xe=0.3 water-water
T (K)
E(kcal/mol)
230 240 250 260 270 280 290 300 -5.4
-5.3 -5.2 -5.1 -5.0 -4.9
E(kcal/mol)
xe=0.1 xe=0.2 xe=0.3
T (K) ethanol-water
-8 -6 -4 -2 0 2 4
-8 -6 -4 -2 0 2 4
P(E)
298 K 268 K 253 K xe=0.1
etet
298 K 268 K 253 K
P(E)
E(kcal/mol) xe=0.1
wawa
-10 -8 -6 -4 -2 0 2 4 6 8 10
298 K 268 K 253 K
P(E)
E(kcal/mol) xe=0.1
etwa
The average pair interaction energies have also been calculated for the mixtures (Fig. 3).
These energy values become more negative on decreasing temperature. Note also that water- water interactions become stronger, while ethanol-ethanol ones become significantly weaker in the mixture than the corresponding values characteristic to the pure substances. The strong composition dependence of the alcohol-water interactions is also worth pointing out: the like pairs do not provide any clue that the mixed pair in the most dilute mixture would be so distinctly different from what is obtained in the 20 and 30 ethanol molar % solutions.
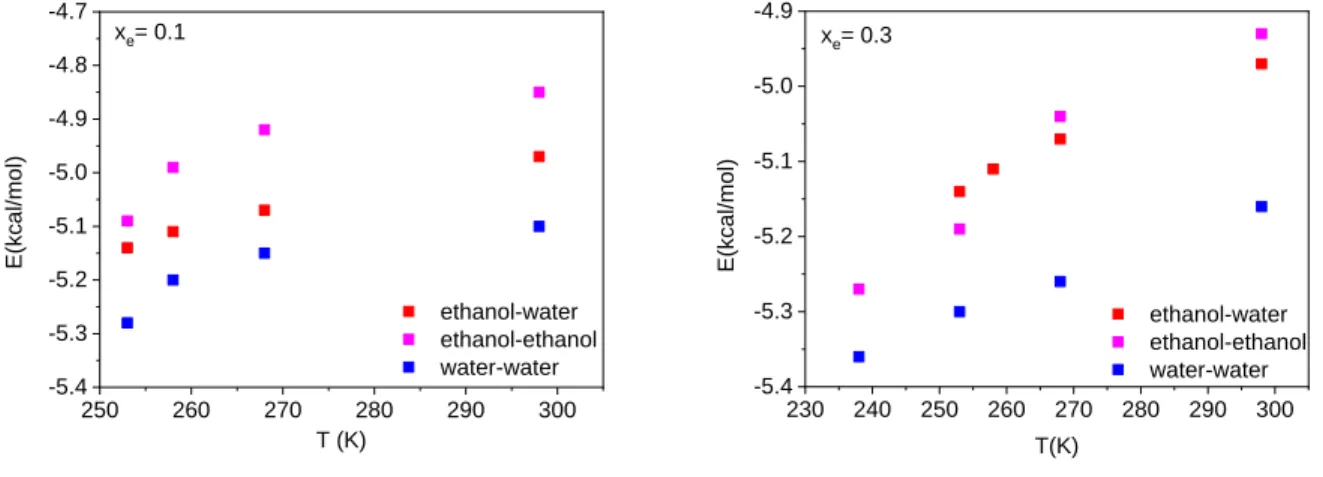
In order to provide information on the composition dependence, average pair interaction energies for ethanol-ethanol, water-water and ethanol-water pairs have been calculated and compared at the two extremum concentrations (Fig. 4). Water-water interactions have turned out to be the strongest ones, independently of the concentration. On the other hand, interactions between ethanol molecules are the weakest at low ethanol concentration; with increasing concentration, however, they become very similar to ethanol-water interactions.
Fig. 4 Average ethanol-ethanol, ethanol-water and water-water pair energies as a function of temperature for mixtures with ethanol mole fractions xe=0.1 and 0.3.
250 260 270 280 290 300
-5.4 -5.3 -5.2 -5.1 -5.0 -4.9 -4.8 -4.7
E(kcal/mol)
ethanol-water ethanol-ethanol water-water T (K)
xe= 0.1
230 240 250 260 270 280 290 300 -5.4
-5.3 -5.2 -5.1 -5.0 -4.9
E(kcal/mol)
ethanol-water ethanol-ethanol water-water
T(K) xe= 0.3
Fig. 5 presents the 2D (distance-energy) distributions for ethanol-water mixtures: variations that may be detected are similar to what we have already seen for pure water and ethanol (cf.
Fig.2).
Fig. 5. Distance-pair energy distributions for the liquid mixture with 20 mol % of ethanol at 298 and 233 K. Positions where changes could be detected are denoted by black and red arrows.
-6 -4 -2 0 2 4 3
4
5 Ethanol-ethanol for xe=0.2 at 298 K
rOO
E(kcal/mol) 0
0.02300 0.04600 0.06900 0.09200 0.1150 0.1380 0.1610 0.1800
-6 -4 -2 0 2 4
3 4
Ethanol-ethanol for xe=0.2 at 233 K
rOO
E(kcal/mol) 00.02300
0.04600 0.06900 0.09200 0.1150 0.1380 0.1610 0.1800
-6 -4 -2 0 2 4
3 4 5
Water-water for xe=0.2 at 298 K
r OO
E(kcal/mol) 00.02300
0.04600 0.06900 0.09200 0.1150 0.1380 0.1610 0.1800
-6 -4 -2 0 2 4
4
Water-water for xe=0.2 at 233 K
rOO
E(kcal/mol) 0
0.02300 0.04600 0.06900 0.09200 0.1150 0.1380 0.1610 0.1800
-6 -4 -2 0 2 4
3 4 5
Ethanol-water for xe=0.2 at 298 K
rOO
E(kcal/mol) 00.02000
0.04000 0.06000 0.08000 0.1000 0.1200 0.1400 0.1600
-8 -6 -4 -2 0 2 4
3 4 5
Water-ethanol for xe=0.2 at 233 K
rOO
E(kcal/mol) 0
0.02000 0.04000 0.06000 0.08000 0.1000 0.1200 0.1400 0.1600
3.2 Re-orientational correlations
The re-orientational relaxation dynamics of liquid water and ethanol have been investigated recently by theoretical and experimental methods alike [35, 37-42]. Here we characterize the re- orientational dynamics of ethanol and water molecules by autocorrelation functions of the OH- groups and of vectors normal to the HOH (water) and CCO (ethanol) plane, as described in the
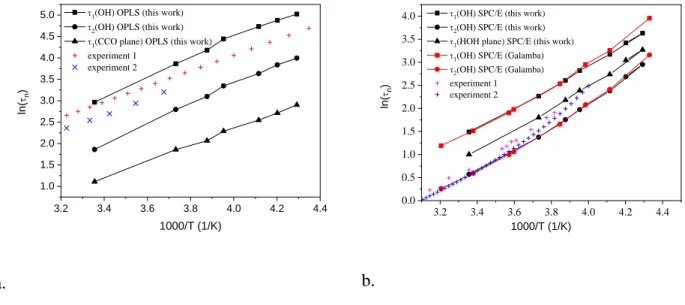
‘Methods’ section. From the C2(OH)(t) function we can calculate a characteristic time which is directly related to the experimentally available reorientation time from NMR [38-41]. The calculated re-orientational times, together with the same data from other simulations, and also experiments, for liquid ethanol (a) and water (b) are presented in Fig. 6.
Fig. 6. Reorientational correlation times for pure ethanol (OPLS) and water (SPC/E) as a function of 1000/T. Experiment 1 on CD3CD2OH: [40,41]; experiment 2 on CH3CH2OD [42];
experiment 1 on water: [38]; experiment 2 on water: [39,41]; simulation on water by Galamba:
[37].
3.2 3.4 3.6 3.8 4.0 4.2 4.4
1.0 1.5 2.0 2.5 3.0 3.5 4.0 4.5
5.0 1(OH) OPLS (this work)
2(OH) OPLS (this work)
1(CCO plane) OPLS (this work) experiment 1
experiment 2
ln(n)
1000/T (1/K)
a.
3.2 3.4 3.6 3.8 4.0 4.2 4.4
0.0 0.5 1.0 1.5 2.0 2.5 3.0 3.5 4.0
1000/T (1/K)
1(OH) SPC/E (this work)
2(OH) SPC/E (this work)
1(HOH plane) SPC/E (this work)
1(OH) SPC/E (Galamba)
2(OH) SPC/E (Galamba) experiment 1 experiment 2 ln(n)
b.
Clearly, the 2 re-orientational correlation times from an earlier simulation, using the SPC/E water model, could be reproduced reasonably well over a broader temperature range. Deviations from experiments over this range are ca. 10 to 20 %. (The difference is larger at low temperature.) The re-orientational correlation time 1 of the HOH plane is significantly shorter than the same quantity for the OH unit vector (1OH/1HOH is in the range of 3-6), which strongly suggest the existence of a well-defined rotational anisotropy in liquid water; this is in good agreement with the experimental evidence. The calculated activation energy for 2 is about 21.2 (±0.8) kJ/mol from the present simulation, and 19.6 (±0.4) kJ/mol from experimental data.
Calculated re-orientational times for liquid ethanol, together with the available experimental data for liquid CD3CD2OH and CH3CH2OD, as a function of 1000/T, are presented in Fig. 6a. The calculated activation energies from the various experiments and from the present
MD results are 15.1 kJ/mol, 16.8 kJ/mol, and 18.9 KJ/mol for CD3CD2OH (experiment) [40,41], CH3CH2OD (experiment) [42], and for CH3CH2OH (in our present simulation), respectively. The
2 values from simulation are significantly smaller (about ½-th or 1/3-th) than the corresponding experimental values (see Fig. 6a). There are at least two different reasons for this behavior: (a) problems with the potential – OPLS-AA significantly underestimated this quantity, and (b) the NMR experiments were performed on liquid CD3CD2OH and CH3CH2OD, but not on liquid CH3CH2OH.
The average integrated decay times, 1, for the OH bond and for the vector normal to the CCO or HOH plane are significantly different in the investigated temperature range, showing well-defined orientation anisotropy for liquid ethanol. This anisotropy is larger than in the case of liquid water. The slower re-orientational dynamics in liquid ethanol compared to water can be explained, as stated by Vartia et all. [35], by the so-called ‘extended jump’ model.
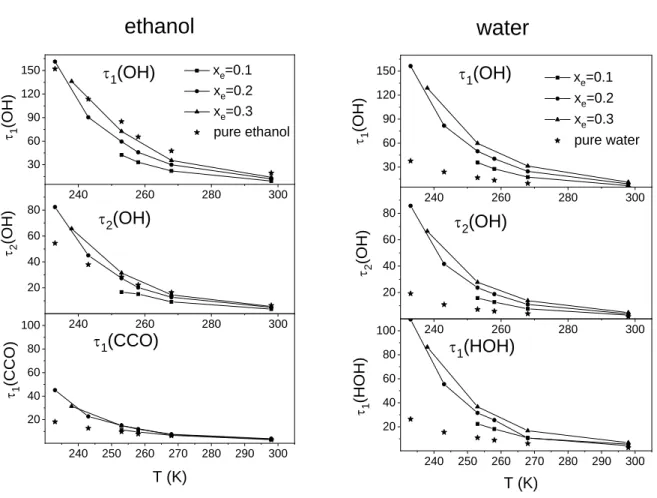
Characteristic re-orientational times are presented in Fig. 7, as a function of temperature, for the investigated mixtures and for the pure liquids. It can be concluded that the re-orientational motions of water and ethanol molecules become slower as the ethanol concentration is increasing. The 1, 2 characteristic times of water are substantially larger than these values in the pure substances. On the other hand, this change for ethanol is only moderate. The re-orientational motions of water molecules (especially of the ones related to the H-bonded interaction) become very similar to those of ethanol. This statement is supported by Fig. 8, where the ratios of the corresponding decay times of the two molecules are presented as a function of temperature for the xe=0.2 mixture and for the pure liquids. The calculated ratio for the pure substance is dramatically different from 1, and at the same time, it is very close to unity for the mixtures in the investigated concentration range.
Fig. 7 Re-orientational correlation times of ethanol (left panel) and water (right panel) molecules in the mixtures and in the pure liquids at various temperatures.
240 260 280 300
30 60 90 120 150
1(CCO)2(OH)1(OH)
xe=0.1 xe=0.2 xe=0.3 pure ethanol
1(OH)
240 260 280 300
20 40 60
80 2(OH)
240 250 260 270 280 290 300 20
40 60 80
100 1(CCO)
T (K)
ethanol
240 260 280 300
30 60 90 120 150
1(OH)
1(OH)
240 260 280 300
20 40 60 80
1(HOH)2(OH)
xe=0.1 xe=0.2 xe=0.3 pure water
2(OH)
240 250 260 270 280 290 300 20
40 60 80
100 1(HOH)
T (K)
water
Fig. 8 Ratios of the re-orientational times of ethanol and water molecules in the pure liquids and in the mixture with xe=0.2 at various temperatures.
230 240 250 260 270 280 290 300 0
1 2 3 4 5
1OH(et)/1OH(wa) pure 1OH(et)/1OH(wa) mixt
2OH(et)/2OH(wa) pure 2OH(et)/2OH(wa) mixt
1CCO(et)/1HOH(wa) pure 1CCO(et)/1HOH(wa) mixt
ratio
T(K)
Calculated activation barriers for the re-orientational motions of water and ethanol molecules are presented in Table 2. Clearly, the activation barrier for both water and ethanol have a well-defined maximum at the composition of xe=0.2. The activation barrier for re-orienting water molecules in the mixtures is larger than the corresponding value for ethanol molecules.
Table 2 Calculated activation barriers for water and ethanol molecules. (Data are in kJ/mol.)
water ethanol
1(HOH) 1(OH) 1(CCO) 1(OH) water 20.2±0.8 21.4±0.4
xe=0.1 23.4±0.9 22.9±0.5 21.0±0.8 18.2±0.4 xe=0.2 26.6±1.0 25.2±0.3 23.0±1.1 21.6±0.4 xe=0.3 25.2±0.8 23.9±0.4 22.5±1.2 20.9±0.3
ethanol 15.8±0.8 19.0±0.5
3.3 Diffusion coefficients
Mean squared displacements (MSD) of centers of mass as a function of time are used here to calculate the self-diffusion coefficient, according to Einstein’s method. The MSD-s (not displayed) clearly indicate that both water and ethanol molecules show a diffusive behavior over the timescale of our calculations, even at the lowest temperature. This is an important statement since the exact phase points of the real liquid and of the simulated system are not equivalent, therefore there would be some chance that the system actually may be in an amorphous solid state. Naturally, from the point of view of microscopic dynamics, this would not be acceptable.
The MSD-time curves are becoming steeper with increasing temperature; this shows that the rate of diffusion is increasing with increasing temperature. In order to validate our computational procedure, we compare simulated data for liquid water and ethanol with data from literature, using the same potential model. The statistical accuracy of the calculated diffusion coefficient is about 1-2 %.
We start with considering the diffusion coefficient for the pure liquids. In Figs. 9 and 10 we plot ln(D) for pure ethanol and water obtained from our MD simulations and from experiments [36, 43-48] as a function of the inverse temperature. In the case of water our data in the investigated temperature range agree well with results of Galamba [37]. The difference from experimental data is about 5-6 % at room temperature and about 8-10 % at low temperature. Here we would like to remark that the experimental uncertainty of the self-diffusion coefficient is about 10%. It is clear from this figure, however, that the temperature dependence of experimental
self-diffusion coefficient does not have an Arrhenius like behavior, especially not at low temperature. This non-Arrhenius behavior could not be reproduced by MD simulations.
Fig. 9 Experimental and simulated diffusion coefficients for liquid ethanol at different temperatures (simulation by Hasse [48], experiment 1 [44,45], experiment 2 [46,47]). Data are shown as Arrhenius-type plots.
2.8 3.0 3.2 3.4 3.6 3.8 4.0 4.2 4.4
-2.0 -1.5 -1.0 -0.5 0.0 0.5 1.0
OPLS ethanol (this work) Arrhenius fit
United atom ethanol (Hasse) Arrhenius fit
experiment 1 experiment 2
ln(D)
1000/T (1/K)
Fig. 10 Experimental and simulated diffusion coefficients for liquid water at different temperatures (simulation by Galamba [37], experiment 1 [36], experiment 2 [43]). Data are presented as Arrhenius-type plots.
3.2 3.4 3.6 3.8 4.0 4.2 4.4 4.6
-2.5 -2.0 -1.5 -1.0 -0.5 0.0 0.5 1.0 1.5
SPC/E data (this work) Arrhenius fit SPC/E data (Galamba) Arrhenius fit experimental 1 experimental 2
ln(D)
1000/T (1/K)
The temperature dependence of our simulated Dw and De can be reasonably well described by Arrhenius plots over the temperature range 298 to 253 K, as shown in Figs. 9 and 10. Values of the activation energy, which can be used as a direct measure of the temperature dependence of the self-diffusion coefficient, are presented in Table 3. For pure water, it is about 21.1 kJ/mol
from both the present and Galamba’s simulation data [37]. The activation energies reported for the experimental D of water over the range of temperatures 273 to 323 K [36, 43] are around 21.5 kJ/mol.
Table 3 Activation energies for D as calculated from the present MD simulations.
Water Ethanol
Water 21.1±0.8
Xe=0.1 22.6±0.6 24.2±0.7 Xe=0.2 26.8±0.9 26.6±0.8 Xe=0.3 25.2±0.8 24.7±0.7
Ethanol 17.9±0.6
The presently calculated values are in agreement with other simulations using the OPLS- AA model for ethanol [22,26, 49-52] that deviate from the experimental ones by an error margin of approximately 20-30 % above room temperature. At lower temperatures the agreement between simulated and experimental results is much improved: the activation energy from the present simulation is about 17.9 kJ/mol (this agrees reasonable well with simulation data of Hasse [48], and 17.4 kJ/mol from the experimental data [46,47]. The activation energy of the diffusion process in liquid ethanol is smaller than that in water.
Moving now to (ethanol-water) mixtures, calculated MSD for water and ethanol molecules in the xe=0.2 mixture at different temperatures are shown in Fig. 11. It is clear that even at the lowest temperature (233 K) it was possible to calculate properly the diffusion constant using Eq. 2. We do not claim that the temperature of the simulated system is directly related to the real temperature, since the complete phase diagram of the present combination of potential parameters is not known: by the above statement, we simply say that our simulated systems were certainly in the liquid state.
Fig. 11 Mean square displacements of ethanol (OPLS) and water (SPC/E) molecules at different temperatures in the mixture with 20 mol % ethanol.
0 20 40 60 80 100 120 140 0
20 40 60 80 100 120
298 K ethanol 298 K water 268 K ethanol 268 K water 233 K ethanol 233 K water
MSD(Å2 )
t(ps) xe=0.2
Calculated self-diffusion coefficients as a function of temperature are presented in Table 4.
Our simulation data reproduce the experimental trend, as a function of composition, at room temperature: whereas the self-diffusion coefficient of water molecules decreases monotonically with increasing ethanol concentration, both experiment and simulation find a minimum for the ethanol diffusion at xe=0.2. This is another indication that there is a well-defined change in terms of the strengths of interactions between water and ethanol molecules as the composition of the mixture varies. Quantitatively, however, simulation data significantly overestimate experimental results (by ca.20-40%) [38,39,53]. On lowering the temperature, a rapid decrease can be detected for the simulated self-diffusion coefficients of both water and ethanol molecules in the entire composition range considered here.
Table 4 Calculated self-diffusion coefficients of the components as a function temperature and composition (experimental values are in brackets ([38, 53]).
xethanol T(K) D (ethanol,10-9 m2/s) D (water,10-9 m2/s) 0.1 298 1.03 (0.65, 0.718) 1.70 (1.0, 1.26)
268 0.40 0.67
258 0.23 0.40
253 0.18 0.34
0.2 298 0.81(0.5, 0.618) 1.26(0.8, 0.99)
268 0.35 0.52
258 0.21 0.30
253 0.15 0.23
243 0.09 0.13
233 0.04 0.06
0.3 298 0.83(0.55, 0.623) 1.17(0.75, 0.91)
268 0.34 0.45
253 0.15 0.21
238 0.07 0.09
In order to reveal possible dynamical heterogeneities in the motion of water and ethanol molecules, the P(r2) probability distributions have been calculated for various temperatures and time periods. These data are shown in Fig. 12 for xe=0.1. The shapes of these distributions for ethanol and water molecules are very similar to each other: they all have a long tail and one single, well-defined maximum and expectation value of r2 at a certain time. This behavior (r2- exp(-ar2) is the direct consequence of the diffusion law: it means that, at least in terms of this type of motion, no any dynamical heterogeneities can be detected in ethanol-water liquid mixtures (in the concentration range under study). In other words, only the diffusive movement of one single entity (that of single molecules); no concerted movements of (H-bonded) assemblies of molecules may be observed.
Fig. 12 P(r2) probability distributions for xe=0.1 for ethanol and water molecules at two different temperatures and at several time periods.
0 50 100 150 200
0.000 0.002 0.004 0.006 0.008
0.010 Water
xe=0.1; T=298 K
P(r2 )
r2
24.9 ps 29.9 ps 49.9 ps 59.9 ps
0 50 100 150
0.000 0.005 0.010 0.015 0.020 0.025
0.030 37.4 ps
49.9 ps 74.9 ps 99.9 ps 149.9ps
P(r2 )
r2 Water xe=0.1; T=253 K
0 50 100 150 200 0.000
0.002 0.004 0.006 0.008 0.010 0.012
0.014 Ethanol
xe=0.1; T=298 K
P(r2)
r2
24.9 ps 29.9 ps 49.9 ps 59.9 ps
0 50 100
0.000 0.005 0.010 0.015 0.020 0.025 0.030 0.035 0.040
Ethanol xe=0.1; T=253 K
P(r2)
r2
37.4 ps 49.9 ps 74.9 ps 99.9 ps 149.9 ps
Calculated activation barriers for water and ethanol molecules in the mixtures can be found above in Table 3. It appears that for all concentrations, the activation barriers of water and ethanol molecules become very similar.
4. Conclusions
Detailed analyses of the pair energies, as well as diffusional and re-orientational motions of the molecules, as a function of composition and temperature, are presented for ethanol-water liquid mixtures in the water-rich region. Wherever it was possible, comparisons with experimental data, as well as with earlier simulations have been made: similarly to previous computer simulation data, the present results for, e.g., the self-diffusion coefficients are in qualitative agreement with experimental trends, although quantitatively, discrepancies of the order of 20 to 40 % are found, particularly for ethanol properties.
Concerning pairwise interaction energies between molecules, water-water interactions become stronger, while ethanol-ethanol ones become significantly weaker in the mixtures than the corresponding values characteristic to the pure substances. Additionally, in the pure liquids, as well as in the mixtures, we detected a noticeable change in the ‘interstitial’ region (3.6 Å, +1 kcal/mol).
Concerning self-diffusion, mean squared displacements of water and ethanol molecules clearly show diffusive behavior over the timescale of our calculations, even at the lowest temperature (close to the experimental freezing point). Calculated activation barriers for diffusive motions of water and ethanol molecules become very similar in the liquid mixtures.
Various re-orientational times for water and ethanol molecules have been determined in the pure liquids, as well as in the mixtures. The re-orientational motions of both water and ethanol molecules become slower as the ethanol concentration increases. The 1, 2 characteristic times of water are substantially larger in the mixtures than they are in the pure substance. The activation barrier for re-orienting water molecules in the mixture is larger than the corresponding value for ethanol molecules.
Acknowledgments
The authors are grateful to the National Research, Development and Innovation Office (NRDIO (NKFIH), Hungary) for financial support via grants Nos. SNN 116198 (Sz. P. and L. P.) and 124885 (I. B.) Sz.P thank for financial support from János Bolyai stipendium (Hungarian Academy of Sciences). We thank the computational support from National Information Infrastructure Development Programme (NIIF).
References
[1] H. S. Frank, M. W. Evans, Free Volume and Entropy in Condensed Systems III. Entropy in Binary Liquid Mixtures; Partial Molal Entropy in Dilute Solutions; Structure and Thermodynamics in Aqueous Electrolytes, J. Chem. Phys. 13 (1945) 507−532.
[2] R. Böhmera, C. Gainaru, R. Richert, Structure and dynamics of monohydroxy alcohols—
Milestones towards their microscopic understanding, 100 years after Debye, Physics Reports 545 (2014) 125–195.
[3] T. A. Dolenko, S. A. Burikov, S. A. Dolenko, A. O. Efitorov, I. V. Plastinin, V. I. Yuzhakov, S. V. Patsaeva, Raman Spectroscopy of Water-Ethanol Solutions: The Estimation of Hydrogen Bonding Energy and the Appearance of Clathrate-Like Structures in Solutions. J. Phys. Chem. A 119 (2015) 10806−10815.
[4] K. Egashira, N. Nishi, Low-Frequency Raman Spectroscopy of Ethanol−Water Binary Solution: Evidence for Self-Association of Solute and Solvent Molecules, J. Phys. Chem. B 102 (1998) 4054−4057.
[5] Y. Koga, K. Nishikawa, P. Westh, Icebergs” or No “Icebergs” in Aqueous Alcohols?:
Composition-Dependent Mixing Schemes, J. Phys. Chem. A 108, 2004 3873.
[6] H. S. Ashbaugh, J. W. Barnett, A. Saltzman, M. Langrehr, and H. Houser, Connections between the Anomalous Volumetric Properties of Alcohols in Aqueous Solution and the Volume of Hydrophobic Association, 2018 DOI:10.1021/acs.jpcb.7b08728
[7] M. L. Tan, B. T. Miller, J. Te, J. R. Cendagorta, B. R. Brooks and T. Ichiye, Hydrophobic hydration and the anomalous partial molar volumes in ethanol-water mixtures, J. Chem. Phys.
142 (2015) 064501.
[8] R. K. Lam, J. W. Smith, R. J. Saykally, Communication: Hydrogen bonding interactions in water-alcohol mixtures from Xray absorption spectroscopy, J. Chem. Phys. 144 (2016) 191103.
[9] K. Nishikawa, T. Iijima, Small-angle X-ray scattering study of fluctuations in ethanol and water mixtures, J. Phys. Chem. 97 (1993) 10824–10828.
[10] M. D'Angelo, G. Onori, A. Santucci, Self-association of monohydric alcohols in water:
compressibility and infrared absorption measurements, J. Chem. Phys. 100 (1994) 3107.
[11] A. Ben-Naim, Inversion of the Kirkwood–Buff theory of solutions: application to the water–
ethanol system, J. Chem. Phys. 67 (1977) 4884.
[12] B. M Rankin, D. Ben-Amotz, S. T van der Post, H. J. Bakker, Contacts between alcohols in water are random rather than hydrophobic, J. Phys. Chem. Lett. 6 (2015) 688.
[13] T. Sato, A. Chiba, R. Nozaki, Dynamical aspects of mixing schemes in ethanol–water mixtures in terms of the excess partial molar activation free energy, enthalpy and entropy of the dielectric relaxation process, J. Chem. Phys. 110 (1999) 2508.
[14] J. H. Guo, Y. Luo, A. Augustsson, S. Kashtanov, J. E. Rubensson, D. K. Shuh, H. Ågren, J.
Nordgren, Molecular Structure of Alcohol-Water Mixtures. Phys. Rev. Lett. 91 (2003) 57401.
[15] A.K. Soper, L. Dougan, J. Crain and J. L. Finney Excess Entropy in Alcohol-Water Solutions: A Simple Clustering Explanation J. Phys. Chem. B 110 (2005) 3472.
[16] P. Gallo, K. Amann-Winkel, C.A. Angell, M.A. Anisomov, F. Caupin, C.Chakvavarty, E.
Lascaris, T. Loorting, A.Z. Panagiotoulis, J. Russo, J.A. Sllberg, H.E. Stanley, H. Tanaka, C.
Vega, L. Xu, L.G.M. Pettersson, Water: A Tale of Two Liquids, Chem. Rev. 116 (2016) 7463.
[17] H. E. Stanley, S. Buldyrev, M. Canpolat, S. Havlin, O. Mishima, M. Sadr-Lahijany, A. Scala and F. Starr, The puzzle of liquid water: a very complex fluid, Phys. Nonlinear Phenom. 133 (1999) 453–62.
[18] D.S. Eisenberg, W. Kauzmann, The Structure and Properties of Water; Oxford University Press: Oxford, 1969.
[19] A. Nilsson & L. G.M. Pettersson, The structural origin of anomalous properties of liquid water, Nature Communications 6 (2015) 8998.
[20] A. Pereraa, F. Sokolić, L. Almásy, Y. Koga, Kirkwood-Buff integrals of aqueous alcohol binary mixtures J.Chem.Phys.124 (2006) 124515.
[21] M. Mijakovic, K. D Polok, B. Kezic, F.Sokolic, A. Perera, L. A. Zoranic, Comparison of force fields for ethanol-water mixtures. Mol. Simul. 41 (2015) 699−712.
[22] S. Y Noskov, G Lamoureux, B. Roux, Molecular dynamics study of hydration in ethanol- water mixutres using a polarizable force field. J. Phys. Chem. B 109 (2005) 6705−6713.
[23] R. Ghosh, B. Bagchi, Temperature Dependence of Static and Dynamic Heterogeneities in a Water–Ethanol Binary Mixture and a Study of Enhanced, Short-Lived Fluctuations at Low Concentrations, J. Phys. Chem. B 120 (2016) 12568.
[24] O. Gereben, L. Pusztai, Investigation of the Structure of Ethanol−Water Mixtures by Molecular Dynamics Simulation I: Analyses Concerning the Hydrogen-Bonded Pairs J. Phys.
Chem. B 119, (2015) 3070−3084.
[25] O. Gereben, Ring structure analysis of ethanol–water mixtures, J. Mol. Liquids 211 (2015) 812.
[26] E. J. W. Wensink, A. C Hoffmann, P. J van Maaren, D van der Spoel, Dynamic properties of water-alcohol mixtures studied by computer simulation, J. Chem. Phys.119 (2003) 7308.
[27] O. Gereben, L. Pusztai, Cluster Formation and Percolation in Ethanol-Water Mixtures, Chem. Phys. 496 (2017) 1.
[28] I.Bakó, L. Pusztai, L. Temleitner, Decreasing temperature enhances the formation of sixfold hydrogen bonded rings in water-rich water-methanol mixtures, SCIENTIFIC REPORTS 7 (2017) 1073.
[29] Sz. Pothoczki, L. Pusztai, I. Bakó Variations of the hydrogen bonding and of the hydrogen bonded network in ethanol-water mixtures on cooling article sent to J. Phys. Chem B.
[30] D. van der Spoel, E. Lindahl, B. Hess, G. Groenhof, A. E. Mark, H. J. C. Berendsen, GROMACS: Fast, flexible, and free, J. Comput. Chem. 26 (2005) 1701.
[31] W. L. Jorgensen, D. Maxwell, S. Tirado-Rives, Development and Testing of the OPLS All- Atom Force Field on Confőormational Energetics and Properties of Organic Liquids, J. Am.
Chem. Soc. 118 (1996) 11225-11236.
[32] H. J. C. Berendsen, J. R. Grigera and T. P. Straatsma, The missing term in effective pair potentials, Journal of Physical Chemistry 91 (1987) 6269.
[33] O. Gereben, L. Pusztai, System size and trajectory length dependence of the static structure factor and the diffusion coefficient as calculated from molecular dynamics simulations: The case of SPC/E water, J. Mol. Liquids 161 (2011) 36.
[34] H. J. C. Berendsen, J. P. M. Postma, A. DiNola, J. R. Haak, Molecular dynamics with coupling to an external bath, J. Chem. Phys. 81 (1984) 3684.
[35] A. A. Vartia, K. R. Mitchell-Koch, G. Stirnemann, D. Laage, and W. H. Thompson On the Reorientation and Hydrogen-Bond Dynamics of Alcohols J. Phys. Chem. B 115 (2011), 12173–
12178.
[36] M. Holz, S. R. Heil, A Sacco, Temperature-dependent self-diffusion coefficients of water and six selected molecular liquids for calibration in accurate 1H NMR PFG measurements, Phys.
Chem. Chem. Phys. 2 (2002) 4740.
[37] N. Galamba, On the hydrogen-bond network and the non-Arrhenius transport properties of water, J. Phys.: Condens. Matter 29 (2017) 015101.
[38] W. S. Price, H. Ide, Y. Arata Solution dynamics in aqueous monohydric alcohol.
J.Phys.Chem. A 107 (2003) 4784.
[39] R. Li, C. D’Agostino, J. McGregor, M. D. Mantle, J. A. Zeitler and .L. F. Gladden Mesoscopic Structuring and Dynamics of Alcohol/Water Solutions Probed by Terahertz Time- Domain Spectroscopy and Pulsed Field Gradient Nuclear Magnetic Resonance J. Phys. Chem. B 118 (2014) 10156.
[40] T. D. Ferris and T. C. Farrar The temperature dependence of the hydroxyl deuterium quadrupole coupling parameter and the rotational correlation time of the OD internuclear vector in neat ethanol-dl, Mol. Phys. 100, (2002) 303.
[41] B. M. Fung, and Tim W. McGaughy, Molecular motions in liquid. I. Rotation of water and small alcohols studied by deuteron relaxation, J. Chem. Phys. 65 (1976) 2970.
[42] R. Ludwig a & M.D. Zeidler, NMR relaxation in ethanol and propanol and in their binary mixtures with carbon tetrachloride, Mol. Phys. 82 (1994) 313.
[43] A. J. Easteal, W. E Price, L. A. Woolf, Diaphragm cell for high-temperature diffusion measurements. Tracer Diffusion coefficients for water to 363 K, J. Chem. Soc., Faraday Trans. 1 85 (1989) 1091.
[44] N. Karger, T. Vardag, H.D. Lüdemann, Temperature dependence of self-diffusion in compressed monohydric alcohols, J. Chem. Phys. 93 (1990) 3437
[45] N. Shaker-Gaafar, N. Karger, S. Wappmann, H.D. Lüdemann, p,T-dependence of self- diffusion in liquid ethanol and the propanols, Ber. Bunsenges. Phys. Chem. 97 (1993) 805.
[46] R.L. Hurle, A.J. Easteal, L.A. Woolf, Self-diffusion in monohydric alcohols under pressure.
Methanol, methan(2H)ol and ethanol, J. Chem. Soc., Faraday Trans. 1 81 (1985) 769.
[47] S. Meckl, M.D. Zeidler, Self-diffusion measurements of ethanol and propanol, Mol. Phys. 63 (1988) 85.
[48] G. G. Carrion, J. Vrabec, H. Hasse, Prediction of self-diffusion coefficient and shear viscosity of water and its binary mixtures with methanol and ethanol by molecular simulation, J.Chem. Phys. 134 (2011) 074508.
[49] R. Kumar, J. R. Schmidt, and J. L. Skinner Hydrogen bonding definitions and dynamics in liquid water J.Chem. Phys. 126, (2007) 204107
[50] A.Ghoufi, F.Artzner, P.Malfrey, Physical properties and hydrogen bonding network of water-ethanol mixtures from molecular dynamic simulations, J. Phys. Chem. B 120 (2016) 793.
[51] L. Zhang, Q. Wang, Y.-Chun Liu, L.-Zhong Zhang, On the mutual diffusion properties of ethanol-water mixtures, J. Chem. Phys. 125 (2006) 104502.
[52] M. Mijaković, K. D. Polok, B. Kežić, F. Sokolić, A. Perera & L. Zoranić, A comparison of force fields for ethanol–water mixtures, Molecular Simulation, 41 (2015) 699.
[53] K. R. Harris, P. J. Newitt and Z. J. Derlack, Alcohol tracer diffusion, density, NMR and FTIR studies of aqueous ethanol and 2,2,2-trifuoroethanol solutions at 25 °C J. Chem. Soc., Faraday Trans., 94 (1998) 1963.


![Fig. 10 Experimental and simulated diffusion coefficients for liquid water at different temperatures (simulation by Galamba [37], experiment 1 [36], experiment 2 [43])](https://thumb-eu.123doks.com/thumbv2/9dokorg/1418334.119973/13.918.287.675.666.942/experimental-simulated-diffusion-coefficients-temperatures-simulation-experiment-experiment.webp)

![Table 4 Calculated self-diffusion coefficients of the components as a function temperature and composition (experimental values are in brackets ([38, 53])](https://thumb-eu.123doks.com/thumbv2/9dokorg/1418334.119973/15.918.270.649.122.426/calculated-diffusion-coefficients-components-function-temperature-composition-experimental.webp)
