Single Particle Dynamics at the Liquid-Liquid Interface.
Molecular Dynamics Simulation Study of the Water-CCl
4System
Balázs Fábián,
1George Horvai,
2Marcello Sega,
3and Pál Jedlovszky,
4,*1
Institute of Organic Chemistry and Biochemistry of the Czech Academy of Sciences, Flemingovo nám. 2, CZ-16610 Prague 6, Czech Republic
2
Department of Inorganic and Analytical Chemistry, Budapest University of Technology and Economics, Szt. Gellért tér 4, H-1111 Budapest, Hungary
3
Helmholtz-Institut Erlangen-Nürnberg, Forschungszentrum Jülich, Fürther Straße 248, D-90429 Nürnberg, Germany
4
Department of Chemistry, Eszterházy Károly University, Leányka u. 6, H-3300 Eger, Hungary
Running title: Single Particle Dynamics at the Liquid-Liquid Interface
*Electronic mail: jedlovszky.pal@uni-eszterhazy.hu (PJ)
Abstract
We investigate the single particle dynamics in the molecular layers at the interface between two immiscible liquids by computer simulation, using water and carbon tetrachloride (CCl4) as two prototypical fluids. The steric restriction, imposed by the presence of CCl4, slows down the dynamics of the surface water molecules, and vice-versa, as compared to the corresponding liquid-vapor interfaces. The presence of CCl4, however, restricts also the orientational freedom of the surface water molecules, resulting in fewer in-layer and more out-of-layer hydrogen-bonded neighbors, eventually promoting the exchange of water molecules between the surface layer and the bulk phase. On the contrary, the vicinity of the aqueous phase stabilizes the CCl4 molecules in the surface layer, resulting in a considerably larger mean surface residence time with respect to the liquid-vapor interface of CCl4. All these results consistently show that the interface between the two liquid is, in terms of dynamical properties, of monomolecular width, as in this respect the second layer already behaves very similarly to the bulk liquid phase.
1. Introduction
Soft (e.g., liquid-liquid and liquid-vapor) interfaces are of great importance both in fundamental science and industrial applications. The importance of such systems stems from the fact that the interfacial molecules experience a markedly different, asymmetric local environment, and hence they behave in a markedly different way in many respects than bulk phase ones. As a consequence, soft interfaces play a key role in a number of processes of both scientific and industrial relevance, such as heterogeneous catalysis, liquid-liquid extraction, charge transfer processes, chromatography, adsorption, or surface micellization.
Meaningful investigation of soft interfaces at the atomistic level was enabled by the development of various surface-sensitive experimental methods, such as nonlinear [!1] (e.g., second harmonic generation [!2-4] or vibrational sum frequency generation [!5,6]) spectroscopies, neutron [!7,8] and X-ray [!7,9] reflection techniques, or time dependent fluorescent anisotropy measurements [!10,11] at the second half of the past century. Such experiments can be complemented by computer simulation methods, [!12] which can provide a detailed insight at the atomistic level of suitably chosen models of the system of interest.
Computer simulation investigation of soft interfaces has been, however, long hindered by the fact that, on the molecular length scale, these interfaces are corrugated by thermal capillary waves [!13] rather than being flat. The importance of identifying the real, capillary wave corrugated, so-called intrinsic interface was already realized in the very first simulations of liquid-liquid [!14,15] and liquid-vapor [!16] interfaces. In spite of that, in the vast majority of interfacial simulations, the interfacial region was associated, for a long while, with a macroscopically flat layer of finite width, in which the densities of the components fall between the values corresponding to the two coexisting bulk phases. However, neglecting the effect of the capillary waves on the interface introduces a systematic error of unknown magnitude in the calculated interfacial properties, [!17-19] and this systematic error can even propagate into the calculated thermodynamic properties of the system. [!20]
The first systematic method for detecting the intrinsic liquid surface was proposed by Chacón and Tarazona. [!21] This was followed by the development of a number of alternative methods, [!17,22-27] some of which are even free from the assumption that the interface is macroscopically flat. [!25-27] A common feature of all of these methods is that they all use a free parameter, which reflects the length scale on which the interface, built up by discrete particles, is looked at. [!24] Jorge et al. showed that, in the lack of such a free parameter, the
procedure fails to identify the true set of the interfacial molecules, even if it is based on a seemingly physically sensible criterion. [!24] Among the various methods, the Identification of the Truly Interfacial Molecules (ITIM) [!17] turned out to be an excellent compromise between computational cost and accuracy. [!24]
Having access to the complete set of the truly interfacial molecules, or, equivalently, the continuous intrinsic covering surface of the liquid phase, it is possible to compute the profile of various physical quantities (e.g., density, [!21,23,28-32] energy, [!32] electrostatic potential, [!33] lateral pressure or, equivalently, surface tension, [!32,34-36], solvation free energy, [!37,38] etc.) either with respect to this intrinsic surface, or in a layer-by-layer manner. [!32] In the past one and half decades, intrinsic analysis was successfully applied to the detailed characterization of the surface properties of various neat molecular liquids [!17-20,22-24,30,31,34,37,38] and their binary mixtures, [!19,39-41] amorphous ice, [!42,43]
aqueous electrolyte solutions, [!33] Lennard-Jones systems, [!21,28,29,32,35,44-48] ionic liquids [!49-53] and their mixtures with molecular liquids, [!54] as well as of lipid membranes. [!55] Further, these methods helped clarifying a number of various problems related to soft interfaces, such as the explanation of the surface tension anomaly of water, [!56,57] detecting the nonzero ideal gas contribution to the surface tension of liquids consisting of rigid particles, [!58] addressing the plausibility of the ‘HCN World’ hypothesis that describes the possible prebiotic formation of the building blocks of large biomolecules, [!39] the immersion depth of various surfactants to water, [!59] the validity of the hypothesis that relates the spinodal pressure to the minimum of the interfacial lateral pressure profile, [!35] the behavior of Newton black films, [!60] as well as the surface adsorption [!19,39-41]
and surface orientation, including its dependence of the local surface curvature [!17-20,39-41]
of various molecules.
In spite of the large number of investigations involving intrinsic analysis of soft interfaces, relatively few studies have addressed the dynamical properties of the molecules belonging to such interfaces. This fact is even more surprising in the light of the wealth of studies addressing interfacial dynamics. [!44-46,61-75] However, only a handful of these studies considered the real, capillary wave corrugated, intrinsic surface of the liquid phase.
[!44-46,73,74] Delgado-Buscalioni et al. studied the dynamics of the capillary waves at the surface of the Lennard-Jones fluid and of soft alkali liquids. [!44,45] Benjamin followed the dynamics of single solute molecules at molecularly sharp portions of the liquid-liquid interface, [!61,63,68-70] and also that of the individual interfacial molecules that penetrated into the bulk opposite phase. [!75] Single particle dynamics at the intrinsic liquid surface was
first investigated by Duque et al., who studied the liquid-vapor interface of the Lennard-Jones system. [!46] In a recent set of studies, we analyzed the single particle dynamics of the water molecules, described by several different potential models, [!73] and of various apolar, aprotic dipolar, and hydrogen bonding liquids [!74] at their intrinsic liquid-vapor interface. These studies revealed that while the ratio of the mean surface residence time and the characteristic time of surface diffusion of the Lennard-Jones particles is roughly unity, [!46] this value is significantly larger, falling in the range of 3-5, for molecular liquids, [!73,74] and that these particles diffuse considerably (i.e., by a factor of 2-4) faster in the surface layer than in the bulk liquid phase. [!46,73,74] This increased mobility was attributed to the lack or weakening of the caging effect at the liquid-vapor interface. [!74] Further, we also showed that the longest residing surface molecules are distributed in a correlated way at the liquid surface, and, at least for the hydrogen bonding liquids, their longer stay at the liquid surface is related to their weaker interaction with the molecules of the subsequent layer. [!73,74] However, some of these findings are likely related to the very low density at the vapor side and, consequently, might disappear at the liquid-liquid interface, while some others might be independent from the density of the opposite phase, and hence can still hold at the liquid- liquid interface. We are not aware, however, of any study concerning single particle dynamics at the intrinsic liquid-liquid interface.
In this paper, we report a detailed analysis of the dynamics of the molecules at the intrinsic water-CCl4 liquid-liquid interface, and compare the obtained properties with those calculated previously at the intrinsic liquid-vapor interface of the same liquids. [!74] The main questions to be addressed in this study include whether the enhanced mobility of the molecules, observed at the liquid-vapor interface, is also valid at the liquid-liquid interface, and how the number, strength and lifetime of the surface hydrogen bonds depend on the type of the opposite phase. In addition, the interaction of the longest residing interfacial water molecules at the liquid surface with other water molecules is also investigated.
The paper is organized as follows. In sec. 2, details of the calculations performed, including molecular dynamics simulations, ITIM surface identification, and various dynamical analyses are given. The obtained results are discussed in detail in sec. 3. Finally, in sec. 4, the main conclusions of this study are summarized.
2. Methods
2.1. Molecular Dynamics Simulations. Molecular dynamics simulations of the water- CCl4 liquid-liquid interface has been performed on the isothermal-isobaric (N,p,T) ensemble at 300 K and 1 bar. Since the main goal of the present study is to compare single particle dynamics at these interfaces with that obtained earlier at the liquid-vapor interfaces of CCl4
and water, [!74] the parameters of the simulations have been chosen to be identical with those of the former ones whenever possible. Thus, the lengths of the Y and Z edges of the basic simulation box, defining the macroscopic plane of the interface, have been set to 50 Å; and only the length of the macroscopic interface normal edge, X, has been coupled to the barostat and left to fluctuate.
CCl4 and water molecules have been modeled by the OPLS force field [!76] and the SPC/E potential, [!77] respectively, in accordance with our previous study. [!74] Both of these models are rigid and pairwise additive, describing the interaction energy of a molecule pair as the sum of the Lennard-Jones and Coulomb contributions of all of their atomic pairs.
The interaction parameters of the potential models used are collected in Table 1 of Ref. [!34].
All interactions have been truncated to zero beyond the molecular center-based cut-off distance of 14 Å; the long range part of the electrostatic interaction has been accounted for by the smooth Particle Mesh Ewald (sPME) method. [!78]
The simulations have been performed by the GROMACS 5.1 program package. [!79]
The equations of motion have been integrated in time steps of 1 fs. The geometry of the molecules has been kept unchanged by means of the SHAKE algorithm. [!80] The temperature and pressure of the systems have been controlled using the Nosé-Hoover thermostat [!81,82] and Parrinello-Rahman barostat [!83] with the time constants of 0.1 ps and 1 ps, respectively.
The initial configuration has been created by juxtaposing the surfaces of the two liquid phases, previously equilibrated in contact with their vapor phases. [!74] After proper energy minimization, the system has been equilibrated for 20 ns. Then, in a 4 ns long production run, 4000 sample configurations, separated from each other by 1 ps long trajectories, have been saved for the calculation of the surface residence times and diffusion coefficients. This was followed by two subsequent production runs of the lengths of 400 ps and 4 ps, respectively, in which 4000-4000 configurations, separated by 0.1 ps and 1 fs long trajectories each, have been saved for the analysis of the hydrogen bond dynamics and for the evaluation of the
velocity autocorrelation functions, respectively. All properties calculated have been averaged both over all sample configurations and also over the two interfaces present in the basic simulation box.
2.2. ITIM Analyses. In an ITIM analysis, the molecules forming the intrinsic liquid surface are identified by moving a spherical probe of a given radius along a sufficiently dense set of test lines perpendicular to the macroscopic plane of the surface (in our case, the YZ plane) from the bulk opposite phase towards the liquid surface to be analyzed. Once the probe, moving along a given test line, touches the first molecule belonging to the phase of interest, this molecule is identified as being at the interface (as it is ‘seen’ by the probe from the opposite phase), and the next test line is considered. Once the probe is moved along all the test lines, the full set of the interfacial molecules of the phase analyzed are identified. [!17]
Although the radius of the probe sphere is a free parameter of the analysis, it does possess a real physical meaning as it defines the length scale on which the interface is looked at. [!24] A simple notion that the probe sphere size should be comparable with that of the atoms to be detected [!17] can be refined, and the optimal size of the probe sphere can be derived. [!24,84]
In accordance with the results of such a study, [!24] here we have used a probe sphere of the radius of 2 Å for CCl4 and of 1.25 Å for water, moved along test lines arranged on a 100×100 grid (corresponding to the lattice unit of 0.5 Å). The ITIM analyses have been performed using the freely available [!85] PYTIM program package. [!86] In detecting the touching position of a molecule with the probe, its atoms have been represented by spheres the diameters of which have been set equal to their Lennard-Jones diameter, . In order to identify all molecules pertaining to the intrinsic liquid-liquid interface, the entire procedure has been performed twice, considering the surface of both liquid phases, and thus the surface layers of both phases have been determined. Further, in both phases the molecules pertaining to the second, third, and fourth subsurface layers have also been identified. An equilibrium snapshot of the interfacial portion of the system simulated is shown in Figure 1, indicating also the molecules belonging to the first four subsurface layers of their respective phases.
2.3. Calculation of Survival Probabilities and Mean Lifetimes. The survival probability, L(t), of a given property or condition (in our case, a given molecule being located in the interfacial layer, or the existence of a given hydrogen bond) is simply defined as the probability that the condition holds uninterruptedly from time t0, until at least time t0+t. [!87]
Since the breaking of these conditions (i.e., the departure of a molecule from the surface, or
the breaking of a H-bond) follows, in principle, first order kinetics, L(t) is supposed to exhibit exponential decay. However, if a number n of different mechanisms, happening on different time scales (i) are involved, L(t) decays in a multi-exponential manner:
n i
t i t
L
1
/ exp )
( . (1)
In practice, L(t) usually follows at most a biexponential decay. In particular, both the departure of a molecule from the liquid surface and the breaking of a hydrogen bond can occur temporarily, due to a fast vibrational motion of the corresponding particles – in this case, the original condition is quickly restored (i.e., the molecule returns to the surface layer or the H-bond is reformed) by the same vibration, or on a longer time scale that can be associated with translational or rotational diffusion, in which case the breaking of the condition is permanent. Given that the characteristic time of this latter, slower process is significantly larger than that of the former, it approximates well the mean lifetime of the condition (i.e., the mean surface residence time of the molecules or the mean lifetime of the H-bonds). It should be noted that these two breaking mechanisms are sometimes separated by defining a so-called intermittent survival probability, i.e., when the breaking of the event is allowed if it is restored within a short time window of t. However, this treatment is simply based on an intuitive estimation of the characteristic time of the fast process by t, while the biexponential fit of the survival probability provides its accurate value together with that of the slow process, and also readily separates the two processes. For this purpose, in this paper we always use the biexponential fitting instead of the intermittent analysis of the survival probabilities.
2.4. Calculation of the Diffusion Coefficients and Characteristic Time of Surface Diffusion. The diffusion coefficient can, in general, be calculated by solving the Fokker- Planck equation: [!88]
)
; , ( )
; ,
(r t r0 D 2P r t r0
t P
, (2)
where P(r,t;r0) is the probability of finding a molecule at time t at the position r, given that at t = 0 it was at r0. In the case of homogeneous isotropic liquids, i.e., when the molecules can
diffuse freely in all directions, the solution of the Fokker-Planck equation leads to the Einstein relation, [!12] i.e.,
t k
t
D MSD( ), (3)
where MSD is the mean square displacement of the molecules:
MSD
r(t0t)r(t0)
2 , (4) ri(t0+t) and ri(t0) being the position of a given particle at times t0+t and t0, respectively, the brackets <...> denote ensemble averaging, and k is a constant related to the dimensionality of the diffusive motion, being 2, 4, and 6 for one, two and three dimensional diffusion, respectively. It should be noted that this fitting should be performed by excluding the first part of the data to ensure that the initial correlations disappear, and the correct diffusion regime is probed. In the present study, the exclusion of the first 2 ps (for water) and 10 ps (for CCl4) from the fit has turned out to be sufficient in this respect.In the general case of anisotropic and inhomogeneous systems, the diffusion coefficient is a tensorial quantity, and the solution of the Fokker-Planck equation requires the specification of the boundary conditions. Here we are interested in the diffusion of the molecules within the intrinsic surface layer of a liquid phase and, hence, in calculating the diffusion coefficients, we follow the trajectory of the individual molecules only as long as they belong to this layer. As a consequence, the diffusion coefficient along the direction perpendicular to the macroscopic plane of the surface, D, can be calculated by solving the Fokker-Planck equation with reflecting boundary conditions, i.e., assuming two planar reflecting walls parallel with the macroscopic plane of the surface, laying at a distance Leff
from each other, where Leff represents the effective width of the surface layer. [!74] Averaged over all initial positions, X0, of the molecules, the MSD along the macroscopic surface normal axis, X, can be expressed as [!67]
2 4 eff
4 eff2
eff2 2 0
0 eff
) 1 2 exp (
) 1 2 (
16 6
1
L t n D n
L L dX X
L X
. (5)
The series in eq. 5 is quickly converging due to its dependence on n-4, and hence a rather accurate approximation can already be obtained using only the first few terms. On the other hand, diffusion along the macroscopic plane of the interface, YZ, can be assumed to be isotropic and position independent. Therefore, the diffusion tensor can be written in the form of D = diag(D,D||,D||), where the diffusion coefficient within the YZ plane, D||, can still be obtained through the Einstein relation, i.e., D|| = MSD(t)/4t, by fitting a straight line to the parallel MSD vs. t data. On the other hand, D can be obtained by fitting the perpendicular MSD vs. t data by eq. 5.
A characteristic time of the two-dimensional, lateral diffusion of the molecules, D, can be defined as the time required for a molecule to fully explore the molecular surface area (i.e., area per molecule, Am) of the interface, in other words, the time at which MSD reaches the value Am. [!73,74,89] Using eq. 3 and the relation of Am = 2YZ/<Nsurf>, where <Nsurf>
denotes the average number of surface molecules, and the factor of 2 stands for the two liquid surfaces present in the basic box, the value of D can simply be calculated as
||
surf
D 2 N D
YZ
. (6)
2.5. Calculation of the Velocity Autocorrelation Function. To investigate the time scale on which a particle loses the memory of its initial velocity, it is customary to compute the center-of-mass velocity autocorrelation function of the particles, i.e., [!90]
i
i
i t t t
t N1 ( ) ( )
)
( vcm 0 vcm 0 . (7)
In this equation, vicm denotes the center-of-mass velocity of the ith particle at a given time, N is the total number of the particles, and the brackets <...> denote ensemble averaging. In its initial, decaying part, the velocity autocorrelation function might even drop below zero, evidencing a strong collision with the cage formed by the nearest neighbor molecules. [!90]
Although the velocity autocorrelation function contains, in general, the same information as the MSD, the dynamics of the particles on a short time scale is more easily accessible through the velocity autocorrelation function. For this purpose and, in particular, to investigate the presence of the aforementioned caging effect in the surface layer, here we analyze the
dynamics of the surface molecules also through their surface velocity autocorrelation function, defined, in analogy with the bulk phase one, as [!74]
) , ( ) ( ) ) (
( ) 1
( 0 0
) (
1
cm 0
||
cm 0
||
0
||
0
t t t t t
t t
t N i
t N
i
i
i
v
v , (8)
where vcm||i is the center-of-mass velocity of the surface molecules within the macroscopic plane of the surface, YZ, N(t0) is the number of surface molecules at time t0, and the value of the function i(t1,t2) is unity if particle i stays uninterruptedly in the surface layer between t1
and t2, and it is zero otherwise. In this way, similarly to the calculation of the surface diffusion coefficients, particles are taken into account in the calculation of the surface velocity autocorrelation function only as long as they indeed stay within the surface layer of their phase.
3. Results and Discussion
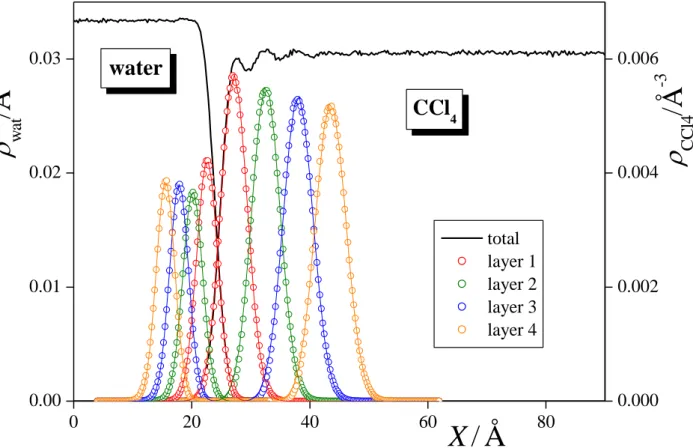
3.1. Density Profiles. The number density profiles of the water and CCl4 molecules in the entire system as well as in the first four molecular layers at the surface of their phase are shown in Figure 2. The density profiles corresponding to the subsequent molecular layers are found to largely overlap with each other in both phases, and the density peak of the first layer extends well into the constant density region of its own phase, while that of the second and, in the case of water, also the third layer overlaps with the X range of intermediate densities. This finding stresses again the importance of using intrinsic analysis in the investigation of the liquid surface, by pointing out that defining the interfacial layer through the range of intermediate densities of the corresponding phase would indeed lead to a serious misidentification of the interfacial molecules, and hence to a large systematic error.
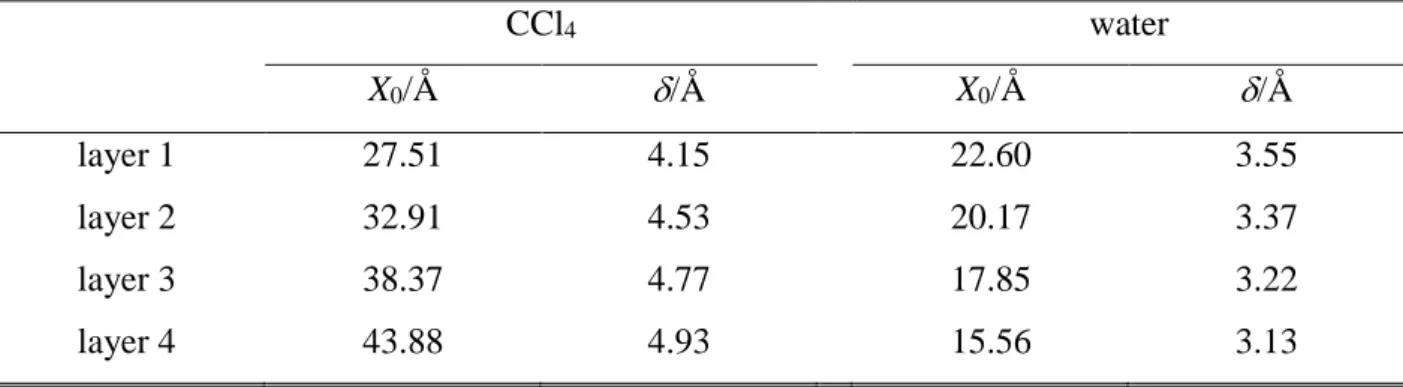
The density profiles of the individual layers can be well fitted by Gaussian functions.
[!91] The center (X0) and full width at half maximum () of these Gaussians can serve as estimates of the position and width of the corresponding molecular layers. The X0 and values corresponding to the first four layers of both phases are collected in Table 1. As is seen, the spacing of the subsequent water as well as CCl4 layers beneath the interface is rather uniform, being about 2.35 ± 0.1 Å for water and 5.45 ± 0.05 Å for CCl4, suggesting that these layers are rather tightly packed to each other even at the immediate vicinity of the liquid surface, and hence this spacing corresponds primarily to the size of the molecules. However,
the distance between the water and CCl4 surface layers of 4.9 Å is considerably, by about 25% larger than the arithmetic average of the values corresponding to the spacing of the water and CCl4 layers in the respective phases, which would correspond to the tight packing of the molecules of the two phases at the interface. This finding, in accordance with earlier results, [!18,92] indicates that the surface molecules of the two phases are rather loosely packed together at the interface, and there is a roughly 1 Å wide layer of low density between the two liquid surfaces. This loose packing at the interface might well correspond to the different amplitude and frequency of the capillary waves at the two liquid surfaces.
3.2. Residence Time at the Liquid Surface. The survival probabilities of the CCl4
and water molecules within the surface layer as well as in the subsequent three molecular layers of their phase are shown in Figure 3. The obtained L(t) data can indeed be very well fitted by a biexponential function (see eq. 1), as illustrated in Fig. 3 for the surface layers. The smaller of the two characteristic time values (denoted here as vib) has turned out to be always below 3 ps (for CCl4) and 2 ps (for water), confirming that it indeed corresponds to the fast vibrational motion of the molecules, due to which they leave the given layer only temporarily.
The characteristic time corresponding to the permanent departure from the layer, denoted here as res, (which represents the mean residence time of the molecules in the given layer) is at least an order of magnitude larger than the short time scale of the vibrational motion, vib, for both water and CCl4 in the respective first layer. On the other hand, the L(t) curves corresponding to the second and subsequent subsurface layers are rather similar to each other, decaying much faster than those of the surface layers, and the corresponding res values are also rather close to vib. This finding suggests that, from the dynamical point of view, only the surface molecular layer differs substantially from the bulk liquid phase. The res values of the surface layers (i.e., 86.5 ps for CCl4 and 10.2 ps for water) set the time scales on which single molecular processes can be meaningfully discussed at the liquid surfaces. Namely, in the case of processes occurring on time scales longer than res, the molecules simply do not stay, on average, long enough at the liquid surface to complete the entire process. The vib and res, values obtained in the first four layers of the two liquid phases are collected in Table 2.
It is interesting to compare the mean surface residence time, res, of the water and CCl4
molecules at the water-CCl4 liquid-liquid interface and at their liquid-vapor interfaces [!74]
(see Table 2). As is seen, CCl4 molecules stay about three times longer at the liquid-liquid than at the liquid-vapor interface, while the surface residence time of the water molecules is
decreased substantially, i.e., by about 30%, when the opposite phase is also liquid. The large increase of the surface residence time of the CCl4 molecules in the presence of a condensed opposite phase can be explained by considering that surface CCl4 molecules are in an energetically far more favorable environment if the opposite phase is water (due to their interaction with the nearby water molecules) than when the opposite phase is vapor. This additional attraction of the aqueous phase (with respect to that of the vapor phase) stabilizes the CCl4 molecules in the surface layer, and thus increase their mean residence time in this layer. On the other hand, understanding the decrease of the mean surface residence time of the water molecules in the presence of a condensed CCl4 opposite phase is much less straightforward. Indeed, the same argumentation would predict a similar, although considerably smaller increase rather than a decrease of res. Instead, the observed destabilization of the water molecules in the surface layer is likely to be related to the steric restrictions implied by the nearby CCl4 molecules. This point will further be addressed in sec.
3.5 of the paper.
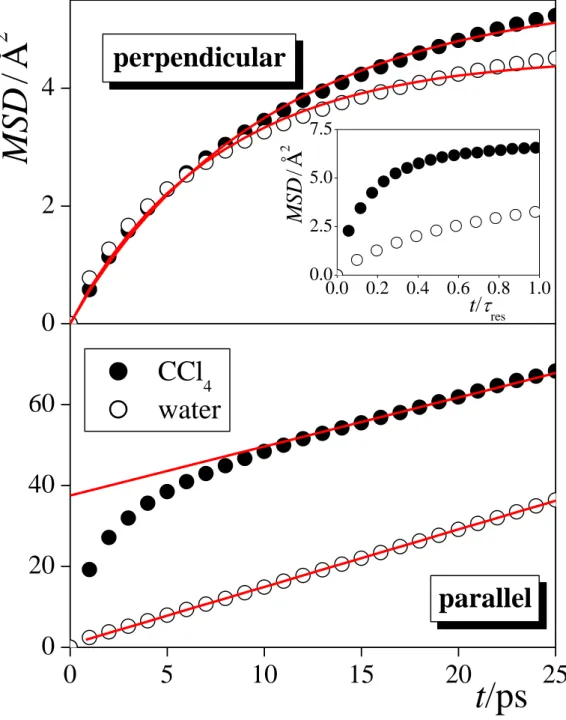
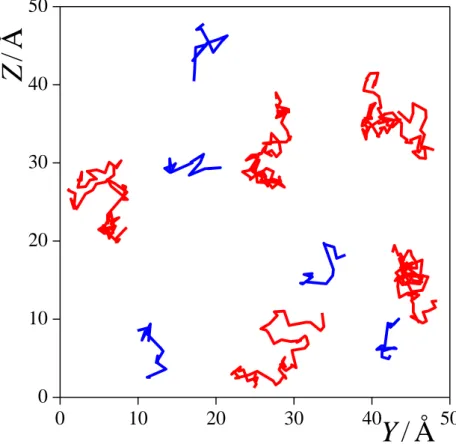
3.3. Surface Diffusion. The time dependence of the mean square displacement of the surface molecules both in perpendicular and parallel directions with the macroscopic plane of the interface, YZ, are shown in Figure 4 along with the results of best fits to eqs. 3 (for D||) and 5 (for D), as obtained in the surface layers of both liquid phases. The simulated data are always rather well fitted by the corresponding functions. The values of the diffusion coefficients along with the effective width of the first layer, Leff, resulted from these fits, and the average number of the surface molecules, <Nsurf>, are collected in Table 3. The characteristic time of the (lateral) surface diffusion of the molecules, D, calculated from eq. 6, are included in Table 2. In the case of CCl4, D is indeed significantly smaller than res, indicating that CCl4 molecules perform considerable lateral diffusion during their permanence at the liquid surface. On the other hand, in the case of water, D is only slightly (i.e., by about 25%) smaller than res, indicating that although surface diffusion of the molecules can still be meaningfully discussed, it occurs on a similar time scale as the exchange of the molecules between the surface layer and the bulk liquid phase. This finding is illustrated in Figure 5, showing the lateral (i.e., YZ) trajectories of 5-5 randomly chosen water and CCl4 molecules, the surface residence times of which roughly equals to the corresponding mean value of res, during their entire stay within the surface layer. The above result is corroborated by the fact that while the time dependence of the perpendicular MSD of the surface CCl4 molecules
clearly shows the saturation behavior of eq. 5 even on the time scale of the mean surface residence time of the molecules, this MSD vs. t/res curve is nearly linear (i.e., corresponds to the nearly linearly rising part of eq. 5 at short times) for water (see the inset of Fig. 4). This finding indicates that, in contrast with CCl4, water molecules can practically freely diffuse within the surface layer even along the macroscopic surface normal during the time of their permanence at the liquid-liquid interface. This picture clearly differs from what was previously observed at the liquid-vapor interface of water [!73,74] as well as other molecular liquids. [!74]
As it is seen from Table 3, both D|| and D are considerably, i.e., by about 25-35%, larger than the isotropic diffusion coefficient in the bulk liquid phase, Dbulk, but they are much smaller than the corresponding values obtained at the liquid-vapor interface in the case of both liquids. This finding suggests that the mobility of the molecules is considerably more restricted at the liquid-liquid than at the liquid-vapor interface, due to the fact that they are now surrounded by neighbors in all directions. On the other hand, this mobility is still less restricted than in the corresponding bulk liquid phases, in accordance with earlier results [!18,92] as well as our above finding that the surface layers of the two opposite phases are less tightly packed together than the molecules around each other in either of the two phases.
Finally, it should be noted that, similarly to the survival probability, L(t), the MSD(t) data corresponding to the second and subsequent molecular layers (not shown) are rather similar to each other, but differ considerably from that of the first layer. Further, the D|| values obtained in the second and subsequent layers scatter in the range of 0.27 ± 0.01 Å2/ps for water, and 0.245 ± 0.02 Å2/ps for CCl4. These values are very close to the corresponding three-dimensional bulk phase diffusion coefficient values of 0.26 Å2/ps (water) [!73] and 0.24 Å2/ps (CCl4). [!74] This result clearly confirms our claim that, from the dynamical point of view, only the first molecular layer differs from the bulk liquid phase at the liquid-liquid interface, while the second and subsequent molecular layers can already be regarded as part of the bulk liquid phase.
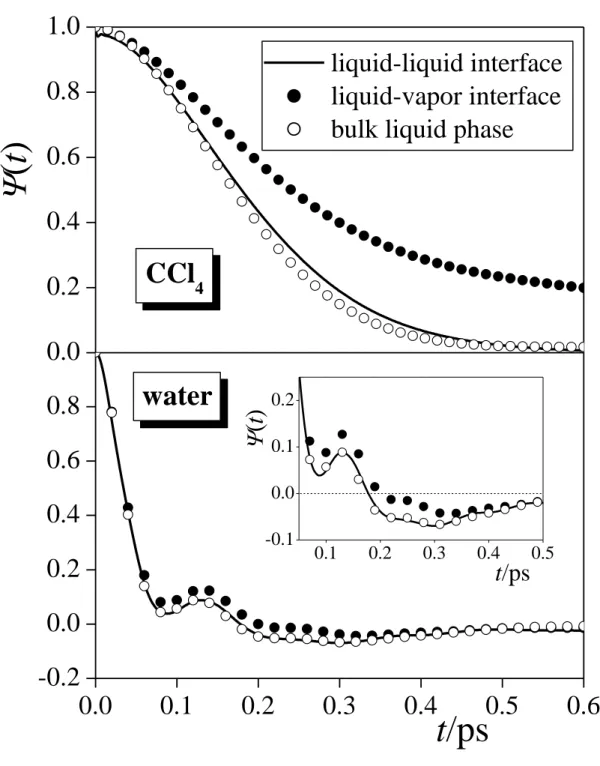
3.4. Velocity Autocorrelation Function at the Intrinsic Liquid Surface. The center- of-mass velocity autocorrelation functions of the first layer CCl4 and water molecules in the macroscopic plane of the surface, ||(t), are shown and compared with those obtained at the liquid-vapor interface and in the bulk liquid phase of the respective systems [!74] in Figure 6.
As it has already been discussed previously, [!74] the velocity autocorrelation functions
obtained at the liquid-vapor interface always decrease slower in the initial, rapidly decaying part (i.e., up to about 0.3-0.5 ps) than the corresponding bulk phase ones. The reason of this increased correlation is that, at the liquid surface, the motion of the molecules is subject to weaker steric restriction due to the lack of neighbors from the opposite phase. [!74] This view is fully supported by the present results, showing that in the surface layers at the liquid-liquid interface (i.e., where the steric restriction of the molecular motions is not considerably weaker than in the bulk), the autocorrelation of the in-plane velocities agree very well with those obtained in the bulk liquid phases.
The ||(t) function obtained at the surface of the CCl4 phase is thus decaying monotonously, resembling a memory-less process. Similarly to the bulk liquid phase and the liquid-vapor interface, ||(t) does not drop to negative values, indicating the lack of caging effect (i.e., when the molecule, approaching one of its neighbors too closely, is repelled by this neighbor, and hence its velocity changes sign) for CCl4. The ||(t) curve obtained at the surface of the water phase exhibits an oscillation with a period of about 0.125 ps, resulting in additional maxima of rapidly decaying amplitude around 0.13 and 0.25 ps. This oscillation is clearly a sign of hydrogen bonding. [!93] Further, the function drops below zero at about 0.18 ps, and approaches zero from the negative side, which is a clear indication of the caging effect. Although this caging effect was also seen to be present at the liquid-vapor interface, [!74] here it is clearly more pronounced, being similar to that in bulk water, reflecting simply that, similarly to their bulk liquid phase, water molecules are also surrounded by a “cage” of near neighbors at the liquid-liquid interface.
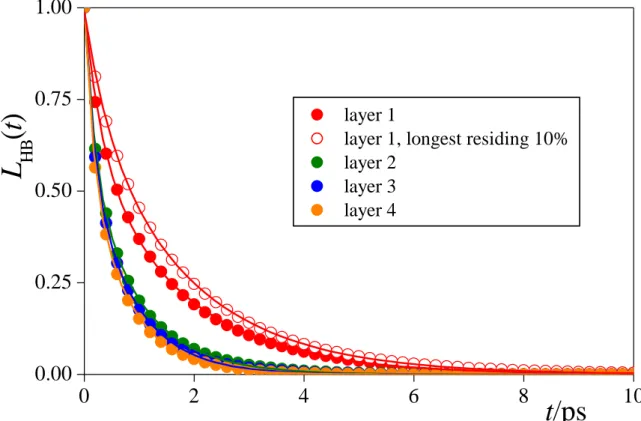
3.5. Hydrogen Bonding at the Intrinsic Water Surface. The survival probabilities of the hydrogen bonds involving a water molecule that belongs to the first, second, third, and fourth molecular layer, respectively, beneath the interface, LHB(t), is shown in Figure 7. For comparison, the LHB(t) curve corresponding solely to such hydrogen bonds that involve a surface water molecule being among the longest residing 10% of the water molecules in the surface layer is also shown. Hydrogen bond between a molecule pair can be defined in several ways in computer simulations without using arbitrarily chosen cut-off values. [!94-97] Here we use a purely geometric definition, [!94] namely we consider two water molecules as being hydrogen bonded to each other if the distance of their O atoms and their shortest intermolecular O-H distance is below the first minimum positions of the respective partial radial distribution functions (i.e., 3.35 Å and 2.45 Å, respectively). Further, a water molecule
is regarded to belong to the longest residing 10% of the molecules at the water surface if it survives, from the given frame on, at least 20 ps in the surface layer. The value of 20 ps corresponds to the time at which the survival probability of the water molecules in the surface layer, L(t), drops to 0.1 (see Fig. 3).
The obtained LHB(t) data can be very well fitted by a biexponential function (see eq. 1) in every case, indicating that these H-bonds can break either, on a shorter time scale, temporarily, due to a fast vibration of the molecules, or, on a longer time scale, permanently.
The shorter of the two characteristic times has turned out to be very small, being 3-5 times smaller than the longer one, and always below 0.4 ps. Therefore, the value of the longer characteristic time, denoted here as HB, can be regarded as the mean lifetime of the corresponding H-bonds. The values of HB are included in Table 2 as obtained in the first four subsurface molecular layers of water. The value of HB is roughly 6 times smaller than res in the first layer, and about 3 times smaller than res in the subsequent layers, indicating that the properties of the H-bonds in a given subsurface layer can indeed be meaningfully discussed. It is also seen that the H-bonds involving a surface water molecule live considerably (i.e., by a factor of 2) longer, and hence they are expected to be noticeably stronger than those in the subsequent molecular layers. Further, H-bonds live about 25% longer at the water-CCl4
liquid-liquid interface than those at the liquid-vapor interface of water. [!73,74]
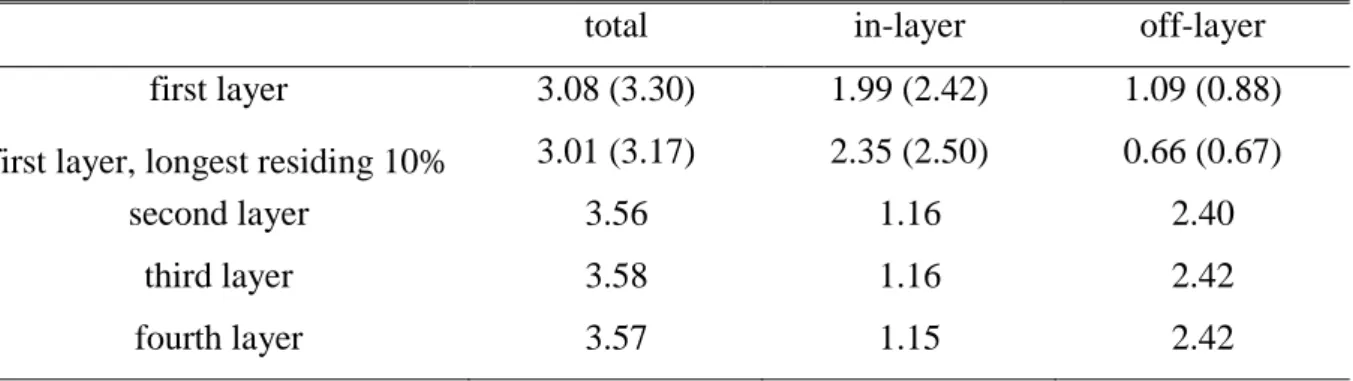
The average number of H-bonds, formed by water molecules that belong to the first, second, third, and fourth subsurface layer, are collected in Table 4. For comparison, the value corresponding to the longest residing 10% of the surface molecules is also included in the table. Further, the total number of H-bonds formed by these water molecules is also divided to H-bonds formed with a neighbor that belongs to the same subsurface layer (“in-layer” H- bonds) and to ones formed with a neighbor belonging to another layer (“off-layer” H-bonds).
The average number of the in-layer and off-layer H-bonded neighbors are also included in Table 4. These results show that surface water molecules form, on average, considerably less H-bonds with their neighbors than those of the subsequent layers. This is not surprising, since no H-bonds can be formed by the surface molecules to the direction of the CCl4 phase.
Correspondingly, the number of off-layer neighbors of the surface molecules is roughly half of that of the molecules belonging to the subsequent layers, reflecting simply the fact that while the first layer has only one neighboring water layer, from the second layer on each layer has two. On the other hand, the average number of in-layer H-bonds formed by the surface water molecules is much, i.e., by about 70%, larger than that in the subsequent layers. The
reason of that is that water molecules in the surface layer adopt such orientations that allow them to maximize the number of their H-bonds, [!17,18,92,98] and since no H-bonds can be formed to the direction of the opposite phase, this can be done by increasing the number of in- layer H-bonds. Further, it is also seen that the longest residing surface molecules have considerably (i.e., by about 20%) more in-layer, and much (i.e., by about 40%) less off-layer H-bonded neighbors than the average values corresponding to the entire surface layer. Thus, similarly to the liquid-vapor interface, [!73,74] those molecules stay longer at the water surface that are more strongly anchored by their in-layer neighbors to the surface layer, and, at the same time, better isolated from the next, already bulk-like layer.
It is interesting to note that surface water molecules have, on average, slightly (~7%) less H-bonded neighbors at the interface with CCl4 than at that with the vapor phase. Further, the mean number of in-layer H-bonded neighbors is about 20% smaller, while that of the off- layer neighbors is about 20% larger if the opposite phase is CCl4 rather than vapor. This result suggests that the vicinity of the CCl4 molecules implies a certain steric restriction also on the orientation of the surface water molecules and, hence, they cannot form as many in-layer H- bonds with each other as in the lack of such steric restriction, i.e., at the water-vapor interface.
This loss of in-layer H-bonds is partly compensated by the concomitant increase of the number of off-layer H-bonded neighbors. As a consequence, at the water-CCl4 interface surface water molecules are considerably less strongly anchored within the surface layer, and are less isolated from the (already bulk-like) second layer of the water phase than those at the water-vapor interface. This finding also explains why water molecules survive, on average, 30% less in the surface layer at the water-CCl4 than at the water-vapor interface (see Table 2).
4. Conclusions
In this paper, we have investigated in detail the dynamics of the single molecules at the intrinsic water-CCl4 liquid-liquid interface, and compared the results to those previously obtained [!74] at the respective liquid-vapor interfaces. It is found that the presence of a condensed phase at the opposite side of the interface has a dual effect on the dynamical properties of the surface molecules. First, in the presence of a condensed opposite phase, the surface molecules experience additional attraction from the opposite phase molecules, an effect that is evidently far more important for the CCl4 than for the water molecules. This additional attraction from the nearby aqueous phase stabilizes the permanence of the CCl4
molecules at the surface of their phase, and thus leads to a considerable increase of their mean
surface residence time. Second, in spite of the fact that the two surface layers are not as closely attached together at the liquid-liquid interface as the subsequent subsurface layers in either of the two phases, the presence of a condensed opposite phase certainly sets some steric restrictions to the surface molecules, which affect their dynamics and, in the case of water, also their orientation. Due this latter effect, surface water molecules have less in-layer, and thus, as a compensation of that, more off-layer H-bonded neighbors, and hence they are less isolated from the rest of the system than at the liquid-vapor interface, which results in a 30%
decrease of their mean surface residence time. The steric restriction imposed by the molecules of the opposite phase also slows down the dynamics of the surface molecules, which is reflected both in their slower diffusion and weaker and in the shorter lasting autocorrelation of their in-plane velocities.
The slower diffusion and shorter mean surface residence time of the surface water molecules implies that, contrary to the liquid-vapor interface, [!74] the time scale of the diffusion of the surface water molecules is comparable, yet still somewhat smaller than that of their permanence at the surface. Thus, a surface water molecule cannot explore a considerably larger area during its diffusion than the mean surface area per molecule while it is at the liquid surface. Similarly, its diffusion along the macroscopic surface normal axis turns out to be almost unrestricted, as it leaves the liquid surface before it could experience the restriction set by the width of the surface layer. On the other hand, the formation and breaking of the H- bonds at the water surface as well as the diffusion of the molecules at the CCl4 surface occur on considerably shorter time scales than the mean surface residence time of the respective molecules.
Finally, it is also found that, from the dynamical point of view, only the first layer differs considerably from the bulk phase of the corresponding liquid. This is evidently seen from the respective diffusion coefficient values (Table 3), but is also reflected in the mean lifetime and number of H-bonds (Tables 2 and 4, respectively), as well as in the very small mean residence time values of the molecules in the second and subsequent layers (Table 2).
Acknowledgements. This work has been supported by the Hungarian NKFIH Foundation under Project Nos. 120075 and 119732, and by the EFOP project “Complex Development of Research Capacities and Services at the Eszterhazy Karoly University” under project No. EFOP-3.6.1-16-2016-00001.
References
(1) Shen, Y. R. The Principles of Nonlinear Optics, Wiley-Interscience: New York, 1984.
(2) Franken, P.; Hill, A.; Peters, C.; Weinreich, G. Generation of Optical Harmonics.
Phys. Rev. Letters 1961, 7, 118-120.
(3) Bloembergen, N.; Pershan, P. S. Light Waves at Boundary of Nonlinear Media. Phys.
Rev. 1962, 128, 606-623.
(4) Eisenthal, K. B. Liquid Interfaces Probed by Second-Harmonic and Sum-Frequency Spectroscopy. Chem. Rev. 1996, 96, 1343–1360.
(5) Shen, Y. R. Surface Properties Probed by Second-Harmonic and Sum-Frequency Generation. Nature, 1989, 337, 519-525.
(6) Richmond, G. L. Molecular Bonding and Interactions at Aqueous Surfaces as Probed by Vibrational Sum Frequency Spectroscopy. Chem. Rev. 2002, 102, 2693-2724.
(7) Daillant, J.; Gibaud, A. X-Ray and Neutron Reflectivity: Principles and Applications, Springer: Berlin, 1999.
(8) Penfold, J. Neutron Reflectivity and Soft Condensed Matter. Curr. Opin. Colloid Interface Sci. 2002, 7, 139-147.
(9) Tolan, M.; X-Ray Scattering from Soft-Matter Thin Films, Springer: Berlin, 1999.
(10) Jähnig, F., Structural Order of Lipids and Proteins in Membranes: Evaluation of Fluorescence Anisotropy Data. Proc. Natl. Acad. Sci. USA 1979, 76, 6361-6365.
(11) Cross, A. J.; Fleming, G. R. Analysis of Time-Resolved Fluorescence Anisotropy Decays. Biophys. J. 1984, 46, 45-56.
(12) Allen, M. P.; Tildesley, D. J. Computer Simulation of Liquids; Clarendon Press:
Oxford, 1987.
(13) Rowlinson, J. S.; Widom, B. Molecular Theory of Capillarity; Dover Publications:
Mineola, 2002.
(14) Linse, P. Monte Carlo Simulation of Liquid-Liquid Benzene-Water Interface. J. Chem.
Phys. 1987, 86, 4177-4187.
(15) Benjamin, I. Theoretical Study of the Water/1,2-Dichloroethane Interface: Structure, Dynamics, and Conformational Equilibria at the Liquid-Liquid Interface. J. Chem.
Phys. 1992, 97, 1432-1445.
(16) Benjamin, I. Structure, Thermodynamics, and Dynamics of the Liquid/Vapor Interface of Water/Dimethylsulfoxide Mixtures. J. Chem. Phys. 1999, 110, 8070-8079.
(17) Pártay, L. B.; Hantal, Gy.; Jedlovszky, P.; Vincze, Á.; Horvai, G. A New Method for Determining the Interfacial Molecules and Characterizing the Surface Roughness in
Computer Simulations. Application to the Liquid–Vapor Interface of Water. J. Comp.
Chem. 2008, 29, 945-956.
(18) Hantal, Gy.; Darvas, M.; Pártay, L. B.; Horvai, G.; Jedlovszky, P. Molecular Level Properties of the Free Water Surface and Different Organic Liquid/Water Interfaces, As Seen from ITIM Analysis of Computer Simulation Results. J. Phys.: Condens.
Matter 2010, 22, 284112-1-14.
(19) Pártay, L. B.; Jedlovszky, P.; Vincze, Á.; Horvai, G. Properties of Free Surface of Water-Methanol Mixtures. Analysis of the Truly Interfacial Molecular Layer in Computer Simulation. J. Phys. Chem. B. 2008, 112, 5428-5438.
(20) Pártay, L. B.; Horvai, G.; Jedlovszky, P. Temperature and Pressure Dependence of the Properties of the Liquid-Liquid Interface. A Computer Simulation and Identification of the Truly Interfacial Molecules Investigation of the Water-Benzene System. J.
Phys. Chem. C. 2010, 114, 21681-21693.
(21) Chacón, E.; Tarazona, P. Intrinsic Profiles Beyond the Capillary Wave Theory: A Monte Carlo Study. Phys Rev. Letters 2003, 91, 166103-1-4.
(22) Chowdhary, J.; Ladanyi, B. M. Water-Hydrocarbon Interfaces: Effect of Hydrocarbon Branching on Interfacial Structure. J. Phys. Chem. B. 2006, 110, 15442-15453.
(23) Jorge, M.; Cordeiro, M. N. D. S. Intrinsic Structure and Dynamics of the Water/Nitrobenzene Interface. J. Phys. Chem. C. 2007, 111, 17612-17626.
(24) Jorge, M.; Jedlovszky, P.; Cordeiro, M. N. D. S. A Critical Assessment of Methods for the Intrinsic Analysis of Liquid Interfaces. 1. Surface Site Distributions. J. Phys.
Chem. C. 2010, 114, 11169-11179.
(25) Wilard, A. P.; Chandler, D. Instantaneous Liquid Interfaces. J. Phys. Chem. B. 2010, 114, 1954-1958.
(26) Sega, M.; Kantorovich, S.; Jedlovszky, P; Jorge, M. The Generalized Identification of Truly Interfacial Molecules (ITIM) Algorithm for Nonplanar Interfaces. J. Chem.
Phys. 2013, 138, 044110-1-10.
(27) Škvor, J.; Škvára, J. Jirsák, J.; Nezbeda, I. A General Method for Determining Molecular Interfaces and Layers. J. Mol. Graphics Mod. 2017, 76, 17-35.
(28) Tarazona, P.; Chacón, E. Monte Carlo Intrinsic Surfaces and Density Profiles for Liquid Surfaces. Phys. Rev. B 2004, 70, 235407-1-13.
(29) Chacón, E.; Tarazona, P. Characterization of the Intrinsic Density Profiles for Liquid Surfaces. J. Phys.: Condens. Matter 2005, 17, S3493-S3498.
(30) Jorge, M.; Cordeiro, M. N. D. S. Molecular Dynamics Study of the Interface between Water and 2-Nitrophenyl Octyl Ether. J. Phys. Chem. B 2008, 112, 2415-2429.
(31) Jorge, M.; Hantal, G.; Jedlovszky, P.; Cordeiro, M. N. D. S. A Critical Assessment of Methods for the Intrinsic Analysis of Liquid Interfaces: 2. Density Profiles. J. Phys.
Chem. C. 2010, 114, 18656-18663.
(32) Sega, M.; Fábián, B.; Jedlovszky, P. Layer-by-Layer and Intrinsic Analysis of Molecular and Thermodynamic Properties across Soft Interfaces. J. Chem. Phys. 2015, 143, 114709-1-8.
(33) Bresme, F.; Chacón, E.; Tarazona, P.; Wynveen, A. The Structure of Ionic Aqueous Solutions at Interfaces: An Intrinsic Structure Analysis. J. Chem. Phys. 2012, 137, 114706-1-10.
(34) Sega, M.; Fábián, B.; Horvai, G.; Jedlovszky, P. How Is the Surface Tension of Various Liquids Distributed along the Interface Normal? J. Phys. Chem. C 2016, 120, 27468-27477.
(35) Sega, M.; Fábián, B.; Imre, A. R.; Jedlovszky, P. Relation between the Liquid Spinodal Pressure and the Lateral Pressure Profile at the Liquid-Vapor Interface. J.
Phys. Chem. C 2017, 121, 12214-12219.
(36) Hantal, Gy.; Sega, M.; Horvai, G,; Jedlovszky, P. Contribution of Different Molecules and Moieties to the Surface Tension in Aqueous Surfactant Solutions. J. Phys. Chem.
C 2019, 121, 16660-16670.
(37) Darvas, M.; Jorge, M.; Cordeiro, M. N. D. S.; Kantorovich, S. S.; Sega, M.;
Jedlovszky, P. Calculation of the Intrinsic Solvation Free Energy Profile of an Ionic Penetrant Across a Liquid/Liquid Interface with Computer Simulations. J. Phys.
Chem. B 2013, 117, 16148-16156.
(38) Darvas, M.; Jorge, M.; Cordeiro, M. N. D. S.; Jedlovszky, P. Calculation of the Intrinsic Free Energy Profile of Methane Across a Liquid/Liquid Interface in Computer Simulations. J. Mol. Liquids 2014, 189, 39-43.
(39) Fábián, B.; Szőri, M.; Jedlovszky, P. Floating Patches of HCN at the Surface of Their Aqueous Solutions – Can They Make “HCN World” Plausible? J. Phys. Chem. C 2014, 118, 21469-21482.
(40) Kiss, B.; Fábián, B.; Idrissi, A.; Szőri, M.; Jedlovszky, P. Investigation of the Liquid- Vapor Interface of Water-Formamide Mixtures by Computer Simulation and Intrinsic Surface Analysis. J. Phys. Chem. C. 2018, 122, 19639-19651.
(41) Horváth, R. A.; Fábián, B.; Szőri, M.; Jedlovszky, P. Investigation of the Liquid- Vapour Interface of Aqueous Methylamine Solutions by Computer Simulation Methods. J. Mol. Liquids 2019, 288, 110978-1-14.
(42) Horváth, R. A.; Hantal, Gy.; Picaud, S.; Szőri, M.; Jedlovszky, P. Adsorption of Methylamine on Amorphous Ice under Interstellar Conditions. A Grand Canonical Monte Carlo Simulation Study. J. Phys. Chem. A 2018, 122, 3398-3412.
(43) Kiss, B.; Picaud, S.; Szőri, M.; Jedlovszky, P. Adsorption of Formamide at the Surface of Amorphous and Crystalline Ices under Interstellar and Tropospheric Conditions. A Grand Canonical Monte Carlo Simulation Study. J. Phys. Chem. A 2019, 123, 2935- 2948.
(44) Delgado-Buscalioni, R.; Chacón, E.; Tarazona, P. Hydrodynamics of Nanoscopic Capillary Waves. Phys. Rev. Letters 2008, 101, 106102-1-4.
(45) Delgado-Buscalioni, R.; Chacón, E.; Tarazona, P. Capillary Waves' Dynamics at the Nanoscale, J. Phys.: Condens. Matter 2008, 20, 494229-1-6.
(46) Duque, D.; Tarazona, P.; Chacón, E. Diffusion at the Liquid-Vapor Interface. J. Chem.
Phys. 2008, 128, 134704-1-10.
(47) Chacón, E.; Fernandez, E. M.; Tarazona, P.; Effect of Dispersion Forces on the Capillary-Wave Fluctuations of Liquid Surfaces. Phys Rev. E 2014, 89, 042406-1-9.
(48) Muscatello, J.; Chacón, E.; Tarazona, P.; Bresme, F. Deconstructing Temperature Gradients across Fluid Interfaces: The Structural Origin of the Thermal Resistance of Liquid-Vapor Interfaces. Phys Rev. Letters 2017, 119, 045901-1-5.
(49) Hantal, G.; Cordeiro, M. N. D. S.; Jorge, M. What Does an Ionic Liquid Surface Really Look Like? Unprecedented Details from Molecular Simulations. Phys. Chem.
Chem. Phys. 2011, 13, 21230-21232.
(50) Lísal, M.; Posel, Z.; Izák, P. Air–Liquid Interfaces of Imidazolium-Based [TF2N-] Ionic Liquids: Insight from Molecular Dynamics Simulations. Phys. Chem. Chem.
Phys. 2012, 14, 5164-5177.
(51) Hantal, G.; Voroshylova, I.; Cordeiro, M. N. D. S.; Jorge, M. A Systematic Molecular Simulation Study of Ionic Liquid Surfaces Using Intrinsic Analysis Methods. Phys.
Chem. Chem. Phys. 2012, 14, 5200-5213.
(52) Lísal, M.; Izák, P. Molecular Dynamics Simulations of n-Hexane at 1-Butyl-3- Methylimidazolium bis(Trifluoromethylsulfonyl) Imide Interface. J. Chem. Phys.
2013, 139, 014704-1-15.
(53) Hantal, G.; Sega, M.; Kantorovich, S.; Schröder, C.; Jorge, M. Intrinsic Structure of the Interface of Partially Miscible Fluids: An Application to Ionic Liquids. J. Phys.
Chem. C. 2015, 119, 28448-28461.
(54) Sega, M.; Hantal, G. Phase and Interface Determination in Computer Simulations of Liquid Mixtures with High Partial Miscibility. Phys. Chem. Chem. Phys. 2017, 19, 18968-18974.
(55) Shelepova, E. A.; Kim, A. V.; Voloshin, V. P.; Medvedev, N. N. Intermolecular Voids in Lipid Bilayers in the Presence of Glycyrrhizic Acid. J. Phys. Chem. C. 2018, 122, 9938-9946.
(56) Sega, M.; Horvai, G.; Jedlovszky, P. Microscopic Origin of the Surface Tension Anomaly of Water. Langmuir 2014, 30, 2969-2972.
(57) Sega, M.; Horvai, G.; Jedlovszky, P. Two-Dimensional Percolation at the Free Water Surface and its Relation with the Surface Tension Anomaly of Water. J. Chem. Phys.
2014, 141, 054707-1-11.
(58) Sega, M.; Fábián, B.; Jedlovszky, P. Nonzero Ideal Gas Contribution to the Surface Tension of Water. J. Phys. Chem. Lett. 2017, 8, 268-2612.
(59) Abrankó-Rideg, N.; Darvas, M.; Horvai, G.; Jedlovszky, P. Immersion Depth of Surfactants at the Free Water Surface: A Computer Simulation and ITIM Analysis Study. J. Phys. Chem. B 2013, 117, 8733-8746.
(60) Bresme, F.; Chacón, E.; Martínez, H.; Tarazona, P. Adhesive Transitions in Newton Black Films: A Computer Simulation Study. J. Chem. Phys. 2011, 134, 214701-1-12.
(61) Michael, D.; Benjamin, I. Solute Orientational Dynamics and Surface Roughness of Water/Hydrocarbon Interfaces. J. Phys. Chem. 1995, 99, 1530-1536.
(62) Lindahl, E; Edholm, O. Solvent Diffusion Outside Macromolecular Surfaces. Phys.
Rev. E 1998, 57, 791-796.
(63) Michael, D.; Benjamin, I. Molecular Dynamics Computer Simulations of Solvation Dynamics at Liquid/Liquid Interfaces. J. Chem. Phys. 2001, 114, 2817-2824.
(64) Åman, K.; Lindahl, E.; Edholm, O.; Håkansson, P.; Westlund, P. O. Structure and Dynamics of Interfacial Water in an L Phase Lipid Bilayer from Molecular Dynamics Simulations. Biophys. J. 2003, 84, 102-115.
(65) Liu, P.; Harder, E.; Berne, B. On the Calculation of Diffusion Coefficientsin Confined Fluids and Interfaces with an Application to the Liquid-Vapor Interface of Water. J.
Phys. Chem. B 2004, 108, 6595-6602.
(66) Bühn, J. B.; Bopp, P. A.; Hampe, M. J. A Molecular Dynamics Study of the Liquid- Liquid Interface: Structure and Dynamics. Fluid Phase Equilib. 2004, 224, 221-230.
(67) Sega, M.; Vallauri, R.; Melchionna, S. Diffusion of Water in Confined Geometry: The Case of a Multilamellar Bilayer. Phys. Rev. E 2005, 72, 041201-1-4.
(68) Bhide, S. Y.; Berkowitz, M. L. Structure and Dynamics of Water at the Interface with Phospholipid Bilayers. J. Chem. Phys. 2005, 123, 224702-1-16.
(69) Benjamin, I. Solute Orientational Dynamics at the Water/Carbon Tetrachloride Interface. J. Phys. Chem. C 2008, 112, 8969-8975.
(70) Benjamin, I. Solute Dynamics at Aqueous Interfaces, Chem. Phys. Letters 2009, 469, 229-241.
(71) Benjamin, I. Reactivity and Dynamics at Liquid Interfaces. In: Reviews in Computational Chemistry, Parrill, A. L.; Lipkowitz, K. B., Eds.; Wiley: Chichester, 2015; Vol. 28, pp. 205-313.
(72) Chowdhary, J.; Ladanyi, B. M. Water-Hydrocarbon Interfaces: Effect of Hydrocarbon Branching on Single-Molecule Relaxation. J. Phys. Chem. B. 2008, 112, 6259-6273.
(73) Fábián, B.; Senćanski, M. V.; Cvijetić, I. N.; Jedlovszky, P.; Horvai, G. Dynamics of the Water Molecules at the Intrinsic Liquid Surface As Seen from Molecular Dynamics Simulation and Identification of Truly Interfacial Molecules Analysis. J.
Phys. Chem. C. 2016, 120, 8578-8588.
(74) Fábián, B.; Horvai, G.; Sega, M.; Jedlovszky, P. Single Particle Dynamics at the Intrinsic Surface of Various Apolar, Aprotic Dipolar, and Hydrogen Bonding Liquids As Seen from Computer Simulations. J. Phys. Chem. B. 2017, 121, 5582-5594.
(75) Karnes, J. J.; Benjamin, I. Miscibility at the Immiscible Liquid/Liquid Interface: A Molecular Dynamics Study of Thermodynamics and Mechanism. J. Chem. Phys.
2018, 148, 034707-1-10.
(76) Duffy, E. M.; Severance, D. L.; Jorgensen, W. L. Solvent Effects on the Barrier to Isomerization for a Tertiary Amide from Ab Initio and Monte Carlo Calculations. J.
Am. Chem. Soc. 1992, 114, 7535–7542.
(77) Berendsen, H. J. C.; Grigera, J. R.; Straatsma, T. The Missing Term in Effective Pair Potentials. J. Phys. Chem. 1987, 91, 6269-6271.
(78) Essman, U.; Perera, L.; Berkowitz, M. L.; Darden, T.; Lee, H.; Pedersen, L. G. A Smooth Particle Mesh Ewald Method. J. Chem. Phys. 1995, 103, 8577-8594.
(79) Pronk, S.; Páll, S.; Schulz, R.; Larsson, P.; Bjelkmar, P.; Apostolov, R.; Shirts, M. R.;
Smith, J. C.; Kasson, P. M.; van der Spoel; D., et al. GROMACS 4.5: A High-
Throughput and Highly Parallel Open Source Molecular Simulation Toolkit.
Bioinformatics 2013, 29, 845–854.
(80) Ryckaert, J. P.; Ciccotti, G.; Berendsen, H. J. C. Numerical Integration of the Cartesian Equations of Motion of a System With Constraints; Molecular Dynamics of n-Alkanes. J. Comp. Phys. 1977, 23, 327–341.
(81) Nosé, S. A Molecular Dynamics Method for Simulations in the Canonical Ensemble.
Mol. Phys. 1984, 52, 255-268.
(82) Hoover, W. G. Canonical Dynamics: Equilibrium Phase-Space Distributions. Phys.
Rev. A 1985, 31, 1695-1697.
(83) Parrinello, M.; Rahman, A. Polymorphic Transitions in Single Crystals: A New Molecular Dynamics Method. J. Appl. Phys. 1981, 52, 7182-7190.
(84) Sega, M. The Role of a Small Scale Cutoff in Determining Molecular Layers at Fluid Interfaces. Phys. Chem. Chem. Phys. 2016, 18, 23354-23357.
(85) URL: https://github.com/Marcello-Sega/pytim
(86) Sega, M.; Hantal, Gy.; Fábián, B.; Jedlovszky, P. Pytim: A Python Package for the Interfacial Analysis of Molecular Simulations. J. Comp. Chem., 2018, 39, 2118-2125.
(87) Luzar, A.; Chandler, D. Hydrogen-Bond Kinetics in Liquid Water. Nature 1996, 379, 55-57.
(88) Chaikin, P. M.; Lubensky, T. C. Principles of Condensed Matter Physics; Cambridge University Press: Cambridge, 1995.
(89) Rideg, N. A.; Darvas, M.; Varga, I.; Jedlovszky, P. Lateral Dynamics of Surfactants at the Free Water Surface. A Computer Simulation Study. Langmuir 2012, 28, 14944- 14953.
(90) Balucani, U.; Zoppi, M. Dynamics of the Liquid State; Clarendon Press: Oxford, 1995.
(91) Chowdhary, J.; Ladanyi, B. M. Surface Fluctuations at the Liquid-Liquid Interface.
Phys. Rev. E 2008, 77, 031609-1-14.
(92) Pártay, L. B.; Horvai, G.; Jedlovszky, P. Molecular Level Structure of the Liquid- Liquid Interface. Molecular Dynamics Simulation and ITIM Analysis of the Water- CCl4 System. Phys. Chem. Chem. Phys. 2008, 10, 4754.
(93) Balucani, U.; Brodholt, J. P.; Vallauri, R, Analysis of the Velocity Autocorrelation Function of Water. J. Phys.: Condens. Matter 1996, 8, 6139-6144.
(94) Jedlovszky, P.; Brodholt, J. P.; Bruni, F.; Ricci, M. A.; Soper, A. K.; Vallauri, R.
Analysis of the Hydrogen-Bonded Structure of Water from Ambient to Supercritical Conditions. J. Chem. Phys. 1998, 108, 8528-8540.
(95) Kumar, R.; Schmidt, J. R.; Skinner, J. L. Hydrogen Bond Definitions and Dynamics in Liquid Water, J. Chem. Phys. 2007, 126, 204107-1-12.
(96) Bakó, I.; Lábas, A.; Hermansson, K.; Bencsura, Á.; Oláh, J. How Can We Detect Hydrogen Bond Local Cooperativity in Liquid Water: A Simulation Study, J. Mol.
Liquids 2017, 245, 140-146.
(97) Dočkal, J.; Svoboda, M.; Lísal, M.; Moučka, F. A General Hydrogen Bonding Definition Based on the Three-Dimensional Spatial Distribution Functions and Its Extension to Quantitative Structural Analysis of Solutions and General Intermolecular Bonds, J. Mol. Liquids 2019, 281, 225-235.
(98) Jedlovszky, P.; Předota, M.; Nezbeda, I. Hydration of Apolar Solutes of Varying Size:
A Systematic Study. Mol. Phys. 2006, 104, 2465-2476.
Tables
TABLE 1. Peak Position and Full Width at Half Maximum of the Gaussian Functions Fitted to the Molecular Number Density Profiles of the First Four Subsurface Molecular Layers in Both Phases.
CCl4 water
X0/Å /Å X0/Å /Å
layer 1 27.51 4.15 22.60 3.55
layer 2 32.91 4.53 20.17 3.37
layer 3 38.37 4.77 17.85 3.22
layer 4 43.88 4.93 15.56 3.13
TABLE 2. Characteristic Times of Various Molecular Processes Occurring at the Surface Layer and Subsequent Molecular Layers of the Two Liquids at the Water-CCl4
Liquid-Liquid Interface. Values in Parenthesis Correspond to the Liquid-Vapor Interface (Ref. [!74]). Error Bars Are Always Below 1%.
layer
CCl4 water
vib/ps res/ps D/ps vib/ps res/ps D/ps HB/ps 1 2.8 (2.5) 86.5 (26.2) 26.0 (7.2) 1.7 (1.7) 10.2 (15.0) 7.5 (4.1) 1.72 (1.36)
2 1.6 9.9 0.8 2.8 0.93
3 1.3 6.8 0.6 2.3 0.82
4 1.2 5.4 0.6 2.1 0.74