1
Temperature-dependent structure of methanol-water mixtures on cooling: X-ray and neutron diffraction and molecular dynamics
simulations
Ildikó Pethes1,a, László Pusztaia,b, Koji Oharac, Shinji Koharad, Jacques Darpentignye, László Temleitnera
aWigner Research Centre for Physics, Konkoly Thege út 29-33., H-1121 Budapest, Hungary
bInternational Research Organization for Advanced Science and Technology (IROAST), Kumamoto University, 2-39-1 Kurokami, Chuo-ku, Kumamoto 860-8555, Japan
cDiffraction and Scattering Division, Japan Synchrotron Radiation Research Institute (JASRI/SPring‐
8), 1‐1‐1 Kouto, Sayo-cho, Sayo-gun, Hyogo 679‐5198, Japan
dResearch Center for Advanced Measurement and Characterization, National Institute for Materials Science (NIMS), 1–1–1 Kouto, Sayo-cho, Sayo-gun, Hyogo 679–5148, Japan
eLaboratoire Léon Brillouin, CEA-Saclay 91191 Gif sur Yvette Cedex France
Abstract
Methanol-water liquid mixtures have been investigated by high-energy synchrotron X-ray and neutron diffraction at low temperatures. We are thus able to report the first complete sets of both X-ray and neutron weighted total scattering structure factors over the entire composition range (at 12 different methanol concentrations (xM) from 10 to 100 mol%) and at temperatures from ambient down to the freezing points of the mixtures. The new diffraction data may later be used as reference in future theoretical and simulation studies. The measured data are interpreted by molecular dynamics simulations, in which the all atom OPLS/AA force field model for methanol is combined with both the SPC/E and TIP4P/2005 water potentials. Although the TIP4P/2005 water model was found to be somewhat more successful, both combinations provide at least semi-quantitative agreement with measured diffraction data. From the simulated particle configurations, partial radial distribution functions, as well as various distributions of the number of hydrogen bonds have been determined. As a general trend, the average number of hydrogen bonds increases upon cooling. However, the number of hydrogen bonds between methanol molecules slightly decreases with lowering temperatures in the concentration range between
1 Corresponding author: e-mail: pethes.ildiko@wigner.hu
2 ca. 30 and 60 mol % alcohol content. The same is valid for water-water hydrogen bonds above 70 mol % of methanol content, from room temperature down to 193 K.
Keywords: X-ray diffraction, neutron diffraction, molecular dynamics simulation, methanol-water mixtures, temperature dependence, hydrogen bonds
1. Introduction
Alcohol-water mixtures have been, and still are, continuously in the center of attention in the physical and chemical sciences (for very recent works, see e.g. [1-15]). Apart from the theoretical and experimental scientific points interest, their technological importance is also notable.
Methanol, the simplest alcohol, is the closest analogue to water, in which one (hydrophilic) proton has been replaced by a (hydrophobic) methyl group. Despite their similar shape and size, this substitution leads to significant differences in terms of the structure of the two liquids, primarily due to the hydrophobic behavior of the methyl group. While the fourfold coordination of water molecules results in a three-dimensional hydrogen bonded (HB) network in liquid water, methanol molecules in pure methanol participate in at most two hydrogen bonds in practice, and form smaller chains [16-19]. In aqueous solutions of methanol, both methanol and water can act as H-donor and H-acceptor, and hydrogen bonded networks can be constructed via water-water, methanol-methanol and methanol-water hydrogen bonded pairs. Methanol molecules in such mixtures may form up to three hydrogen bonds (by one donor and two acceptor sites), whereas water molecules easily coordinate four H-bonded neighbors (via their two donor and two acceptor sites).
The structure of methanol-water mixtures has been the subject of numerous theoretical and simulation studies: the inverse Kirkwood-Buff integral method [20], Monte Carlo simulations [21-27], classical molecular dynamics simulations [2,8,28-40], empirical potential structure refinement [5,41-43], and first-principle density functional theory based (ab initio) molecular dynamics simulations [44-47]
have been employed. Experimental works have been published in the past decades using a wide variety of techniques, such as neutron diffraction (ND) [5,41-43,48,49], X-ray diffraction (XRD) [14,50-52], mass-spectrometry [51,53], microwave dielectric relaxation analysis [54], Raman spectroscopy [55-57],
3 X-ray emission spectroscopy [58], X-ray absorption spectroscopy (XAS) [59], quasielastic neutron scattering [60] and nuclear magnetic resonance (NMR) [61-65].
According to the investigations listed above, a general picture seemed to have emerged as follows.
At low methanol concentrations (xM < 0.3, where xM is the mole fraction of methanol) methanol molecules are independently hydrated by water molecules. The 3D tetrahedral HB network of water molecules is hardly influenced by adding methanol to water; some authors even suggest an enhancement [9]. As the methanol concentration increases, the hydration spheres of methanol molecules overlap, and methanol molecules start to aggregate. According to some authors, the mixing of the two components is incomplete [36,49,58] and separate HB networks of water and methanol were also observed [42]. Around the equimolar composition, a change from the percolated to non-percolate regimes was reported [27]. At high methanol concentrations (xM > 0.7), methanol molecules form (branched) chains (and rarely, rings) and 1D/2D hydrogen bonded clusters of methanol molecules dominate. Water molecules connect the terminals of methanol chains, or form small (water) clusters and these clusters bridge the neighboring methanol hydroxyl groups [49]. Water clusters at low water concentrations and methanol clusters at low methanol concentrations were also reported (see e. g. by NMR [63] or by XAS [59]).
Most of the publications listed above are limited to ambient temperature, only a much smaller number of studies deal with the temperature dependence of the structure [5,8,20,39,43,52,56,60,61,62,64,65]. The same is valid concerning diffraction: while several studies have considered neutron [41,42,48,49] and X-ray [14,50,51] measurements at ambient temperature, diffraction data at lower temperatures are insufficient. Up to now (and to our knowledge), only one set of X-ray diffraction data is available, for the water-rich solutions (at xM = 0.2, 0.3 and 0.4) [52], while two papers are available about neutron diffraction data [5,43] at two methanol concentrations (xM = 0.27 and 0.54), with 2 or 3 temperature points. Interpretation of the X-ray data suggested that the structure of dominant clusters formed in the mixtures at 298 K do not significantly change with lowering the temperatures. The neutron data mentioned above allowed speculations that the ‘micro-segregation’ between methanol and water clusters is enhanced by lowering the temperature.
The most complete investigation of the concentration and temperature dependences of methanol- water solutions was conducted in a series of NMR measurements [61,62,64,65]. Above a concentration dependent crossover temperature hydrophobicity was suggested to play a significant role while below this temperature the tetrahedral network of water molecules network appeared to determine the properties of the solutions.
In a recent publication molecular dynamics simulation data were compared with X-ray diffraction results of Takamuku et al. [8], where the H-bonding structure has been analyzed from simulated particle
4 configurations. Necessarily, this work was limited to the water-rich regime. To extend the investigations to equimolar and methanol-rich mixtures would be desirable, but a complete diffraction data set over the whole range of methanol concentration at temperatures down to the freezing point was missing.
By the present study, we provide additional experimental data on methanol-water liquid mixtures for 12 methanol concentrations, from xM = 0.1 to 1.0. Both X-ray and neutron diffraction total scattering structure factors have been determined at 1 bar and several temperatures, from 300 K down to the freezing points of the mixtures. For a primary interpretation of these, rather large amount of, data, molecular dynamics simulations have been performed using the SPC/E [66] and TIP4P/2005 [67] models for water and the all atom OPLS/AA model [68] for methanol molecules. Various distributions of the number of hydrogen bonds have also been calculated.
2. Experimental details
Both protonated (CH3OH) and deuterated (CD3OD) forms of methyl alcohol (methanol) were purchased from Sigma-Aldrich Co. 12 methanol-water samples were taken for the diffraction experiments, using protonated compounds for X-ray, and the fully deuterated form of methanol and water for neutron measurements. Mixtures with methanol concentrations from 10 mol% to 100 mol%, with 10 mol%
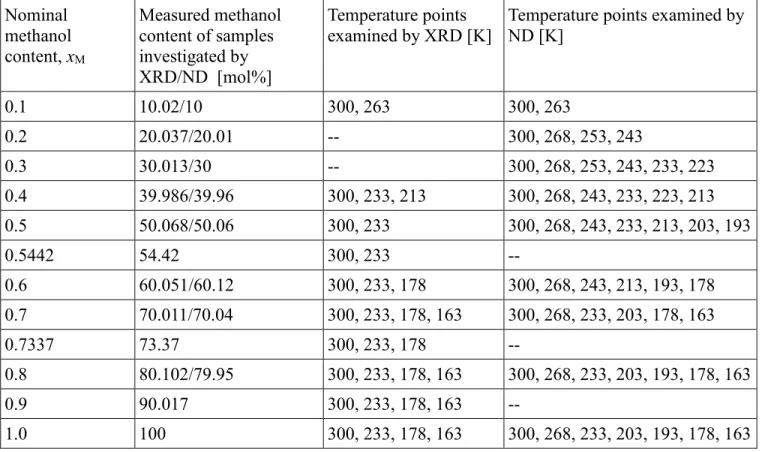
equimolar steps, and additionally with 54.42 and 73.37 mol% (peritectic concentration and close to the eutectic concentration, respectively), were prepared. Nominal and exact compositions are shown in Table 1.
2.1 X-ray diffraction experiments
X-ray diffraction measurements were performed at the BL04B2 high energy X-ray diffraction beamline of the Japan Synchrotron Radiation Research Institute (SPring-8, Hyogo, Japan). The beam energy was 61.2 keV, which corresponds to a wavelength of 0.203 Å. Diffraction patterns were recorded in transmission mode, in the horizontal scattering plane, using an array of 6 solid state detectors. The available range of the scattering vector (Q) was between 0.16 and 16 Å-1. Samples were contained in thin-walled capillaries, with an inner diameter of 2 mm and a wall thickness of 0.15 mm. The entire sample environment was under vacuum. To prevent evaporation, the capillaries were sealed with Torr- seal. After the seal has become sufficiently dry, samples were set in a triple sample holder made from copper and connected directly to the cold head of a closed circle refrigerator (CCR).
5 Temperature was controlled by a LakeShore 331 temperature controller and the measurement software of the beamline was modified to set and register temperatures. The temperature was measured on the surface of the triple sample holder. The possible bias of the temperature at the sample was checked by a calibrated thermocouple at room temperature (297.9 K, +0.1 K from the calibrated temperature) and the observation of monoclinic to fcc phase transition of CCl4 at 223.8 K (225.35 K [69]). This way, the uncertainty of the temperature can be estimated as ±1.5 K. The cooling rate was 1 K/min. Measurements were performed after an equilibration time (15 to 30 min) at each temperature.
Measured intensities were normalized by the incoming beam intensity, and corrected for absorption, polarization and contributions from the empty capillary. The patterns over the entire Q-range were obtained by normalizing and merging each frame, then removing the Compton scattering contributions.
2.2 Neutron diffraction experiments
Series of neutron diffraction measurements performed at the 7C2 diffractometer of Laboratoire Léon- Brillouin [70] using the standard cryostat available at the beamline. Standard 6 mm vanadium cans were used for containing the liquid samples. The incoming wavelength was 0.72 Å, corresponding to a Q- range of 1.06 to 15.7 Å-1. Due to some malfunctioning of a signal processing unit in the group of detectors in the Q-range between 12 and 13 Å-1, datasets were taken only up to 11.8 Å-1 for further investigations.
Each measurement was controlled by software available at the beamline. The summarized datasets were corrected by efficiency, using a vanadium standard. Intensities from the empty container were also subtracted.
All temperatures and compositions visited by X-ray and neutron diffraction experiments are collected in Table 1, and shown superimposed on the phase-diagram of methanol-water mixtures in Fig. 1.
3. Molecular dynamics simulations
Details of the molecular dynamics simulations are provided in the Supplementary Material (SM), here only the main points are described briefly.
Classical molecular dynamics (MD) simulations have been performed by the GROMACS software package (version 2018.2) [73]. The OPLS/AA [68] all atom model was used for methanol, whereas both the SPC/E [66] and TIP4P/2005 [67] models were taken for water molecules. Cubic simulation boxes contained 2000 molecules. NPT (constant pressure 1 bar, and temperature) simulations
6 were conducted in order to determine densities of the mixtures at a given temperature. Densities obtained are collected in Table S3 and S4 in the SM, and are shown in Figures 2 and S1.
101 particle configurations have been collected from long (20 ns) NVT (constant volume and temperature, where the volume is the average value from NPT runs) simulations, 200 ps apart. Neutron and X-ray weighted total scattering structure factors (FN(Q) and FX(Q), respectively) were calculated from the partial radial distribution functions (PRDF, gij(r)), obtained from the particle configurations.
Hydrogen bonds can be defined in various ways [74]: here a geometric definition was applied.
Two molecules are identified as H-bonded if the intermolecular distance between an oxygen and a hydrogen atom is less than 2.5 Å, and the O...O-H angle is smaller than 30 degrees. Calculations concerning H-bonds and H-bonded networks were performed by an in-house programme, based on the HBTOPOLOGY code [75].
4. Results and discussion
4.1 Total structure factors
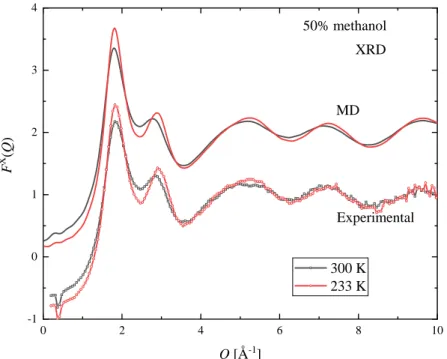
Measured XRD and ND structure factors, at three selected temperatures, are shown in Figures 3 and 4 for xM = 0.7. The complete set of measured curves are shown in the Supplementary Material, Figures S2-S30. At the investigated temperatures and concentrations presented here, Bragg peaks due to crystallization were not observed, not even at temperatures which are slightly below the solid-liquid coexistence curve.
Common features of the XRD structure factors over the entire concentration range are that the first (around Q = 1.85 Å-1) and second maxima (around Q = 2.9 Å-1) become more intense upon cooling.
At room temperature the height of the 2nd peak is decreasing with increasing methanol concentration, and only a shoulder can be observed for the xM ≥ 0.8 mixtures. As temperature decreases a peak around Q = 2.9 Å-1 can be seen even in pure methanol.
The positions of the maxima also depend on temperature. At low methanol concentration (xM = 0.1) the position of the first peak moves to smaller Q values as the temperature decreases. As the methanol content increases the 1st peak position becomes less sensitive to temperature variations -- even constant in the composition range 0.5 ≤ xM ≤ 0.7. Increasing methanol concentration further makes the position of the 1st peak move to slightly higher Q values as the temperature decreases. The composition dependence of the position of the 1st peak is significant at room temperature, but becomes less
7 pronounced upon cooling. The position of the second peak changes monotonously: it moves to higher Q values on decreasing temperature over the entire composition range.
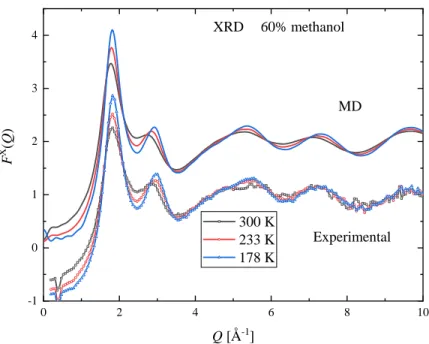
A similar behavior is observed for the first peak (around Q = 1.8 Å-1) of the ND structure factors:
its position moves slightly to lower Q values with decreasing temperatures in mixtures with low methanol content, then stays nearly stable around the equimolar mixture, and later moves to higher Q values in the methanol rich compositions.
The X-ray and neutron weighted total scattering structure factors (FX(Q) and FN(Q), respectively), obtained from MD simulations with the TIP4P/2005 water model (at the same temperatures and concentration as the experimental points), are also shown in Figures 3 and 4. The full set of simulated curves can be found in the Supplementary Material (Figures S2-S47), together with comparisons of the model curves obtained using the TIP4P/2005 and SPC/E water models. The simulated curves follow the same trend as the experimental ones. The temperature dependence of both the 1st and 2nd peaks of FX(Q) and that of the 1st peak of FN(Q), as judged by their heights and positions, are similar in the simulated and measured functions. A small difference concerning the position of the 1st peak of FX(Q) is that in the simulated curves the temperature independent position can be found at lower methanol concentrations (xM = 0.4 and 0.5).
In general, the agreement between calculated and measured structure factors is satisfactory. The largest deviation can be seen in the XRD structure factors around Q = 3 Å-1, where the height and position of the 2nd peaks are different: this is most pronounced for the xM = 0.4 mixture. Only small discrepancies can be observed in the neutron weighted structure factors.
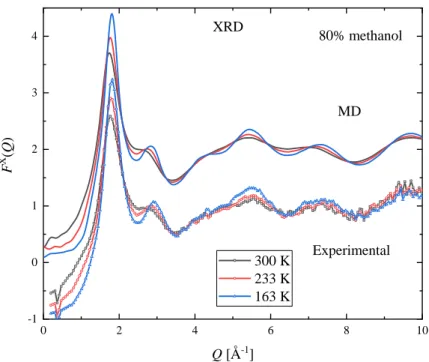
Simulations were carried out using the OPLS/AA model for methanol and both the TIP4P/2005 and SPC/E water models (thus only the water model is mentioned in the figure captions). All calculated curves are compared in Figures S2-S47 (in SM); here only the FN(Q) curves for xM = 0.2 are shown (Fig. 5). Differences between the calculated curves are obviously larger in water-rich mixtures. Results obtained by the two water models were also compared quantitatively by calculating the goodness of fit (R-factor) values: an overall better agreement between experimental and calculated curves was found when using the TIP4P/2005 water model. For this reason, only structural properties obtained from simulations using the TIP4P/2005 water model will be discussed in the following; results for the SPC/E model are shown in the Supplementary Material.
4.2 Partial radial distribution functions
As simulated total structure factors reproduce the measured data satisfactorily; the simulations are thus in some sense validated and the PRDFs may be considered as representative. Note that since the number
8 of atom types in the system is 6 (methanol: C, O, methyl H denoted as H, hydroxyl H denoted as HM; water: OW and HW), the number of partial radial distribution functions is 21. Thus it is impossible to separate the partials using only these two experimental datasets, without numerous further assumptions.
The temperature dependence of the PRDFs related to H-bonding is shown for xM = 0.7 in Figure 6, where the TIP4P/2005 water model has been used. Qualitatively the same behavior can be observed in the simulations with the SPC/E model, shown in the SM (Fig. S48). The temperature dependency for other concentrations (Figs. S49-S59), and concentration dependencies at selected temperatures (Figs.
S60-S62) are displayed as well. From these pictures the following observations can be made. The first peaks in the oxygen-oxygen and oxygen-hydrogen PRDFs (around 2.75 Å and 1.8 Å, respectively) correspond to H-bonding. They become sharper upon cooling: their heights increase while their widths decrease. Only slight shifts in terms of their positions occur: these distances are about 0.02-0.04 Å shorter at 163 K than at 300 K. The first minima following these peaks are more pronounced at lower temperatures. These observations are in agreement with what was found earlier at lower methanol content [8].
Focusing on the concentration dependency (see Figs. S60-S62) similar trends are found with increasing methanol concentrations for the first maxima at all examined temperatures : their heights increase and their positions shift slightly to shorter values. Although the position of some peaks (most notably, for OW-OW) depend on the water model, the general behavior observed with the SPC/E potential is the same. The number of H-bonded molecules that corresponds to the integral of the curves up to the first minima is discussed in the next section.
4.3 H-bond analysis
H-bonded pairs are identified through a geometric definition in which the O...H bond length and the O...O-H angle of the bonded molecules must be below a limiting value: 2.5 Å and 30 degrees, respectively (see Section 3).
The temperature dependence of the average number of H-bonds per molecule (NHb) is shown in Figure 7. For the calculation of NHb all molecules (methanol and water) were considered. The average number of H-bonds increases monotonously with decreasing temperature and tends toward the value:
2xM+4(1-xM) (this is best observable for methanol concentrations xM ≥ 0.5).
The number of H-bonds between different kinds of pairs of molecules is presented in Figure 8.
The number of H-bonded water-water pairs (NWW, Fig. 8a) increases with decreasing temperature in the mixtures with water concentration xW > 0.3 (xM < 0.7), while no significant change could be detected at lower water concentrations. Moreover, in the temperature range between 300 and 193 K, even a very
9 slight decrease is observable in some cases. The number of H-bonded water-methanol pairs (NWM, Fig.
8b) increases in each mixture with decreasing temperature; the increment is significant in mixtures with higher methanol contents and most pronounced around xM = 0.7. (Throughout this section, the term
‘pairs’ will refer to ‘hydrogen bonded pairs’.)
A similar trend can be observed around methanol molecules. The number of methanol-water pairs (NMW, Fig. 8d) is rising at high and low methanol concentrations as well whilst the number of methanol- methanol pairs (NMM, Fig. 8e) increases with decreasing temperatures only in mixtures with high methanol content (xM ≥ 0.7). The number of hydrogen bonds between methanol molecules decreases visibly with lowering temperatures in the concentration range between ca. 30 and 60 mol % (between xM = 0.3 and 0.7) alcohol content.
Based on the above findings, we conjecture that lowering the temperature forces enhanced mixing of the two species in certain concentration and, perhaps more importantly, temperature regions. It is important to point out that below 193 K the number of like-like (particularly of water-water) HB-s starts to rise again on further cooling. It may be speculated that this is connected with some precursor of water freezing out of the liquid mixtures in these regions. This may be an explanation for the fact that in some of the mixtures the number of HB-s between unlike molecules starts to decrease below ca. 193 K (cf.
Fig. 8 parts b) and d) ). Note, however, that statistical uncertainties, as well as simulated annealing related issues in MD simulations, would necessitate at least one order of magnitude longer simulation times for confirming these speculations.
According to the tendencies mentioned above, by and large, three concentration regions may be identified with respect to changes of hydrogen bonding on cooling. At low methanol concentrations, roughly xM ≤ 0.3, the numbers of water-water and water-methanol pairs increase similarly with decreasing temperature, while the number of methanol-methanol pairs is nearly constant. (Similar trends were observed in Ref. [8].) In the 0.3 < xM ≤ 0.7 region the number of water-water pairs is growing more slowly than that of water-methanol pairs, whereas the number of methanol-methanol pairs is constant (or slightly decreasing). In the methanol rich region, xM > 0.7, the number of water-water pairs is nearly constant, the number of water-methanol pairs is growing like in the other regions, and the number of methanol-methanol pairs is also increasing with decreasing temperature.
The number of H-bonded molecules, water and methanol together, around both water and methanol is larger at lower temperatures (NW = NWW + NWM and NM = NMW + NMM, Figs. 8c and 8f).
However, the behavior of the two components at the lowest investigated temperatures is different: the number of H-bonded molecules around methanol is saturating for mixtures where xM > 0.4, but the number of H-bonded molecules around water is increasing significantly even at the lowest investigated
10 temperatures in each mixture. This may be explained by remembering that water molecules are easily capable of forming four hydrogen bonds, whereas methanol molecules, due to simple steric considerations, rarely form more than two (even though methanol molecules have three H-bonding sites).
The concentration dependence of the number of H-bonded pairs at some selected temperatures are shown in Figure 9. The number of water molecules around both water and methanol (NWW and NMW, Figs. 9a and 9c) increases as the methanol concentration decreases. The shape of the curves is not linear:
they both differ from linear upward, i.e. the number of hydrogen bonds to water molecules is higher than it would be if proportional to the concentration. At 300 K the number of H-bonded methanol molecules around water and methanol (NWM and NMM, Figs. 9b and 9d) also show non-linear concentration dependence, but the deviation from linearity is negative for these curves. The same behavior was found at 300 K previously [14] by MD simulations using the SPC/E water model. As temperature decreases, the shape of the curves changes slightly as the number of H-bonds increases. The most significant change can be observed in terms of the number of methanol molecules around water (NWM, Fig. 9b): as temperature is decreasing the deviation from linearity becomes at first less negative, and at 193 K it even switches to positive. These observations suggest that (at least at high methanol concentrations) preference of the H-bonded mixed pairs is increasing with decreasing temperature. This is in line with the observation made above, i.e., that decreasing temperature enhances mixing in certain concentration ranges.
5. Conclusions
Synchrotron X-ray and neutron diffraction experiments have been conducted, as a function of decreasing temperature, over the entire composition range of methanol-water liquid mixtures. Molecular dynamics simulations have been used for the interpretation of experimental data. The all atom OPLS/AA force field model for methanol has been combined with both the SPC/E and TIP4P/2005 water potentials. Based on results obtained from these investigations, the following statements can be made:
(i) The TIP4P/2005 water model is found to be somewhat more successful in reproducing measured X-ray and neutron diffraction data in the reciprocal space.
(ii) Hydrogen bond related partial radial distribution functions, as calculated from simulation trajectories, show a sharpening of the first (and, wherever well distinguishable, second) maxima and minima. The positions of the extrema do not change significantly.
11 (iii) As a general trend, the average number of hydrogen bonds increases upon cooling. This is
strictly true for the ‘water-all’ and ‘methanol-all’ cases.
(iv) Interestingly, the number of hydrogen bonds between methanol molecules slightly decreases with lowering temperatures in the concentration range between ca. 30 and 60 mol % alcohol content. The same is valid for water-water hydrogen bonds above 70 mol % of methanol content, from room temperature down to 193 K.
(v) The effects of decreasing temperature is most significant for hydrogen bonding between unlike (water and methanol) molecules; this indicates that decreasing temperature enhances mixing between the constituents.
Acknowledgments
IP, LP and LT acknowledge financial support from the National Research, Development and Innovation Office (NKFIH), under grant no. KH 130425. IP, LP, SK and LT are grateful to the NKFIH of Hungary for making joint research possible under mobility grant No. TÉT_16-1-2016-0202. Synchrotron radiation experiments were performed on the BL04B2 of SPring-8, with the approval of the Japan Synchrotron Radiation Research Institute (JASRI) (Proposal Nos. 2017B1246 and 2018A1132). Neutron diffraction measurements were carried out on the 7C2 diffractometer at the Laboratoire Léon Brillouin (LLB), under Proposal id. 52/2017. LT is grateful for a János Bolyai Research Scholarship of the Hungarian Academy of Sciences. For the careful preparation of the mixtures Ms. A. Szuja (Centre for Energy Research, Hungary) is gratefully acknowledged.
References
[1] J. Cerar, A. Jamnik, I. Pethes, L. Temleitner, L. Pusztai, M. Tomšič, Structural, rheological and dynamic aspects of hydrogen-bonding molecular liquids: Aqueous solutions of hydrotropic tert-butyl alcohol, J. Colloid Interface Sci. 560 (2020) 730–742. doi:10.1016/j.jcis.2019.10.094.
[2] M. Cruz Sanchez, H. Dominguez, O. Pizio, Molecular dynamics simulations of the properties of water-methanol mixtures. Effects of force fields, Condens. Matter Phys. 22 (2019) 13602.
doi:10.5488/CMP.22.13602.
12 [3] A. Rahbari, R. Hens, S.H. Jamali, M. Ramdin, D. Dubbeldam, T.J.H. Vlugt, Effect of truncating electrostatic interactions on predicting thermodynamic properties of water–methanol systems, Mol.
Simul. 45 (2019) 336–350. doi:10.1080/08927022.2018.1547824.
[4] S. Pothoczki, L. Pusztai, I. Bakó, Molecular Dynamics Simulation Studies of the Temperature- Dependent Structure and Dynamics of Isopropanol–Water Liquid Mixtures at Low Alcohol Content, J.
Phys. Chem. B 123 (2019) 7599–7610. doi:10.1021/acs.jpcb.9b05631.
[5] S. Lenton, N.H. Rhys, J.J. Towey, A.K. Soper, L. Dougan, Temperature-Dependent Segregation in Alcohol–Water Binary Mixtures Is Driven by Water Clustering, J. Phys. Chem. B 122 (2018) 7884–
7894. doi:10.1021/acs.jpcb.8b03543.
[6] S. Pothoczki, L. Pusztai, I. Bakó, Variations of the Hydrogen Bonding and Hydrogen-Bonded Network in Ethanol–Water Mixtures on Cooling, J. Phys. Chem. B 122 (2018) 6790–6800.
doi:10.1021/acs.jpcb.8b02493.
[7] S. Pothoczki, L. Pusztai, I. Bakó, Temperature dependent dynamics in water-ethanol liquid mixtures, J. Mol. Liq. 271 (2018) 571–579. doi:10.1016/j.molliq.2018.09.027.
[8] I. Bakó, L. Pusztai, L. Temleitner, Decreasing temperature enhances the formation of sixfold hydrogen bonded rings in water-rich water-methanol mixtures, Sci. Rep. 7 (2017) 1073.
doi:10.1038/s41598-017-01095-7.
[9] R.K. Lam, J.W. Smith, R.J. Saykally, Communication: Hydrogen bonding interactions in water- alcohol mixtures from X-ray absorption spectroscopy, J. Chem. Phys. 144 (2016) 191103.
doi:10.1063/1.4951010.
[10] O. Gereben, L. Pusztai, Hydrogen bond connectivities in water–ethanol mixtures: On the influence of the H-bond definition, J. Mol. Liq. 220 (2016) 836–841. doi:10.1016/j.molliq.2016.05.035.
[11] J.-C. Soetens, P.A. Bopp, Water–Methanol Mixtures: Simulations of Mixing Properties over the Entire Range of Mole Fractions, J. Phys. Chem. B 119 (2015) 8593–8599. doi:10.1021/acs.jpcb.5b03344.
[12] O. Gereben, Ring structure analysis of ethanol–water mixtures, J. Mol. Liq. 211 (2015) 812–820.
doi:10.1016/j.molliq.2015.08.010.
[13] B.M. Rankin, D. Ben-Amotz, S.T. van der Post, H.J. Bakker, Contacts Between Alcohols in Water Are Random Rather than Hydrophobic, J. Phys. Chem. Lett. 6 (2015) 688–692. doi:10.1021/jz5027129.
[14] E. Galicia-Andrés, L. Pusztai, L. Temleitner, O. Pizio, Microscopic structure of methanol–water mixtures: Synchrotron X-ray diffraction experiments and molecular dynamics simulations over the entire composition range, J. Mol. Liq. 209 (2015) 586–595. doi:10.1016/j.molliq.2015.06.045.
13 [15] O. Gereben, L. Pusztai, Investigation of the Structure of Ethanol–Water Mixtures by Molecular Dynamics Simulation I: Analyses Concerning the Hydrogen-Bonded Pairs, J. Phys. Chem. B 119 (2015) 3070–3084. doi:10.1021/jp510490y.
[16] A.H. Narten, A. Habenschuss, Hydrogen bonding in liquid methanol and ethanol determined by x‐ray diffraction, J. Chem. Phys. 80 (1984) 3387–3391. doi:10.1063/1.447093.
[17] Y. Tanaka, N. Ohtomo, K. Arakawa, The Structure of Liquid Alcohols by Neutron and X-ray Diffraction. III. Liquid Structure of Methanol, Bull. Chem. Soc. Jpn. 58 (1985) 270–276.
doi:10.1246/bcsj.58.270.
[18] I.M. Svishchev, P.G. Kusalik, Structure in liquid methanol from spatial distribution functions, J.
Chem. Phys. 100 (1994) 5165–5171. doi:10.1063/1.467181.
[19] A. Vrhovšek, O. Gereben, A. Jamnik, L. Pusztai, Hydrogen Bonding and Molecular Aggregates in Liquid Methanol, Ethanol, and 1-Propanol, J. Phys. Chem. B 115 (2011) 13473–13488.
doi:10.1021/jp206665w.
[20] Y. Marcus, Preferential solvation in mixed solvents Part 8. Aqueous methanol from sub-ambient to elevated temperatures, Phys. Chem. Chem. Phys. 1 (1999) 2975–2983. doi:10.1039/a900459i.
[21] S. Okazaki, K. Nakanishi, H. Touhara, Computer experiments on aqueous solution. I. Monte Carlo calculation on the hydration of methanol in an infinitely dilute aqueous solution with a new water–
methanol pair potential, J. Chem. Phys. 78 (1983) 454–469. doi:10.1063/1.444525.
[22] W.L. Jorgensen, J.D. Madura, Quantum and statistical mechanical studies of liquids. 25. Solvation and conformation of methanol in water, J. Am. Chem. Soc. 105 (1983) 1407–1413.
doi:10.1021/ja00344a001.
[23] S. Okazaki, H. Touhara, K. Nakanishi, Computer experiments of aqueous solutions. V. Monte Carlo calculation on the hydrophobic interaction in 5 mol % methanol solution, J. Chem. Phys. 81 (1984) 890–894. doi:10.1063/1.447726.
[24] H. Tanaka, K.E. Gubbins, Structure and thermodynamic properties of water–methanol mixtures:
Role of the water–water interaction, J. Chem. Phys. 97 (1992) 2626–2634. doi:10.1063/1.463051.
[25] L.C.G. Freitas, Monte Carlo simulation of the binary liquid mixture water—methanol, J. Mol.
Struct. THEOCHEM. 282 (1993) 151–158. doi:10.1016/0166-1280(93)85045-Z.
[26] J. Hernández‐Cobos, I. Ortega‐Blake, Hydrophobic hydration in methanol aqueous solutions, J.
Chem. Phys. 103 (1995) 9261–9273. doi:10.1063/1.469986.
[27] J.A.B. da Silva, F.G.B. Moreira, V.M. Leite dos Santos, R.L. Longo, On the hydrogen bond networks in the water–methanol mixtures: topology, percolation and small-world, Phys. Chem. Chem.
Phys. 13 (2011) 6452. doi:10.1039/c0cp01802c.
14 [28] M. Ferrario, M. Haughney, I.R. McDonald, M.L. Klein, Molecular‐dynamics simulation of aqueous mixtures: Methanol, acetone, and ammonia, J. Chem. Phys. 93 (1990) 5156–5166.
doi:10.1063/1.458652.
[29] G. Pálinkás, I. Bakó, Excess Properties of Water-Methanol Mixtures as Studied by MD Simulations, Zeitschrift für Naturforsch. A. 46 (1991) 95–99. doi:10.1515/zna-1991-1-215.
[30] E.C. Meng, P.A. Kollman, Molecular Dynamics Studies of the Properties of Water around Simple Organic Solutes, J. Phys. Chem. 100 (1996) 11460–11470. doi:10.1021/jp9536209.
[31] A. Laaksonen, P.G. Kusalik, I.M. Svishchev, Three-Dimensional Structure in Water−Methanol Mixtures, J. Phys. Chem. A 101 (1997) 5910–5918. doi:10.1021/jp970673c.
[32] S.K. Allison, J.P. Fox, R. Hargreaves, S.P. Bates, Clustering and microimmiscibility in alcohol- water mixtures: Evidence from molecular-dynamics simulations, Phys. Rev. B 71 (2005) 024201.
doi:10.1103/PhysRevB.71.024201.
[33] Y. Zhong, G.L. Warren, S. Patel, Thermodynamic and structural properties of methanol–water solutions using nonadditive interaction models, J. Comput. Chem. 29 (2008) 1142–1152.
doi:10.1002/jcc.20877.
[34] I. Bakó, T. Megyes, S. Bálint, T. Grósz, V. Chihaia, Water–methanol mixtures: topology of hydrogen bonded network, Phys. Chem. Chem. Phys. 10 (2008) 5004. doi:10.1039/b808326f.
[35] T.A. Pascal, W.A. Goddard, Hydrophobic Segregation, Phase Transitions and the Anomalous Thermodynamics of Water/Methanol Mixtures, J. Phys. Chem. B 116 (2012) 13905–13912.
doi:10.1021/jp309693d.
[36] S.P. Benson, J. Pleiss, Incomplete mixing versus clathrate-like structures: A molecular view on hydrophobicity in methanol–water mixtures, J. Mol. Model. 19 (2013) 3427–3436. doi:10.1007/s00894- 013-1857-1.
[37] E. Galicia-Andrés, H. Dominguez, L. Pusztai, O. Pizio, On the composition dependence of thermodynamic, dynamic and dielectric properties of water-methanol model mixtures. Molecular dynamics simulation results, Condens. Matter Phys. 18 (2015) 43602. doi:10.5488/CMP.18.43602.
[38] E. Galicia-Andrés, H. Dominguez, L. Pusztai, O. Pizio, Composition dependence of thermodynamic, dynamic and dielectric properties of water–methanol model mixtures. Molecular dynamics simulation results with the OPLS-AA model for methanol, J. Mol. Liq. 212 (2015) 70–78.
doi:10.1016/j.molliq.2015.08.061.
[39] M. Požar, A. Kerasidou, B. Lovrinčević, L. Zoranić, M. Mijaković, T. Primorac, et al., The microscopic structure of cold aqueous methanol mixtures, J. Chem. Phys. 145 (2016) 144502.
doi:10.1063/1.4964487.
15 [40] A. Obeidat, H. Abu-Ghazleh, The validity of the potential model in predicting the structural, dynamical, thermodynamic properties of the unary and binary mixture of water-alcohol: Methanol-water case, AIP Adv. 8 (2018) 065203. doi:10.1063/1.5025575.
[41] S. Dixit, A.K. Soper, J.L. Finney, J. Crain, Water structure and solute association in dilute aqueous methanol, Europhys. Lett. 59 (2002) 377–383. doi:10.1209/epl/i2002-00205-7.
[42] L. Dougan, S.P. Bates, R. Hargreaves, J.P. Fox, J. Crain, J.L. Finney, et al., Methanol-water solutions: A bi-percolating liquid mixture, J. Chem. Phys. 121 (2004) 6456–6462.
doi:10.1063/1.1789951.
[43] L. Dougan, R. Hargreaves, S.P. Bates, J.L. Finney, V. Réat, A.K. Soper, et al., Segregation in aqueous methanol enhanced by cooling and compression, J. Chem. Phys. 122 (2005) 174514.
doi:10.1063/1.1888405.
[44] T.S. van Erp, E.J. Meijer, Hydration of methanol in water. A DFT-based molecular dynamics study, Chem. Phys. Lett. 333 (2001) 290–296. doi:10.1016/S0009-2614(00)01387-7.
[45] J.A. Morrone, K.E. Haslinger, M.E. Tuckerman, Ab Initio Molecular Dynamics Simulation of the Structure and Proton Transport Dynamics of Methanol−Water Solutions, J. Phys. Chem. B 110 (2006) 3712–3720. doi:10.1021/jp0554036.
[46] P.L. Silvestrelli, Are There Immobilized Water Molecules around Hydrophobic Groups? Aqueous Solvation of Methanol from First Principles, J. Phys. Chem. B 113 (2009) 10728–10731.
doi:10.1021/jp9044447.
[47] G. Matisz, A.-M. Kelterer, W.M.F. Fabian, S. Kunsági-Máté, Structural properties of methanol–
water binary mixtures within the quantum cluster equilibrium model, Phys. Chem. Chem. Phys. 17 (2015) 8467–8479. doi:10.1039/C4CP05836D.
[48] A.K. Soper, J.L. Finney, Hydration of methanol in aqueous solution, Phys. Rev. Lett. 71 (1993) 4346–4349. doi:10.1103/PhysRevLett.71.4346.
[49] S. Dixit, J. Crain, W.C.K. Poon, J.L. Finney, A.K. Soper, Molecular segregation observed in a concentrated alcohol–water solution, Nature. 416 (2002) 829–832. doi:10.1038/416829a.
[50] I. Bakó, G. Pálinkás, K. Heinzinger, X-Ray diffraction study of methanol-water mixtures, Zeitschrift für Naturforsch. A. 49a (1994) 967–972.
[51] T. Takamuku, T. Yamaguchi, M. Asato, M. Matsumoto, N. Nishi, Structure of Clusters in Methanol-Water Binary Solutions Studied by Mass Spectrometry and X-ray Diffraction, Zeitschrift für Naturforsch. A. 55a (2000) 513--525. doi:10.1515/zna-2000-0507.
16 [52] T. Takamuku, K. Saisho, S. Nozawa, T. Yamaguchi, X-ray diffraction studies on methanol–water, ethanol–water, and 2-propanol–water mixtures at low temperatures, J. Mol. Liq. 119 (2005) 133–146.
doi:10.1016/j.molliq.2004.10.020.
[53] A. Wakisaka, H. Abdoul-Carime, Y. Yamamoto, Y. Kiyozumi, Non-ideality of binary mixtures Water-methanol and water-acetonitrile from the viewpoint of clustering structure, J. Chem. Soc. Faraday Trans. 94 (1998) 369–374. doi:10.1039/a705777f.
[54] T. Sato, A. Chiba, R. Nozaki, Hydrophobic hydration and molecular association in methanol–
water mixtures studied by microwave dielectric analysis, J. Chem. Phys. 112 (2000) 2924–2932.
doi:10.1063/1.480865.
[55] S. Dixit, W.C.K. Poon, J. Crain, S. Dixit, W.C.K. Poon, Hydration of methanol in aqueous solutions: a Raman spectroscopic study, J. Phys. Condens. Matter. 12 (2000) L323–L328.
doi:10.1088/0953-8984/12/21/103.
[56] Y. Yu, W. Fan, Y. Wang, X. Zhou, J. Sun, S. Liu, C–H···O Interaction in Methanol–Water Solution Revealed from Raman Spectroscopy and Theoretical Calculations, J. Phys. Chem. B 121 (2017) 8179–
8187. doi:10.1021/acs.jpcb.7b06036.
[57] S. Stehle, A.S. Braeuer, Hydrogen Bond Networks in Binary Mixtures of Water and Organic Solvents, J. Phys. Chem. B 123 (2019) 4425–4433. doi:10.1021/acs.jpcb.9b02829.
[58] J.-H. Guo, Y. Luo, A. Augustsson, S. Kashtanov, J.-E. Rubensson, D.K. Shuh, et al., Molecular Structure of Alcohol-Water Mixtures, Phys. Rev. Lett. 91 (2003) 157401.
doi:10.1103/PhysRevLett.91.157401.
[59] M. Nagasaka, K. Mochizuki, V. Leloup, N. Kosugi, Local Structures of Methanol–Water Binary Solutions Studied by Soft X-ray Absorption Spectroscopy, J. Phys. Chem. B 118 (2014) 4388–4396.
doi:10.1021/jp4091602.
[60] C.E. Bertrand, W.-S. Chiang, M. Tyagi, S.-H. Chen, Low-temperature water dynamics in an aqueous methanol solution, J. Chem. Phys. 139 (2013) 014505. doi:10.1063/1.4812286.
[61] C. Corsaro, J. Spooren, C. Branca, N. Leone, M. Broccio, C. Kim, et al., Clustering Dynamics in Water/Methanol Mixtures: A Nuclear Magnetic Resonance Study at 205 K < T < 295 K, J. Phys. Chem.
B 112 (2008) 10449–10454. doi:10.1021/jp803456p.
[62] C. Corsaro, R. Maisano, D. Mallamace, G. Dugo, 1 H NMR study of water/methanol solutions as a function of temperature and concentration, Phys. A Stat. Mech. Its Appl. 392 (2013) 596–601.
doi:10.1016/j.physa.2012.11.008.
[63] R. Li, C. D’Agostino, J. McGregor, M.D. Mantle, J.A. Zeitler, L.F. Gladden, Mesoscopic Structuring and Dynamics of Alcohol/Water Solutions Probed by Terahertz Time-Domain Spectroscopy
17 and Pulsed Field Gradient Nuclear Magnetic Resonance, J. Phys. Chem. B 118 (2014) 10156–10166.
doi:10.1021/jp502799x.
[64] F. Mallamace, C. Corsaro, D. Mallamace, C. Vasi, S. Vasi, H.E. Stanley, Dynamical properties of water-methanol solutions, J. Chem. Phys. 144 (2016) 064506. doi:10.1063/1.4941414.
[65] C. Corsaro, F. Mallamace, S. Vasi, S.-H. Chen, H.E. Stanley, D. Mallamace, Contrasting microscopic interactions determine the properties of water/methanol solutions, Front. Phys. 13 (2018) 138201. doi:10.1007/s11467-017-0685-7.
[66] H.J.C. Berendsen, J.R. Grigera, T.P. Straatsma, The missing term in effective pair potentials, J.
Phys. Chem. 91 (1987) 6269–6271. doi:10.1021/j100308a038.
[67] J.L.F. Abascal, C. Vega, A general purpose model for the condensed phases of water: TIP4P/2005, J. Chem. Phys. 123 (2005) 234505. doi:10.1063/1.2121687.
[68] W.L. Jorgensen, D.S. Maxwell, J. Tirado-Rives, Development and Testing of the OPLS All-Atom Force Field on Conformational Energetics and Properties of Organic Liquids, J. Am. Chem. Soc. 118 (1996) 11225–11236. doi:10.1021/ja9621760.
[69] J.F.G. Hicks, J.G. Hooley, C.C. Stephenson, The Heat Capacity of Carbon Tetrachloride from 15 to 300°K. The Heats of Transition and of Fusion. The Entropy from Thermal Measurements Compared with the Entropy from Molecular Data, J. Am. Chem. Soc. 66 (1944) 1064–1067.
doi:10.1021/ja01235a002.
[70] G.J. Cuello, J. Darpentigny, L. Hennet, L. Cormier, J. Dupont, B. Homatter, et al., 7C2, the new neutron diffractometer for liquids and disordered materials at LLB, J. Phys. Conf. Ser. 746 (2016) 012020.
doi:10.1088/1742-6596/746/1/012020.
[71] G.A. Miller, D.K. Carpenter, Solid-Liquid Phase Diagram of the System Methanol-Water., J.
Chem. Eng. Data. 9 (1964) 371–373. doi:10.1021/je60022a017.
[72] D.R. Lide, ed., CRC Handbook of Chemistry and Physics, Internet Version 2005, CRC Press, Boca Raton, FL, 2005.
[73] M.J. Abraham, T. Murtola, R. Schulz, S. Páll, J.C. Smith, B. Hess, et al., GROMACS: High performance molecular simulations through multi-level parallelism from laptops to supercomputers, SoftwareX 1–2 (2015) 19–25. doi:10.1016/j.softx.2015.06.001.
[74] R. Kumar, J.R. Schmidt, J.L. Skinner, Hydrogen bonding definitions and dynamics in liquid water, J. Chem. Phys. 126 (2007) 204107. doi:10.1063/1.2742385.
[75] V. Chihaia, S. Adams, W.F. Kuhs, Molecular dynamics simulations of properties of a (001) methane clathrate hydrate surface, Chem. Phys. 317 (2005) 208–225.
doi:10.1016/j.chemphys.2005.05.024.
18
19 Tables
Table 1. Investigated methanol-water mixtures: nominal and exact compositions, temperatures examined in X-ray and neutron diffraction measurements.
Nominal methanol content, xM
Measured methanol content of samples investigated by XRD/ND [mol%]
Temperature points
examined by XRD [K] Temperature points examined by ND [K]
0.1 10.02/10 300, 263 300, 263
0.2 20.037/20.01 -- 300, 268, 253, 243
0.3 30.013/30 -- 300, 268, 253, 243, 233, 223
0.4 39.986/39.96 300, 233, 213 300, 268, 243, 233, 223, 213
0.5 50.068/50.06 300, 233 300, 268, 243, 233, 213, 203, 193
0.5442 54.42 300, 233 --
0.6 60.051/60.12 300, 233, 178 300, 268, 243, 213, 193, 178
0.7 70.011/70.04 300, 233, 178, 163 300, 268, 233, 203, 178, 163
0.7337 73.37 300, 233, 178 --
0.8 80.102/79.95 300, 233, 178, 163 300, 268, 233, 203, 193, 178, 163
0.9 90.017 300, 233, 178, 163 --
1.0 100 300, 233, 178, 163 300, 268, 233, 203, 193, 178, 163
20 Figures
Figure 1 Phase diagram for methanol-water mixtures at p = 1 bar [71,72]. The thick curve is the solid- liquid coexistence curve. Temperatures examined by X-ray diffraction (solid red circles) and neutron diffraction (open blue circles) at different methanol concentrations of methanol-water mixtures are also shown.
0.0 0.1 0.2 0.3 0.4 0.5 0.6 0.7 0.8 0.9 1.0
160 180 200 220 240 260 280 300
T [K]
xM ND meas.
XRD meas.
21 Figure 2 Temperature dependence of densities of methanol-water mixtures at 1 bar obtained by MD simulations using the TIP4P/2005 water model.
160 180 200 220 240 260 280 300
750 800 850 900 950 1000
r [kg/m3 ]
T [K]
0.1 0.2 0.3
0.4 0.5 0.5442
0.6 0.7 0.7337
0.8 0.9 1 TIP4P/2005
22 Figure 3 Temperature dependence of measured (symbols) and simulated (lines) XRD structure factors for the methanol-water mixture with 70 mol % methanol. (a) Comparison of (a) trends observed upon cooling, (b) measured and simulated curves at three selected temperatures: 300 K (black lines and symbols), 233 K (red) and 163 K (blue). The simulated curves were obtained by using the TIP4P/2005 water model. (The curves are shifted by one unit for clarity.)
-1 0 1 2 3 4
0 2 4 6 8 10
-1 0 1 2 3 4 5
F
X( Q )
300 K 233 K 163 K
MD
Experimental 70% methanol
XRD
(a)
163 K (b)
F
X( Q )
Q [Å
-1]
300 K
233 K
23 Figure 4 Temperature dependence of measured (symbols) and simulated (lines) ND structure factors for the methanol-water mixture with 70 mol % methanol. Comparison of (a) trends observed upon cooling, (b) measured and simulated curves at three selected temperatures: 300 K (black lines and symbols), 233 K (red) and 163 K (blue). Simulated curves were obtained using the TIP4P/2005 water model. (The curves are shifted for clarity.)
0 1 2 3
2 4 6 8 10
0 1 2 3 4
F
N( Q )
300 K 233 K 163 K
MD
Experimental 70% methanol
ND
(a)
163 K (b)
F
N( Q )
Q [Å
-1]
300 K
233 K
24 Figure 5 Comparison of ND structure factors obtained from experiments (symbols) and simulations using TIP4P/2005 (red lines) and SPC/E (blue lines) water models for the methanol-water mixture with 20 mol% methanol, at three selected temperatures (300 K, 268 K and 243 K). (The curves are shifted for clarity.)
2 4 6 8 10
0 1 2 3 4
243 K
FN (Q)
Q [Å-1]
Experimental MD TIP4P/2005 MD SPC/E
300 K 268 K 20% methanol ND
25 Figure 6 Temperature dependence of simulated partial radial distribution functions of the methanol-water mixture with 70 mol % methanol. The H-bonding related partials are shown: (a) methanol O (denoted as O) – hydroxyl H of methanol (denoted as HM), (b) methanol O – water H (denoted as HW), (c) water O (denoted as OW) – hydroxyl H of methanol, (d) water O – water H, (e) methanol O – methanol O, (f) water O – water O, (g) methanol O – water O. The curves were obtained using the TIP4P/2005 water model.
0 1 2 3 4
0 2 4 6 8 10
2 4 6 8 10
0 2 4 6 0
1 2 3 4
0 1 2 3 4 5
0 2 4 6
2 4 6 8 10
0 2 4 6
O-O (e)
OW-OW (f)
(g)
O-OW
r [Å]
O-HM (a)
gij(r)
O-HW (b)
gij(r)
OW-HM (c)
gij(r)
70% methanol TIP4P/2005 water
(d)
300 K 233 K 163 K OW-HW
gij(r)
r [Å]
26 Figure 7 Average number of hydrogen bonds per molecule (either water or methanol) in methanol-water mixtures as a function of temperature at different concentrations, obtained from MD simulations using the TIP4P/2005 water model.
160 180 200 220 240 260 280 300 320
1.8 2.0 2.2 2.4 2.6 2.8 3.0 3.2 3.4 3.6
NHb
T [K]
10%
20%
30%
40%
50%
54.42%
60%
70%
73.37%
80%
90%
100%
27 Figure 8 Temperature dependence of the number of hydrogen bonds at different concentrations, as obtained from MD simulations using the TIP4P/2005 water model: (a) average number of H-bonded water molecules around water, (b) average number of H-bonded methanol molecules around water, (c) average number of H-bonded (water and methanol) molecules around water, (d) average number of H- bonded water molecules around methanol, (e) average number of H-bonded methanol molecules around methanol, (f) average number of H-bonded (water and methanol) molecules around methanol.
0.0 0.5 1.0 1.5 2.0 2.5 3.0 3.5
Nij
water-water
(a) (b)
water-methanol
3.2 3.4 3.6 3.8
(c) water
150 200 250 300
0.0 0.5 1.0 1.5 2.0
(d)
methanol-water
Nij
T [K]
150 200 250 300
(e)
methanol-methanol
T [K]
150 200 250 300
1.8 2.0 2.2
(f)
methanol 10%
20%
30%
40%
50%
54.42%
60%
70%
73.37%
80%
90%
100%
T [K]
28 Figure 9 Concentration dependence of the number of hydrogen bonds at different temperatures, as obtained from MD simulations using the TIP4P/2005 water model: (a) average number of H-bonded water molecules around water, (b) average number of H-bonded methanol molecules around water, (c) average number of H-bonded water molecules around methanol, (d) average number of H-bonded methanol molecules around methanol. The dashed linear lines are only guides to the eye.
0 1 2 3 4
NWW
water-water
(a)
0 1 2 3 4
(b) NWM
water-methanol
0.0 0.2 0.4 0.6 0.8 1.0
0 1 2
(c) NMW
xM
methanol-water
0.0 0.2 0.4 0.6 0.8 1.0
0 1 2
(d) 300 K
268 K 233 K 193 K
NMM
xM
methanol-methanol
1
Supplementary Material
Temperature-dependent structure of methanol-water mixtures on cooling: X-ray and neutron diffraction and molecular dynamics
simulations
Ildikó Pethes1,a, László Pusztaia,b, Koji Oharac, Shinji Koharad, Jacques Darpentignye, László Temleitnera
aWigner Research Centre for Physics, Konkoly Thege út 29-33., H-1121 Budapest, Hungary
bInternational Research Organization for Advanced Science and Technology (IROAST), Kumamoto University, 2-39-1 Kurokami, Chuo-ku, Kumamoto 860-8555, Japan
cDiffraction and Scattering Division, Japan Synchrotron Radiation Research Institute (JASRI/SPring‐8), 1‐1‐1 Kouto, Sayo-cho, Sayo-gun, Hyogo 679‐5198, Japan
dResearch Center for Advanced Measurement and Characterization, National Institute for Materials Science (NIMS), 1–1–1 Kouto, Sayo-cho, Sayo-gun, Hyogo 679–5148, Japan
eLaboratoire Léon Brillouin, CEA-Saclay 91191 Gif sur Yvette Cedex France
1 Corresponding author: e-mail: pethes.ildiko@wigner.hu
2 Molecular dynamics simulations
Classical molecular dynamics (MD) simulations were performed with the GROMACS software package (version 2018.2) [1]. Simulations were conducted in cubic simulation boxes with periodic boundary conditions. The total number of methanol and water molecules in the simulation boxes was 2000. The initial box sizes were determined from the room temperature densities [2]. At first, calculations were run at constant pressure and temperature (NPT ensemble), at each experimentally examined temperature point (by decreasing from 300 K). Densities applied later were calculated from these NPT simulation runs. In the second set of the simulations the temperature and volume were kept at constant (NVT ensemble), using the box sizes calculated by the densities obtained from the NPT simulations.
The all atom OPLS-AA [3] force field was applied for methanol while for water two models, the SPC/E [4] and the TIP4P/2005 [5], were tested. Non-bonded interactions were described by the 12-6 Lennard-Jones interaction and the Coulomb potential (see Eq. 1):
𝑉𝑖𝑗NB(𝑟𝑖𝑗) = 1
4πε0 𝑞𝑖𝑞𝑗
𝑟𝑖𝑗 + 4𝜀𝑖𝑗[(𝜎𝑖𝑗
𝑟𝑖𝑗)
12
− (𝜎𝑖𝑗
𝑟𝑖𝑗)
6], (1)
where rij is the distance between particles i and j, qi and qj are the partial charges on these particles, ε0 is the vacuum permittivity, and εij and σij represent the energy and distance parameters of the LJ potential. The LJ parameters (εii and σii) and the partial charges applied (qi) to the different atoms are collected in Table S1. The εij and σij parameters between unlike atoms are calculated as the geometric average of the homoatomic parameters (geometric combination rule, in accordance with the OPLS/AA force field).
Intramolecular non-bonded interactions between first and second neighbor atoms were neglected, whereas between third neighbors (atoms separated by 3 bonds, HC – HO bonds) they were reduced by a factor of 2. The intramolecular (or bonded) forces considered here are the bond- stretching (2-body), angle bending (3-body) and the dihedral angle torsion (4-body) interactions.
Bond lengths in methanol molecules were fixed using the LINCS [6] algorithm, while bond angles and torsional angles were flexible. The rigid water geometry was handled by the SETTLE algorithm [7]. Bond lengths, equilibrium angles and force constants are given in Table S2.
The smoothed particle-mesh Ewald (SPME) method [8,9] was used for treating the Coulomb interactions, using a 20 Å cutoff (15 Å for methanol concentrations 0.1 and 0.2 molar
3 fraction, due to the smaller box sizes) in real space. Non-bonded LJ interactions were cut-off at 20 Å (15 Å for methanol concentration of 10 and 20 mol%), with added long-range corrections to energy and pressure [10].
Initial configurations for the NPT simulations at T = 300 K were obtained by placing the molecules into the simulation box randomly, following an energy minimization using the steepest- descent method (random configuration method). At lower temperatures the final configuration of the previous temperature point was used as initial configuration. The equations of motion were integrated via the leapfrog algorithm, the time step was 2 fs. At each temperature, at first a short (0.2 ns) NVT run was performed using the Berendsen thermostat [11], with τT = 0.1, for relaxing the system to the target temperature. After that, the NPT ensemble was used. The temperature was kept constant by the Nose-Hoover thermostat [12,13], with τT = 2.0, while the pressure was kept at p = 105 Pa, by the Parrinello-Rahman barostat [14,15], using a coupling constant of τp = 2.0. After a 2 ns equilibration period, a 2 ns production run was completed, from which the densities were calculated.
Initial configurations for the NVT simulations were either obtained by the random configuration method or were adopted from the corresponding NPT simulations. (The latter method was used for low temperatures and high methanol content mixtures, in order to avoid artifacts resulting from close packing and low mobility of molecules). The leap-frog algorithm was used again, with the same time step as for the NPT runs (2 fs). Two equilibration runs were performed before the production run: during the first, short one (0.2 ns), the Berendsen thermostat was used;
after that, and also for the production run, the Nose-Hoover thermostat was activated, with the same coupling constants as before.
Trajectories were saved in every 200 ps, for the duration of 20 ns: in this way, 101 configurations were used for further analyzes. Partial radial distribution functions (PRDF, gij(r)) were calculated from the collected configurations, by the ‘gmx_rdf’ programme of the GROMACS software. The model structure factor can be obtained from the PRDFs, according to the Faber- Ziman formalism [16], by the following equations:
𝑆𝑖𝑗(𝑄) − 1 =4π𝜌𝑄0∫ 𝑟(𝑔0∞ 𝑖𝑗(𝑟) − 1)sin(𝑄𝑟)d𝑟, (2) where Q is the amplitude of the scattering vector, and ρ0 is the average number density.
4 The XRD (FX(Q)) and ND (FN(Q)) total structure factors can be composed from the partial structure factors Sij(Q) as:
𝐹X(𝑄) = ∑𝑖≤𝑗𝑤𝑖𝑗X(𝑄)𝑆𝑖𝑗(𝑄) (3)
and
𝐹N(𝑄) = ∑𝑖≤𝑗𝑤𝑖𝑗N𝑆𝑖𝑗(𝑄), (4)
where wijX,N denotes the X-ray and neutron scattering weights. For X-rays it is given by equation (5):
𝑤𝑖𝑗X(𝑄) = (2 − 𝛿𝑖𝑗)∑ 𝑐𝑐𝑖𝑐𝑗𝑓𝑖(𝑄)𝑓𝑗(𝑄)
𝑖𝑐𝑗𝑓𝑖(𝑄)𝑓𝑗(𝑄)
𝑖𝑗 . (5)
Here δij is the Kronecker delta, ci denotes atomic concentrations, fi(Q) is the atomic form factor.
The neutron weight factors are:
𝑤𝑖𝑗𝑁= (2 − 𝛿𝑖𝑗)∑ 𝑐𝑐𝑖𝑐𝑗𝑏𝑖𝑏𝑗
𝑖𝑐𝑗𝑏𝑖𝑏𝑗
𝑖𝑗 , (6)
where bi is the coherent neutron scattering length.
The total structure factors obtained from simulations were compared with the measured curves by calculating the goodness-of-fit (R-factor) values:
𝑅X=√∑ (𝐹mod
X (𝑄𝑖)−𝐹expX (𝑄𝑖))2 𝑖
√∑ (𝐹𝑖 expX (𝑄𝑖))2
(7)
𝑅N=√∑ (𝐹mod
N (𝑄𝑖)−𝐹expN (𝑄𝑖))2 𝑖
√∑ (𝐹𝑖 expN (𝑄𝑖))2
(8)
5 where Qi denote the experimental points, ‘mod’ indicates the simulated and ‘exp’ the experimental curves.
Tables
Table S1. Non-bonded force field parameters. In the methanol molecule the H atoms of the hydroxyl and methyl groups are denoted as HM and H, respectively. In the TIP4P/2005 water model there is a fourth (virtual) site (M). It is situated along the bisector of the HW-OW-HW angle and coplanar with the oxygen and hydrogens. The negative charge is placed on site M.
atom q [e] σii [nm] εii [kJ mol-1] OPLS/AA methanol [3]
C 0.145 0.35 0.276144 O -0.683 0.312 0.71128 H 0.04 0.25 0.12552
HM 0.418 0 0
SPC/E water [4]
OW -0.8476 0.3166 0.6502
HW 0.4238 0 0
TIP4P/2005 water [5]
OW 0 0.3159 0.7749
HW 0.5564 0 0
M -1.1128 0 0
![Figure 1 Phase diagram for methanol-water mixtures at p = 1 bar [71,72]. The thick curve is the solid- solid-liquid coexistence curve](https://thumb-eu.123doks.com/thumbv2/9dokorg/1060267.69790/20.918.140.706.160.625/figure-phase-diagram-methanol-water-mixtures-liquid-coexistence.webp)