Article type: Full paper
On the Structure Factors of Aqueous Mixtures of 1-Propanol and 2-Propanol: X-ray Diffraction Experiments and Molecular Dynamics Simulations
José G. Méndez-Bermúdez*, Hector Dominguez, László Temleitner, László Pusztai
Dr. J. G. Méndez-Bermúdez
Centro Universitario de los Valles, Universidad de Guadalajara, Carretera Guadalajara-Ameca Km 45.5, 46600, Jalisco, México.
E-mail: jose.mendez@valles.udg.mx
Dr. H. Dominguez
Instituto de Investigaciones en Materiales, Universidad Nacional Autónoma de Mexico, Circuito Exterior, 04510, Ciudad de México, México.
Dr. L. Temleitner
Wigner Research Centre for Physics, Hungarian Academy of Sciences, H-1121 Budapest, Konkoly Thege út 29-33., Hungary.
Dr. L. Pusztai
Wigner Research Centre for Physics, Hungarian Academy of Sciences, H-1121 Budapest, Konkoly Thege út 29-33., Hungary; International Research Organization for Advanced Science and Technology (IROAST), Kumamoto University, 2-39-1, Kurokami, Chuo-ku, Kumamoto 860-855, Japan.
Keywords: liquid structure; X-ray diffraction; molecular dynamics; forcefields parametrization
Abstract
The structure factor of pure 1-propanol, 2-propanol and mixtures of 1-propanol/water and 2- propanol/water, as a function of composition, has been determined experimentally and by molecular dynamics simulations. The primary aim was to find interatomic potentials that reproduce measured structural data at the highest possible level. For this reason, various alcohol potential models have been employed, including united atom (UA) and all atom (AA) types, in combination with a TIP4P-based model for water. In order to improve agreement with experimental values of the dielectric constant and mass density, a new UA force field for the alcohols has also been constructed. In terms of structural properties the AA model reproduces experimental results better than any of the UA models for all compositions.
1. Introduction
1-propanol (n-propanol, or simply ‘propanol’, CH3-CH2-CH2-OH) and 2-propanol (isopropanol, CH3-CH(-OH)-CH3) are among the few mono-alcohols that are fully miscible with water under ambient conditions. They also have their industrial uses, at the million tons/
year extent, mostly as solvents.
Concerning the microscopic structure of the pure substances, a host of diffraction studies have been conducted over the past decades. Pure 1-propanol has been considered by X-ray[1,2,3,4] and neutron diffraction[5,6,7,8], whereas neutron diffraction has been the preferred method of investigation for pure 2-propanol[8,9,10]. For aqueous mixtures of 1- and 2-propanol, only a few X-ray[11,12,13] and neutron[14] diffraction measurements have been performed; as an interesting example, the work of Tong et al.[15] is worth mentioning, which applied infrared spectroscopy for observing conformational changes in mixtures of 1-propanol and water.
According to the best of our knowledge, only very few computer investigations compared simulation results to diffraction data in the reciprocal space: such comparisons are available for liquid pure 1-propanol only[3,4,16]. On the other hand, in a recent study[17], molecular dynamics computer simulation results have been contrasted to experimental data on the temperature dependent dielectric constant of 1-propanol/water mixtures. In most cases, agreement between simulation and experiment was excellent for one specific type of potential (see Ref.[17] for details). It would be important to learn whether the same (or similar), interatomic potentials were able to describe a most basic property, the liquid structure, as well. The primary focus of the present work then is to establish if an interatomic potential model that reproduces the measured dielectric constant of 1-propanol/water mixtures can, at the same time, provide structural models that are consistent with the experimental X-ray structure factors.
In addition, there still is a controversy concerning even the neutron diffraction total structure factor of 2-propanol, as it is exemplified by Ref.[8] (Figure 5 of that publication), particularly at the lower scattering variable, Q, range (below ca. 3 Å-1). This is also why a comparative computer simulation study has been missing: we are now providing simulated X- ray and neutron-weighted total structure factors, along with simulated densities of pure 1- and 2-propanol and their mixtures with water.
2. Experimental
Synchrotron X-ray diffraction measurements have been carried out at the BL04B2[18] high energy X-ray diffraction beamline of the Japan Synchrotron Radiation Research Institute (SPring-8, Hyogo, Japan). The incoming wavelength was 0.2023 Å (corresponding to a photon energy of 61.3 keV). Diffraction patterns from the samples were recorded in the transmission mode by a single HPGe detector between scattering variable, Q, values of about 0.2 and 16 Å-1. Samples were put in 2 mm diameter, thin-walled quartz capillaries (GLAS
Müller, Germany). The capillaries were mounted in the automatic sample changer. Diffraction patterns were recorded in three overlapping frames that differed by the width of incoming beam.
Measured raw intensities were normalized by the incoming beam monitor counts, then corrected for absorption, polarization and contributions from the empty sample holder.
Finally, diffraction patterns over the entire Q-range were obtained by normalizing and merging each frame in electron units, then removing inelastic (Compton) scattering contributions following a standard procedure.[19]
Since each sample was considered also for neutron diffraction experiments, heavy water, D2O, and heavy alcohols, C3D8O, have been used for preparing the mixtures. Due to the need for costly deuterated compounds, we have not been able to cover the entire concentration range for both 1- and 2-propanols. In the end, the two pure alcohols, as well as mixtures with 10 and 50 mol % of (fully deuterated) 1-propanol, and 20 and 80 mol % of (fully deuterated) 2-propanol could be prepared. We hope that it is correct and fair to note that both the Q-range and the statistical accuracy of the new data surpass those of the previously determined X-ray total structure factors – this is a justification why new measurements were timely. (Neutron diffraction measurements and data analyses are still planned for the future.)
3. Molecular dynamics simulations
Molecular dynamics computer simulations have been performed by the GROMACS[20]
software (version 4.5). Water/alcohol mixtures (1-propanol/water and 2-propanol/water) were constructed at different compositions using two alcohol potential models, combined with the TIP4P/ε water potential[21]; this water model was originally optimized for providing the correct dielectric constant of pure water. The first alcohol model considered all atoms (AA), including each hydrogen, explicitly. In the other potential model, CHn (n: 1, 2, 3) groups were
taken as single sites: this is the philosophy of the united atom (UA) approach. For 1-propanol we took the UA force field parameters already reported in our previous work[17].
Simulations containing 2-propanol were carried out using parameters reported in the literature for the UA[22] and AA[23] types. In addition, UA parameters from the literature have been re-parametrized, similarly to the 1-propanol case[17]. That is, the new 2-propanol UA parameters were adjusted to obtain the correct experimental dielectric constant of pure 2- propanol. The new Lennard-Jones (LJ) parameters were calculated by conducting several simulations, trying several LJ parameter pairs, to fit the experimental surface tension and density at temperature 298 K and pressure 1 bar. Details of the re-parametrization procedure are given in our previous work[17] and in reference[24]. The original and re-parametrized (marked in short as ‘UA_new’) potential parameters are provided in Table 1.
In Table 2, selected properties of pure 2-propanol for the original and new UA potentials are compared with the corresponding experimental data. The static dielectric constant and the density values are dramatically improved after the application of the re- parametrized UA model. On the other hand, the surface tension slightly departs from the experimental value: this is an indication already that no single interaction potential model is able to re-produce every property of the liquids considered here at the highest level.
All MD simulations were conducted in the NPT ensemble, using the Berendsen barostat and Berendsen thermostat[25], to keep pressure and temperature constant during the entire calculation. Relaxation time constants were fixed at τT = 0.1 ps and τP = 2.0 ps for the temperature and pressure, respectively. Periodic boundary conditions were imposed in all directions. The time-step was 2 fs. Lennard-Jones (LJ) interactions were neglected beyond a cut-off radius of 1.5 nm. Pure (100 %) alcohol models contained 1500 alcohol molecules, while models with 80, 50, 20 and 10 % alcohol contained 1024 alcohol and 280 water, 1000 alcohol and 1000 water, 325 alcohol and 1300 water, and 200 alcohol and 1800 water molecules, respectively. The static dielectric constant was calculated over 200 ns of
production runs, whereas other properties, such as densities and diffusion coefficients, were analyzed for the last 5 ns of 50 ns simulations.
4. Results and Discussions
From the point of view of the present work, the most important simulated quantity to be compared with its experimental counterpart is the total structure factor, S(Q). For a most direct assessment of the interaction potential models considered, the comparison is made in the reciprocal (or ‘Q-’) space.
In order to obtain the X-ray weighted total structure factor, SX(Q), one needs to combine the Fourier transforms, ^gij(Q),of all the partial radial distribution functions, gij(r), according to their contributions to the total. This way we have
SX(Q)=
∑
i=1 nci2fi(Q)fi(Q) ^gii(Q)+
∑
i ≠ j n
cicjfi(Q)fj(Q) ^gij(Q)
( ∑i=1 n
fi(Q)
)
2where n is the number species, ci are molar fractions of specific sites, and the fi(Q) X-ray scattering form factors can be obtained as
fi(Q)=
∑
i=1 5
aie−biQ2+c
where the ai, bi, c parameters are taken from ref.[29] for each atom type.
The neutron weighted total structure factor, SN(Q), is given by the following expression:
SX(Q)=
∑
i=1 nci2bibi^gii(Q)+
∑
i ≠ j n
cicjbibj^gij(Q)
( ∑i=1 n
cibi
)
2where bi are the coherent neutron scattering lengths for each atom type (i.e., AA site)[30]. (Scattering amplitudes for the UA sites have been approximated by simply summing the corresponding AA scattering lengths.)
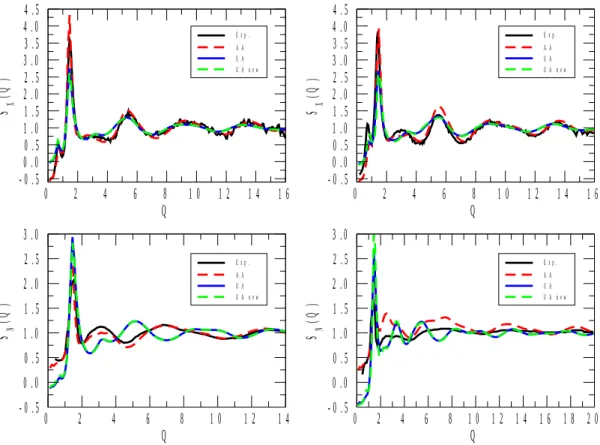
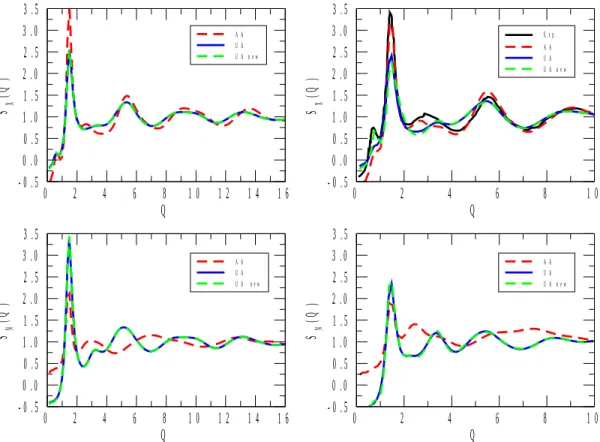
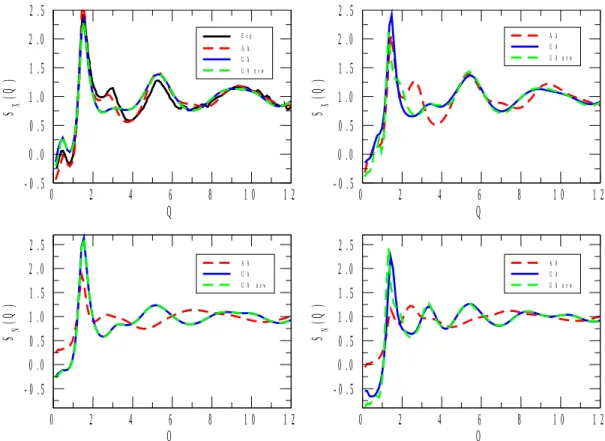
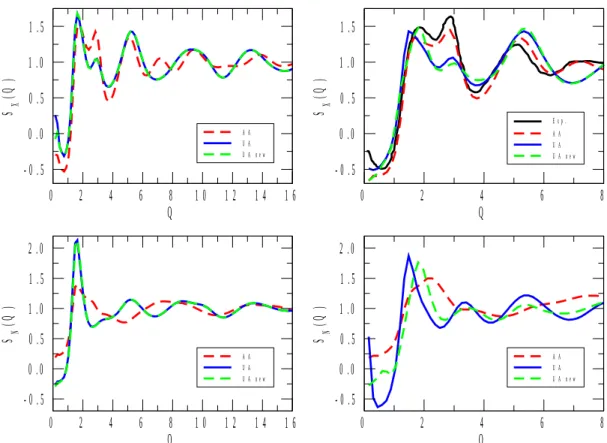
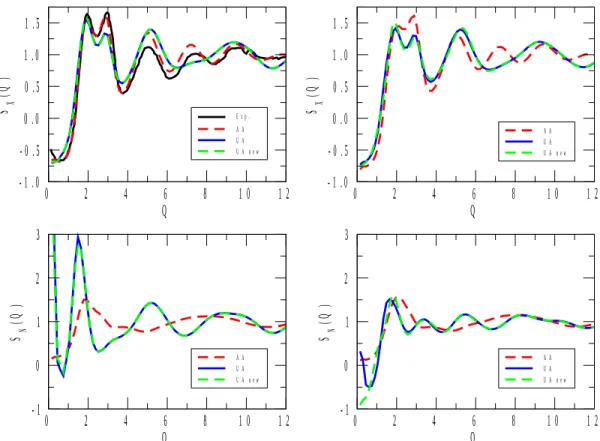
X-ray and neutron-weighted total structure factors for the 1-propanol and 2-propanol mixtures are displayed in Figures 1 to 5. Calculated total structure factors are shown for the original[22] and re-parametrized (ref.[17] for 1-propanol) UA, as well as for the AA[23] alcohol potential models. X-ray experimental data, where available, are from the present work, whereas neutron diffraction data for pure 1- and 2-propanol were taken from ref.[6] and ref.[9], respectively. (Note that in Figure 1, the neutron weighted experimental structure factor[9], SN(Q), looks somewhat off-scaled. We have attempted to find a proper scaling factor, but as this effort proved unsuccessful, the original scale has been maintained. It is still obvious that it is the AA model that follows maximum and minimum positions nearly perfectly, where the two UA potentials led to observable shifts in terms of the positions of the extrema.)
As a general statement, for all compositions the AA alcohol model provided a better description of the experimentally determined functions than the other two models, UA[22] and UA_new. Another general observation is that UA and UA_new have brought about almost identical behavior in terms of the structure (this, again, valid across the entire concentration region). That is, despite the enormous differences in terms of, e.g., the dielectric constants calculated from the two united atom type potentials (see Table 2), re-parametrization has not helped in producing better structural models.
Figure 1 shows total structure factors obtained by X-ray and neutron diffraction for 1- propanol (left panels). The simulated SX(Q) for all (UA, UA_new and AA) alcohol potential models seem to fit the experimental spectrum quite well. Similar behavior is observed for 2- propanol (the AA model seems to be slightly better that the two UA models). The good performance of the united atom models means that for pure 1- and 2-propanol, we do have
structural models (without non-alcoholic hydrogen atoms though) whose dielectric constants and X-ray weighted total structure factors are nearly equally realistic.
The simulated SN(Q) spectrum for AA 1-propanol also provides a good description of the neutron diffraction measurement[6]. For 2-propanol, again, the AA model is clearly better than the UA models (cf. also the notes concerning the corresponding experimental data[9]
above). The misfit between the UA models and experiment is understandable by noting that whereas X-rays are relatively insensitive to hydrogen atoms, the scattering power of (particularly heavy) hydrogen is considerable for neutrons. By uniting the CHn groups according to the UA philosophy, the measured information from pair correlations involving H is lost (or at least, severely averaged out); this is why UA-type models are not good choices for describing neutron diffraction experimental data in general. Having this in mind, it is not surprising that in each of Figures 1 to 5, differences between predictions from UA and AA potentials are large in terms of SN(Q). Also, it is always the AA predictions that may be considered as better in this sense, c.f., for instance, the complete failure of UA models at low Q values at low alcohol concentrations (see Figures 4 and 5). In what follows, more detailed discussions will concern X-ray data only (also for the reason that they are the ones that have been determined during the present study).
The UA models predict SX(Q) better at the lowest alcohol concentrations and for pure alcohols than at intermediate (20 to 80 mol % of alcohol) compositions. A similar observation may be made concerning the performance of the AA potential model, and could be made earlier[17] concerning the temperature dependent dielectric constant of 1-propanol/water mixtures. This is most probably the unfortunate consequence of the fact that, in general, potential models are developed for pure substances (like UA_new for 2-propanol in the present work). Consequently, if the performance of potential functions developed for pure alcohols provide unsatisfactory results when applied to aqueous mixtures then a separate
potential development procedure would be necessary for every mixture. Such an effort, however, is most certainly too expensive and/or impractical.
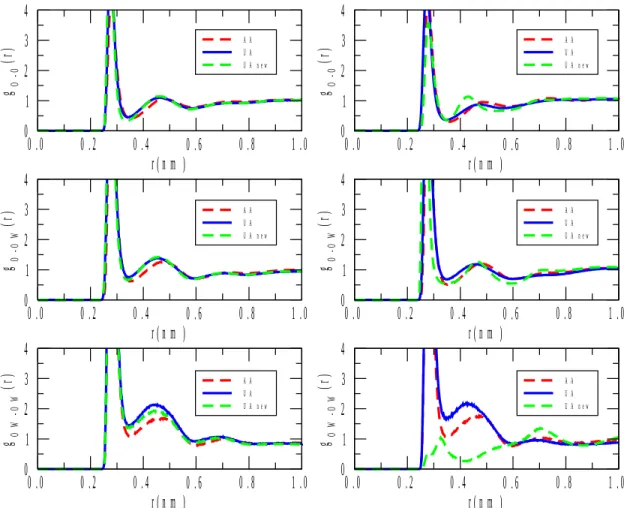
Turning now to real space structural properties, selected partial radial distribution functions (PRDF), gij(r), are going to be introduced. We do not wish, at this early stage, to scrutinize every single PRDF until a definite conclusion concerning the most appropriate interatomic potentials is reached. We thus report various O-O PRDF-s that (a) have reasonably high weighting factors in the X-ray total structure factor (contrary to PRDF-s that contain hydrogen), and (b) are related to hydrogen bonding in the neat substances and in the mixtures alike.
Figure 6 shows the (only) oxygen-oxygen PRDF present in the pure alcohols. The most striking finding is that while for 1-propanol, the curves that belong to the original[22] and modified UA, and the AA[23] potentials run together, for 2-propanol there are three distinct lines. The largest departure is registered for the modified UA potentials in both propanols. If we now go back to the X-ray weighted total structure factors (Figure 1), an analogous phenomenon is apparent: whereas for 1-propanol, the three potentials bring about nearly identical SX(Q)-s, for 2-propanol, it is only the OPLS/AA[23] model that produces a very good agreement with experiment. The consequence of these observations is that while the O-O PRDF-s of 1-propanol originating to all the three potentials applied here can be taken as roughly equally reliable, for 2-propanol only the OPLS/AA force field was able to produce a trustable O-O PRDF.
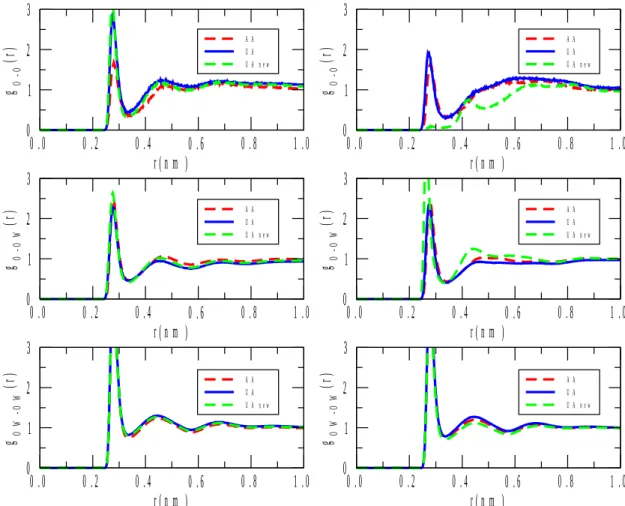
As it may be discerned from Figures 2 to 5, differences between total SX(Q)-s originating to the UA-type and AA potential models are somewhat larger for 2-propanol/water mixtures. This is reflected by the corresponding O-O PRDF-s, too, as exemplified by Figures 7 and 8, where the three possible O-O partials (alcohol-alcohol, alcohol-water and water-water) are provided for one alcohol-rich and one water rich mixture (with 80 and 10 molar % of alcohol). For the 1-propanol containing mixtures, differences
observed here-and-there are only in terms of the amplitudes, whereas for 2-propanol/water mixtures variations are more drastic, particularly by the curves corresponding to the modified UA potentials (‘UA_new’).
In both mixtures, and on each O-O PRDF, a nearest neighbor distance of about 0.3 nm can be observed. This is consistent with the notion that there are alcohol-alcohol, alcohol- water and water-water hydrogen bonds in these liquids, just as expected.
Another notable feature is that, especially in the case of the alcohol-rich mixture (Figure 7), the two pure O-O PRDF-s, alcohol-alcohol and water-water, the functions do not oscillate around unity but display slopes. A similar behavior has been presented (and left uncommented) by a recent, neutron diffraction based, study for 2-propanol/water liquid mixtures[14]. The obvious interpretation would be that water molecules distinctly prefer water neighbors; on the other hand, propanol molecules do not want to have propanol neighbors (the water-water preference is the large effect, cf. Figure 7). Given the composition (80 % of alcohol), this would mean the formation of ‘water-islands’ in the mixture. Once the question of appropriate potential functions is settled, this feature would deserve a separate, in-depth investigation.
From figure 7 a high first peak for oxygens of 1-propanol is observed, suggesting strong interactions between alcohol molecules at high alcohol concentration. When the alcohol concentration decreases, there are more water molecules around 1-propanol molecules so their head-to-head interaction is reduced, as indicated by a lower first peak in the radial distribution function (see figure 8). In fact, for the AA model the peak is even lower than for the other alcohol models. It is also interesting to observe a higher first peak in the g(r) of water (oxygen) with oxygen of the 1-propanol at high alcohol concentration than seen at low concentration (middle plots of figures 7 and 8). At high alcohol concentration, water and (alcohol) OH groups display stronger attraction, whereas at low alcohol concentration there are fewer water molecules close to the (alcohol) OH groups. Similar trends are observed for
the water-2-propanol mixtures at high alcohol concentration as for the water-1-propanol mixture. However, at low 2-propanol concentration some differences are depicted, in particular for the UA new model (right top and middle plots of figure 8). For that model the alcohol oxygen-oxygen interaction is weak, as suggested by the almost negligible first peak in the PRDF. Moreover, the structure of this system is slightly different compared with the form of the other potential models, as indicated by the g(r). On the other hand, it seems that more alcohols (oxygens) are closer to water molecules, as indicated by the first peak in the g(r) plot.
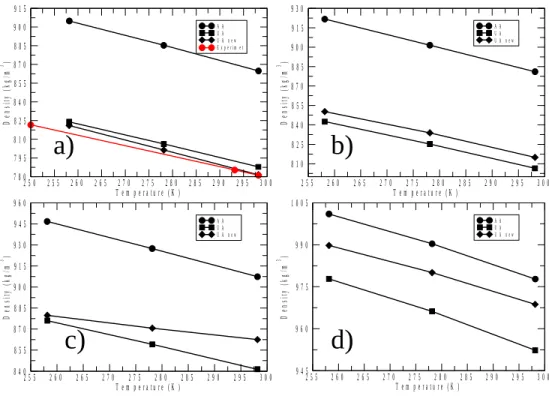
Finally, the determination of the temperature dependent (mass) density is reported for 2-propanol/water mixtures (for 1-propanol/water mixtures, this has already been published[17]). As it is evident from Figure 9, density values that belong to the OPLS/AA[23]
potential are the most distinct – and, as comparison with experimental data for pure 2- propanol shows (Figure 9, part ‘a’), OPLS/AA densities match measured data the least, with an about 10 % margin. The same has been found for the density and dielectric constant of 1- propanol and its aqueous mixtures[17]: the OPLS/AA potential provided worse agreement with experimental densities and dielectric constants than the UA-type force fields. This is, unfortunately, a behavior exactly opposite to what has been established for structural properties in the large part of the present study.
5. Summary and Conclusions
New synchrotron X-ray diffraction experiments have been conducted for pure 1- and 2- propanol, as well for their 4 mixtures with water. Molecular dynamics simulations with both
‘united atom’ and ‘all atom’ type interatomic potentials for the alcohols, and using the TIP4P/
ε water potential model, have been performed. X-ray and neutron weighted total structure factors were determined from the simulation results and compared to diffraction data in the reciprocal space. Densities were also calculated from the molecular dynamics trajectories, and compared to available experimental data.
An optimization method[24] for obtaining an improved set of potential parameters was applied to the pure 2-propanol OPLS/UA force field[22]. The new parameters were validated against the experimental dielectric constant, density and surface tension. Although concerning most of these properties the modified potential does represent an improvement, the calculated total structure factors are not (or, at most, hardly at all) different from those obtained from the original parametrization[22].
It has been shown that the X-ray weighted structure factors may be represented by the UA force field (both the original and the new UA) satisfactorily for the pure alcohols;
agreement for the aqueous mixtures may be termed ‘qualitative’ in the best cases. That is, for calculating structural properties, the UA-type potentials are not applicable for 1-propanol/water and 2-propanol/water mixtures. On the other hand, the OPLS/AA force field[23] has proven to be consistently better in comparison with the X-ray diffraction data;
also, for the reproduction of neutron diffraction data, only the all atom type potential is applicable. Therefore concerning structural properties, the application of the OPLS/AA alcohol potential, in combination with the TIP4P/ε water model[24], is recommended.
The AA- and UA-type potentials produce similar O-O partial radial distribution functions for 1-propanol and its mixtures with water. However, for 2-propanol and its mixtures, only PRDF-s originating to the OPLS/AA potential model may be trusted.
Finally, it has to be admitted that significant differences in terms of the capabilities of the various force fields has been shown for the dielectric constant[17] and density (Figure 9): in both cases, the modified UA force field has proven to be better than either the AA[23], or the original UA[22] models. That is, even though the structure of 1-propanol/water and 2-propanol/
water liquid mixtures is well described by the all atom type potentials applied here, the OPLS/
AA force field[23] still is not capable of capturing the overall behavior of these systems. In other words, depending on the specific target property, one should, unfortunately, pick different potential models for molecular simulations propanol/water mixtures.
Acknowledgement
LT and LP were supported by the National Research, Development and Innovation Office (Hungary), via grant No. SNN116198. HD and JGM-B acknowledge supercomputer facilities of DGTIC-UNAM (México) grant LANCAD-UNAM-DGTIC-238. László Temleitner is grateful to the János Bolyai Research Scholarship of the Hungarian Academy of Sciences.
Synchrotron radiation experiments were performed with the approval of the Japan Synchrotron Radiation Research Institute (JASRI) (Proposal No. 2013A1083). JGM- Bermudez acknowledges Programa para el Desarrollo Profesional (PRODEP) for financial support. Hector Domíngez acknowledges DGAPA-UNAM grant IN102017.
References
[1] A. Mikusińska-Planner, Acta Crystallogr., Sect. A: Cryst. Phys., Diffr., Theor.
Gen. Crystallogr.1977, 33, 433.
[2] K. S. Vahvaselkä, R. Serimaa, M. Torkkeli, J. of Appl. Crystallogr. 1995, 28, 189.
[3] I. Akiyama, M. Ogawa, K. Takase, T. Takamuku, T. Yamaguchi, N. Ohtori, J. Solution Chem., 2004, 33, 797-809.
[4] M. Tomšič, A. Jamnik, G. Fritz-Popovski, O. Glatter, L. Vlček, J. Phys. Chem. B 2007, 111, 1738.
[5] A. Sahoo, S. Sarkar, P. S. R. Krishna, V. Bhagat, R. N. Joarder, Pramana 2008, 71, 133.
[6] A. Sahoo, S. Sarkar, V. Bhagat, R. N. Joarder, J. Phys. Chem. A 2009, 113, 5160.
[7] P. Sillrén, J. Swenson, J. Mattsson, D. Bowron, A. Matic, J. Chem. Phys. 2013, 138, 214501.
[8] L. A. Rodríguez Palomino, G. J. Cuello, A. Stunault, J. Dawidowski, Philos. Mag. 2015, 96, 816.
[9] P. Zetterström, U. Dahlborg, W. S. Howells, Mol. Phys. 1994, 81, 1187.
[10] A. Sahoo, S. Sarkar, P. S. R. Krishna, R. N. Joarder, Pramana 2010, 74, 765.
[11] H. Hayashi, K. Nishikawa, T. Iijima, J. Phys. Chem. 1990, 94, 8334.
[12] T. Takamuku, H. Maruyama, K. Watanabe, T. Yamaguchi, J. Solution Chem. 2004, 33, 641.
[13] T. Takamuku, K. Saisho, S. Nozawa, T. Yamaguchi, J. Mol. Liq. 2005, 119, 133.
[14] J. McGregor, R. Li, J. A. Zeitler, C. D'Agostino, J. H. Collins, M. D. Mantle, Haresh Manyar, J. D. Holbrey, M. Falkowska, T. G. A. Youngs, C. Hardacre, E. H. Stitt, L. F.
Gladden, Phys. Chem. Chem. Phys. 2015, 17, 30481.
[15] H. J. Tong, J. Y. Yu, Y. H. Zhang, J. P. Reid, J. Phys. Chem. A 2010, 114, 6795.
[16] A. Vrhovsek, O. Gereben, A. Jamnik, L. Pusztai, J. Phys. Chem. B 2011, 115, 13473.
[17] J. G. Méndez-Bermúdez, H. Dominguez, L. Pusztai, S. Guba, B. Horváth, I. Szalai, J.
Mol. Liq. 2016, 219, 354.
[18] S. Kohara, K. Suzuya, Y. Kashihara, N. Matsumoto, N. Umesaki, I. Sakai, Nucl.
Instrum. Methods Phys. Res. A 2001, 467, 1030.
[19] S. Kohara, M. Itou, K. Suzuya, Y. Inamura, Y. Sakurai, Y. Ohishi, M. Takata, J. Phys.:
Condens. Matter 2007, 19, 506101.
[20] http://www.gromacs.org; D. van der Spoel, E. Lindahl, B. Hess, G. Groenhof, A. E.
Mark, H. J. C. Berendsen, J. Comp. Chem. 2005, 26, 1701.
[21] F. Fuentes-Azcatl, J. Alejandre, J. Phys. Chem. B 2014, 118, 1263.
[22] W. L. Jorgensen, J . Phys. Chem. 1986, 90, 1276.
[23] W. L. Jorgensen, D. S. Maxwell, J. Tirado-Rives, J. Am. Chem. Soc. 1996, 118, 11236.
[24] F. J. Salas, G. A. Méndez-Maldonado, E. Nuñez-Rojas, G. E. Aquilar-Pineda, H.
Dominguez, J. Alejandre, J. Chem. Theory Comput. 2015, 11, 683.
[25] H. J. C Berendsen, J. P. M. Postma, W. F. van Gunsteren, A. DiNola, J. R. Haak, J.
Chem. Phys. 1984, 81, 3684.
[26] N. V. Sastry, S.R. Patel, J. Chem. Thermodyn. 2000, 32, 1669.
[27] G. Vazquez, E. Alvarez, J. M. Navaza, J.Chem. Eng. Data 1995, 40, 611.
[28] F. M. Pang, C. E. Seng, T. T. Teng, W. H. Ibrahin, J. Mol. Liq. 2007, 136, 71.
[29] D. Waasmaier, A. Kirfel, Acta Crystallogr. 1995, A51, 416.
[30] V. F. Sears, Neutron News 1992, 3, 26.
2-Propanol sites
UA charges (e)[22]
UA_new charge (e)
UA energy ε LJ parameter (kJ/mol)[22]
UA_new energy ε LJ parameter (kJ/mol)
UA σ LJ parameter (nm)[22]
UA_new σ LJ parameter (nm)
H(-OH) 0.4350 0.4667 0.00000 0.00000 0.000 0.00000
O(-OH) -0.700 -1.2088 0.77325 0.55674 0.302 0.31861
C(C-OH) 0.2650 0.8485 0.08314 0.05986 0.433 0.45682
C(CH3-C) 0.0000 -0.0532 0.81482 0.58667 0.375 0.39563
Table 1: Original[22] and modified (‘UA_new’) UA potential values of partial charges and Lennard-Jones parameters for 2-propanol.
Table 2: Various properties of 2-propanol at T=298 K as calculated via the original[22] and re-parametrized (‘UA_new’) UA force fields. For comparison, the corresponding experimental values are also shown.
Optimized parameters UA (% error) UA_new (% error) Experimental values Dielectric constant, 9.97954 (48.17) 19.1433 (0.58) 19.255[26]
Surface tension, γ (mN/
m2)
21.5746 (1.67) 23.6297 (11.36) 21.22[27]
Density, (kg/m3) 787.866 (0.86) 781.519 (0.05) 781.11[28]
0 2 4 6 8 1 0 1 2 1 4 1 6 Q
- 0 . 50 . 00 . 51 . 01 . 52 . 02 . 53 . 03 . 54 . 04 . 5 S X(Q)
E x p . A A U A U A n e w
0 2 4 6 8 1 0 1 2 1 4 1 6
Q - 0 . 50 . 01 . 02 . 03 . 04 . 00 . 51 . 52 . 53 . 54 . 5
S X(Q)
E x p . A A U A U A n e w
0 2 4 6 8 1 0 1 2 1 4
Q - 0 . 5
0 . 0 0 . 5 1 . 0 1 . 5 2 . 0 2 . 5 3 . 0
S N(Q)
E x p . A A U A U A n e w
0 2 4 6 8 1 0 1 2 1 4 1 6 1 8 2 0
Q - 0 . 5
0 . 0 0 . 5 1 . 0 1 . 5 2 . 0 2 . 5 3 . 0
S N(Q)
E x p . A A U A U A n e w
Figure 1 X-ray and neutron weighted total structure factors, SX(Q) and SN(Q), respectively, for pure 1- (left panels) and 2- (right panels) propanol. The experimental neutron diffraction spectra are taken from ref.[6] and ref.[9]. The experimental temperature for 2-propanol SN(Q) is 250 K, whereas the other structure factors were all measured (and simulated) at 298 K.
(Note that the experimental SN(Q) for 2-propanol is representative only as far as the positions (but not the intensities) of the extrema are concerned.)
0 2 4 6 8 1 0 1 2 1 4 1 6 Q
- 0 . 5 0 . 0 0 . 5 1 . 0 1 . 5 2 . 0 2 . 5 3 . 0 3 . 5
S X(Q)
A A U A U A n e w
0 2 4 6 8 1 0
Q - 0 . 5
0 . 0 0 . 5 1 . 0 1 . 5 2 . 0 2 . 5 3 . 0 3 . 5
S X(Q)
E x p . A A U A U A n e w
0 2 4 6 8 1 0 1 2 1 4 1 6
Q - 0 . 5
0 . 0 0 . 5 1 . 0 1 . 5 2 . 0 2 . 5 3 . 0 3 . 5
S N(Q)
A A U A U A n e w
0 2 4 6 8 1 0
Q - 0 . 5
0 . 0 0 . 5 1 . 0 1 . 5 2 . 0 2 . 5 3 . 0 3 . 5
S N(Q)
A A U A U A n e w
Figure 2 X-ray and neutron weighted total structure factors, SX(Q) and SN(Q), respectively, for aqueous mixtures of 1- (left panels) and 2- (right panels) propanol, at 80% molar concentration of alcohol. The experimental spectrum of the 2-propanol/water mixtures was determined in the course of the present study.
0 2 4 6 8 1 0 1 2 Q
- 0 . 5 0 . 0 0 . 5 1 . 0 1 . 5 2 . 0 2 . 5
S X(Q)
E x p . A A U A U A n e w
0 2 4 6 8 1 0 1 2
Q - 0 . 5
0 . 0 0 . 5 1 . 0 1 . 5 2 . 0 2 . 5
S X(Q)
A A U A U A n e w
0 2 4 6 8 1 0 1 2
Q - 0 . 5
0 . 0 0 . 5 1 . 0 1 . 5 2 . 0 2 . 5
S N(Q)
A A U A U A n e w
0 2 4 6 8 1 0 1 2
Q - 0 . 5
0 . 0 0 . 5 1 . 0 1 . 5 2 . 0 2 . 5
S N(Q)
A A U A U A n e w
Figure 3 X-ray and neutron weighted total structure factors, SX(Q) and SN(Q), respectively, for aqueous mixtures of 1- (left panels) and 2- (right panels) propanol, at 50% molar concentration of alcohol. The experimental spectrum of the 1-propanol/water mixtures was determined in the course of the present study.
0 2 4 6 8 1 0 1 2 1 4 1 6 Q
- 0 . 5 0 . 0 0 . 5 1 . 0 1 . 5
S X(Q)
A A U A U A n e w
0 2 4 6 8
Q - 0 . 5
0 . 0 0 . 5 1 . 0 1 . 5
S X(Q)
E x p . A A U A U A n e w
0 2 4 6 8 1 0 1 2 1 4 1 6
Q - 0 . 5
0 . 0 0 . 5 1 . 0 1 . 5 2 . 0
S N(Q)
A A U A U A n e w
0 2 4 6 8
Q - 0 . 5
0 . 0 0 . 5 1 . 0 1 . 5 2 . 0
S N(Q)
A A U A U A n e w
Figure 4 X-ray and neutron weighted total structure factors, SX(Q) and SN(Q), respectively, for aqueous mixtures of 1- (left panels) and 2- (right panels) propanol, at 20% molar concentration of alcohol. The experimental spectrum of the 2-propanol/water mixtures was determined in the course of the present study.
0 2 4 6 8 1 0 1 2 Q
- 1 . 0 - 0 . 5 0 . 0 0 . 5 1 . 0 1 . 5
S X(Q)
E x p . A A U A U A n e w
0 2 4 6 8 1 0 1 2
Q - 1 . 0
- 0 . 5 0 . 0 0 . 5 1 . 0 1 . 5
S X(Q)
A A U A U A n e w
0 2 4 6 8 1 0 1 2
Q - 1
0 1 2 3
S N(Q)
A A U A U A n e w
0 2 4 6 8 1 0 1 2
Q - 1
0 1 2 3
S N(Q)
A A U A U A n e w
Figure 5 X-ray and neutron weighted total structure factors, SX(Q) and SN(Q), respectively, for aqueous mixtures of 1- (left panels) and 2- (right panels) propanol, at 10% molar concentration of alcohol. The experimental spectrum of the 1-propanol/water mixtures was determined in the course of the present study.
0 . 0 0 . 2 0 . 4 0 . 6 0 . 8 1 . 0
r ( n m ) 0
1 2
g O-O(r)
A A U A U A n e w
0 . 0 0 . 2 0 . 4 0 . 6 0 . 8 1 . 0
r ( n m ) 0
1 2
g O-O(r)
A A U A U A n e w
Figure 6 gO-O(r) (O: alcohol oxygen) in pure 1-propanol (left) and 2-propanol (right).
0 . 0 0 . 2 0 . 4 0 . 6 0 . 8 1 . 0 r ( n m )
0 1 2 3 4
g O-O(r) A AU A
U A n e w
0 . 0 0 . 2 0 . 4 0 . 6 0 . 8 1 . 0 r ( n m )
0 1 2 3 4
g O-O(r) A AU A
U A n e w
0 . 0 0 . 2 0 . 4 0 . 6 0 . 8 1 . 0 r ( n m )
0 1 2 3 4
g O-OW(r) A A
U A U A n e w
0 . 0 0 . 2 0 . 4 0 . 6 0 . 8 1 . 0 r ( n m )
0 1 2 3 4
g O-OW(r) A A
U A U A n e w
0 . 0 0 . 2 0 . 4 0 . 6 0 . 8 1 . 0 r ( n m )
0 1 2 3 4
g OW-OW(r) A A
U A U A n e w
0 . 0 0 . 2 0 . 4 0 . 6 0 . 8 1 . 0 r ( n m )
0 1 2 3 4
g OW-OW(r) A A
U A U A n e w
Figure 7 Oxygen-oxygen partial radial distribution functions gO-O(r) (O: alcohol oxygen), gO-OW(r) (OW: water oxygen) and gOW-OW(r) for aqueous mixtures with 1-propanol (left) and 2-propanol (right) at 80% molar concentration of the alcohol.
0 . 0 0 . 2 0 . 4 0 . 6 0 . 8 1 . 0 r ( n m )
0 1 2 3
g O-O(r) A AU A
U A n e w
0 . 0 0 . 2 0 . 4 0 . 6 0 . 8 1 . 0 r ( n m )
0 1 2 3
g O-O(r) A AU A
U A n e w
0 . 0 0 . 2 0 . 4 0 . 6 0 . 8 1 . 0 r ( n m )
0 1 2 3
g O-OW(r) A A
U A U A n e w
0 . 0 0 . 2 0 . 4 0 . 6 0 . 8 1 . 0 r ( n m )
0 1 2 3
g O-OW(r) A A
U A U A n e w
0 . 0 0 . 2 0 . 4 0 . 6 0 . 8 1 . 0 r ( n m )
0 1 2 3
g OW-OW(r) A A
U A U A n e w
0 . 0 0 . 2 0 . 4 0 . 6 0 . 8 1 . 0 r ( n m )
0 1 2 3
g OW-OW(r) A A
U A U A n e w
Figure 8 Oxygen-oxygen partial radial distribution functions gO-O(r) (O: alcohol oxygen), gO-OW(r) (OW: water oxygen) and gOW-OW(r) for aqueous mixtures with 1-propanol (left) and 2-propanol (right) at 10% molar concentration of the alcohol.
2 5 0 2 5 5 2 6 0 2 6 5 2 7 0 2 7 5 2 8 0 2 8 5 2 9 0 2 9 5 3 0 0 T e m p e r a t u r e ( K )
7 8 0 7 9 5 8 1 0 8 2 5 8 4 0 8 5 5 8 7 0 8 8 5 9 0 0 9 1 5
Density (kg/m3 )
A A U A U A n e w E x p e r i m e t
2 5 5 2 6 0 2 6 5 2 7 0 2 7 5 2 8 0 2 8 5 2 9 0 2 9 5 3 0 0 T e m p e r a t u r e ( K )
8 1 0 8 2 5 8 4 0 8 5 5 8 7 0 8 8 5 9 0 0 9 1 5 9 3 0
Density (kg/m3 )
A A U A U A n e w
2 5 5 2 6 0 2 6 5 2 7 0 2 7 5 2 8 0 2 8 5 2 9 0 2 9 5 3 0 0 T e m p e r a t u r e ( K )
8 4 0 8 5 5 8 7 0 8 8 5 9 0 0 9 1 5 9 3 0 9 4 5 9 6 0
Density (kg/m3 )
A A U A U A n e w
2 5 5 2 6 0 2 6 5 2 7 0 2 7 5 2 8 0 2 8 5 2 9 0 2 9 5 3 0 0 T e m p e r a t u r e ( K )
9 4 5 9 6 0 9 7 5 9 9 0 1 0 0 5
Density (kg/m3 )
A A U AU A n e w
a) b)
c) d)
Figure 9. Densities of 2-propanol/water mixtures for a) 100%, b) 80%, c) 50% and d) 10%
alcohol molar concentrations. Experimental data were taken [14]. Note the odd behavior observed for the mixture with 50 % 2-propanol, which also indicates that most problems occur when the composition is the furthest away from being a neat liquid.
Table of contents: The first and the last figure show that all-atom molecular models for 1- propanol and 2-propanol, respectively, represent the experimental structure factor better that any united-atom model. In the central scheme we observe that united-atom model is the best to represent density. So, there is not a molecular model that represents structural and thermodynamics properties at the same time.
0 2 4 6 8 1 0 1 2 1 4 1 6
Q - 0 . 50 . 01 . 02 . 03 . 04 . 00 . 51 . 52 . 53 . 54 . 5
SX(Q)
E x p . A A U A U A n e w
2 5 0 2 5 5 2 6 0 2 6 5 2 7 0 2 7 5 2 8 0 2 8 5 2 9 0 2 9 5 3 0 0
T e m p e r a t u r e ( K ) 7 8 0
7 9 5 8 1 0 8 2 5 8 4 0 8 5 5 8 7 0 8 8 5 9 0 0 9 1 5
Density (kg/m3 )
A A U AU A n e w E x p e r i m e t
0 2 4 6 8 1 0 1 2 1 4 1 6
Q - 0 . 50 . 01 . 02 . 03 . 04 . 00 . 51 . 52 . 53 . 54 . 5
SX(Q)
E x p . A A U A U A n e w
![Table 1: Original [22] and modified (‘UA_new’) UA potential values of partial charges and Lennard-Jones parameters for 2-propanol.](https://thumb-eu.123doks.com/thumbv2/9dokorg/1413250.119219/16.918.116.820.106.382/original-modified-potential-partial-charges-lennard-parameters-propanol.webp)