ARTICLE
SREBP1 drives Keratin-80-dependent cytoskeletal changes and invasive behavior in endocrine-
resistant ER α breast cancer
Ylenia Perone
1,14, Aaron J. Farrugia
2,14, Alba Rodríguez-Meira
1,12,14, Balázs Gy ő rffy
3,4, Charlotte Ion
1, Andrea Uggetti
5, Antonios Chronopoulos
6, Pasquale Marrazzo
7, Monica Faronato
8, Sami Shousha
9, Claire Davies
10, Jennifer H. Steel
10, Naina Patel
10, Armando del Rio Hernandez
6, Charles Coombes
1, Giancarlo Pruneri
11, Adrian Lim
1, Fernando Calvo
2,13& Luca Magnani
1Approximately 30% of ER α breast cancer patients relapse with metastatic disease following adjuvant endocrine therapies. The connection between acquisition of drug resistance and invasive potential is poorly understood. In this study, we demonstrate that the type II keratin topological associating domain undergoes epigenetic reprogramming in aromatase inhibitors (AI)-resistant cells, leading to Keratin-80 (KRT80) upregulation. KRT80 expression is driven by de novo enhancer activation by sterol regulatory element-binding protein 1 (SREBP1).
KRT80 upregulation directly promotes cytoskeletal rearrangements at the leading edge, increased focal adhesion and cellular stiffening, collectively promoting cancer cell invasion.
Shearwave elasticity imaging performed on prospectively recruited patients con fi rms KRT80 levels correlate with stiffer tumors. Immunohistochemistry showed increased KRT80-positive cells at relapse and, using several clinical endpoints, KRT80 expression associates with poor survival. Collectively, our data uncover an unpredicted and potentially targetable direct link between epigenetic and cytoskeletal reprogramming promoting cell invasion in response to chronic AI treatment.
https://doi.org/10.1038/s41467-019-09676-y
OPEN
1Department of Surgery and Cancer, Imperial College London, London, UK.2Division of Cancer Biology, Tumour Microenvironment Team, Institute of Cancer Research, London, UK.3MTA TTK Lendület Cancer Biomarker Research Group, Institute of Enzymology, Hungarian Academy of Sciences, Budapest, Hungary.42nd Department of Pediatrics, Semmelweis University, Budapest, Hungary.5European Institute of Oncology, Milan, Italy.
6Faculty of Engineering, Department of Bioengineering, Imperial College London, London, UK.7Department for Life Quality Studies, Alma Mater Studiorum, University of Bologna, Rimini, Italy.8Department of Chemistry, Imperial College London, London, UK.9Histopathology Department, Imperial College London, Charing Cross Hospital NHS Trust, London, UK.10ECMC Imperial College. Department of Surgery and Cancer, Imperial College London, London, UK.11Pathology Department, Fondazione IRCCS Istituto Nazionale Tumori and University of Milan, School of Medicine, Milan, Italy.12Present address: MRC Molecular Haematology Unit, Haematopoietic Stem Cell Biology Laboratory, Weatherall Institute of Molecular Medicine, University of Oxford, Oxford, UK.13Present address: Instituto de Biomedicina y Biotecnologia de Cantabria, Santander, Spain.14These authors contributed equally: Ylenia Perone, Aaron J. Farrugia, Alba Rodríguez Meira. Correspondence and requests for materials should be addressed to F.C. (email:calvof@unican.es) or to L.M. (email:l.magnani@imperial.ac.uk)
1234567890():,;
A romatase inhibitors (AI) treatment is standard of care for breast cancer (BC), yet BC cells frequently display drug- resistance and stronger metastatic potential at relapse, suggesting that chronic exposure to endocrine treatment might contribute in shaping the invasive potential, as suggested by previous in vitro studies1,2. The mechanism/s, order of events and molecular players mediating these phenomena are not well understood but it is likely that they involve cytoskeletal re- arrangements as they are essential for cancer invasion and metastasis
3. One possibility is that endocrine therapies (ET) might indirectly promote invasive behaviors by selecting for interrelated phenotypes during tumor evolution
4–6. Alternatively, AI treatment may directly contribute to the activation of invasive transcriptional programs. Chronic exposure to ET leads to coordinated activation and decommissioning of regulatory regions such as enhancer and promoters as shown by global changes in the localization of epigenetic marks H3K27ac and H3K4me1-2
6,7,8. These epigenetic changes occasionally involve entire topological associating domains (TADs), three- dimensional compartments within the genome thought to restrict enhancer-promoter interactions
9,10. In this manuscript, we show how drug-induced epigenetic reprogramming leads to significant cytoskeletal changes and mechano-properties at the cellular level to promote invasive behavior.
Results
Epigenetic reprogramming leads to KRT80 expression in drug- resistant BC. We have previously shown that the type II keratin TAD
7ranked among the most significantly epigenetically reprogrammed TADs when comparing untreated (MCF7, ERα- positive breast cancer cell lines) non-invasive ET-treated (MCF7 cells resistant to Tamoxifen: MCF7T or Fulvestrant: MCF7F) vs.
invasive AI-resistant BC cell lines
7(MCF7 that were long term estrogen deprived: LTED cells, and double resistant LTEDT and LTEDF Fig. 1a, b). ChIP-seq efficiencies were rather different across each cell line but, genome-wide normalization confirmed that overall, the type II keratin TAD accrues significantly more H3K27ac reads in invasive LTED cells compared with MCF7 and MCF7T cells (Top 5% for differential
9, Fig. 1a inset). Targeted validation within one of the potential enhancers (E1) using H3K27ac, H3K4me2, and H3K4me1 confirmed the significant increase of H3K27ac between MCF7 and LTED (Fig. 1c). Type I and Type II Keratins are the main constituents of cytoplasmic intermediate filaments and are involved in crucial cellular pro- cesses including cell attachment, stress adaptation, and cell structure maintenance; yet very little is known about their role in cell movement and metastatic progression. Despite TAD dynamics, only few keratins within the type II-keratin TAD were transcriptionally reprogrammed in AI-resistant cell lines, with KRT80 being the only member which was consistently upregu- lated in all LTED models, including LTED-derivatives from a different breast cancer cell line (T47D, Fig. 1a, b and Supple- mentary Fig. 1a, b). Live-tracking cells during the initial 48 h of estrogen deprivation shows the absence of substantial prolifera- tion and/or cell death, suggesting that the majority of cells simply stall within this time frame (Fig. 1d, flat orange line from 6 to 48 h). Measuring KRT80 transcripts before or after short-term (48 h) acute estrogen starvation using single cell RNA-seq data shows a significant increase in the proportion of KRT80 positive cells, strongly suggesting that this increase is driven by de novo tran- scriptional activation and not selection of KRT80-positive clones (Fig. 1e). These data were validated in MCF7 and LTED cells using single cell RNA-FISH (Fig. 1f). As expected, increased transcription corresponded to increased KRT80 protein level in both MCF7 and T47D models (Fig. 1g). Interestingly, LTED
cells also show significant changes in H3K27ac levels and mRNA expression for cholesterol biosynthesis genes
7, but unexpectedly the master regulator of cholesterol biosynthesis SREBP1
11shows no transcriptional changes between the two cell types, suggesting that reprogramming is not driven by transcriptional factor abundance but rather by its activity
7(Fig. 1f).
KRT80 dynamically changes during breast cancer progression in vivo. KRT80 is a largely unknown keratin structurally related to hair keratins
12, in contrast with epithelial keratins commonly found in normal epithelial cells. This led us to further explore the role of KRT80 in promoting the invasive phenotype developed by LTED as a consequence of AI-resistance
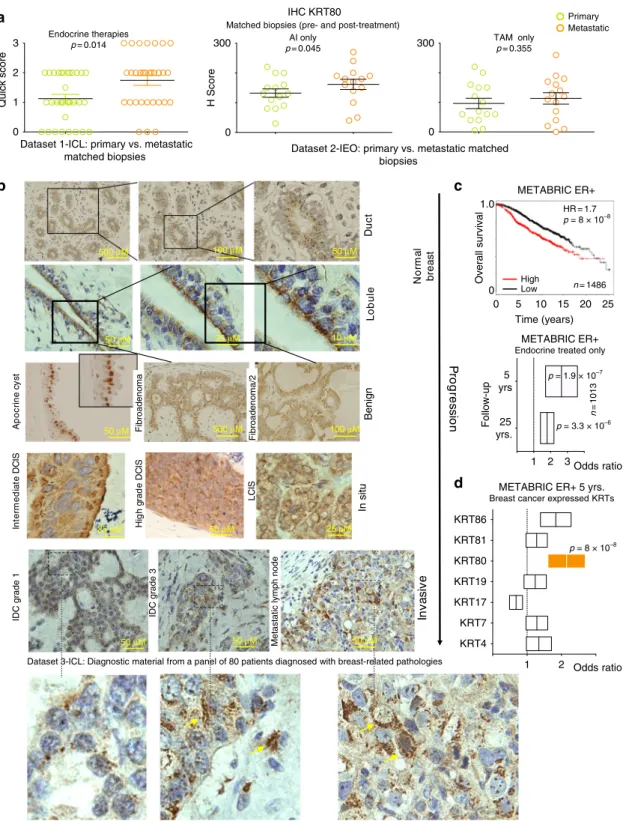
7. KRT80 transcripts were also elevated in several ERα-negative cell lines, suggesting that upregulation in drug-resistant cells was not mediated by changes in ERα activity (Supplementary Data 1). More impor- tantly, IHC analysis of two independent clinical datasets con- firmed that KRT80 positive cells significantly increase after AI treatment while showing a trend in Tamoxifen-treated patients in vivo
13,14(Fig. 2a). KRT80 localization in vivo was radically different to what has been shown in conventional keratins (e.g., KRT8, KRT14, KRT18, or KRT19
15), presenting a peri-nuclear polarized pattern towards the lumen within healthy ducts and lobules (Fig. 2b). Similar staining patterns were conserved in benign lesions (Fig. 2b), whereas KRT80 staining became strongly cytoplasmic in higher grade BC and metastatic lesions suggesting a potential role in BC progression (Fig. 2b). Correspondingly, high KRT80 mRNA levels correlated with poor survival in the METABRIC ERα-positive BC dataset (Fig. 2c), even more sig- nificantly when selecting patients that did relapse early and were treated with endocrine therapies (Fig. 2c). The prognostic role of KRT80 was then confirmed by multivariate meta-analysis of two independent datasets with several additional clinical endpoints (Supplementary Fig. 1c–e and Supplementary Fig. 2). Interest- ingly, KRT80 was the only reprogrammed Type-II keratin sig- nificantly associated with clinical endpoints in BC patients (Fig. 2d).
De novo SREBP1 drives KRT80 activation. Activation of cell
type specific enhancers has been linked with cancer transcrip-
tional aberration
6,16–18, leading us to hypothesize that de novo
enhancer activation within the TAD structure might control
KRT80 expression in AI resistant cells. We used H3K27ac, an
epigenetic mark associated with gene activation
6,19, to narrow
down the potential KRT80 enhancers (E1 and E2, Fig. 1b). As
expected, E1-E2 activity was only captured in KRT80-positive
cells (Fig. 1b) while E1 enhancer activity analysis predicted a
significant increase in KRT80 positive cells in AI resistant models
(Fig. 1c), in agreement with mRNA and protein analysis (Fig. 1a,
f, g and Supplementary Fig. 3a). 3D meta-analysis from parental
MCF7 ChIA-Pet data strongly suggested that the E1 loci could
contact the KRT80 promoter via enhancer-promoter interactions,
while it excluded the weaker E2 (Supplementary Fig. 3b) sug-
gesting that the 3D interaction is already pre-established in sen-
sitive cells. To test whether E1 drove KRT80 transcriptional
activity in other context, we adapted our recently developed
computational pipeline to measure the relative size of KRT80-
positive clones in several tissues
6. This pipeline can estimate the
percentage of cells containing an active enhancer, as at individual
loci the epigenetic signal is a function of the number of mod-
ified nucleosomes
6. We thus tested if the estimated size of KRT80
positive cells based on E1 activity in each model is reflected at
the transcriptional level. Analysis of Epigenetic Roadmap data
with associated transcriptional profiles
20strongly suggested that
increasing E1 positivity, predicting for increasing content of
KRT80-positive cells, correlates KRT80 transcription levels (Fig. 3a). E1 activity was also potentially associated with KRT80 transcription in several cell lines (Supplementary Fig. 3c, d). For example, Keratinocytes ranked as the most clonal KRT80 cell type and exhibited the highest KRT80 mRNA levels (Supplementary Fig. 3c, d). Colon cancer HCT116 cells also were predicted to
contain a clonal KRT80 cell population based on E1 activity (Supplementary Fig. 3c, d). On the other hand, E1 predicts only for a small subpopulation within normal cells from the large intestine (Fig. 3a). Interestingly, KRT80 is dramatically upregu- lated during intestine oncogenesis
21(ranked 4th overall as the most significantly upregulated gene in TCGA normal vs. cecum
NR4A1 ATG101 KRT80 C12orf80 LOC283404 KRT86 KRT81 KRT7 KRT83 KRT85 KRT84 KRT82 KRT75 KRT6B KRT6C KRT6A KRT5 KRT71 KRT74 KRT72 KRT73 KRT2 KRT1 KRT77 Resistant
and invasive Endocrine
therapy resistant
RNA-seq from ETR BC cells
MCF7T MCF7F LTED LTEDT LTEDF MCF7
Log2(FPKM)
2 8
a
50,950,000 54,180,000
Type II keratinsTAD Hi-C interaction map (Chr:12)
Non-invasive/untreated
Invasive/resistant
GM12878 10 kb resolution Non-invasive/resistant
d
Cell number (103) 2 3 6 9
0 6 12 18
Time (h)
24 30 36 42 48 Live cell imaging count +E2
–E2
c
Fold enrichment vs. internal negative control 2 4 6 8
MCF7LTED
ChIP-qPCR E1 enhancer
0
MCF7LTED MCF7LTED
*** H3K4me1
H3K27a
H3K4me2
b
KRTs TAD H3K27ac in ETR cellsLTEDT LTEDF MCF7T MCF7F LTED MCF7
chr12:52,304,911–53,120,196
TAD boundary KRT80 680 kb TAD boundary
TSS
E1 E2 KRT7
TSS
NR4A1 ATG101
KRT80 C12orf80 KRT7
KRT80 C12orf80 KRT7
KRT81 KRT86
KRT81 KRT86
KRT83 KRT85
KRT84 KRT82
KRT85 KRT82
KRT75 KRT6B
KRT6B
KRT6C KRT6A
KRT6A
KRT5 KRT71 KRT74
KRT74
KRT72 KRT73
KRT73
KRT2 KRT1 KRT77 5
5 5 5 5 5
MCF7T MCF7F LTED
LTEDT LTEDF MCF7
Single-cell RNA-FISH
f
MCFLTED
e
Single-cell RNA-seqMCF7
MCF7–E2 (48 h)
Normalized expression (tags per cell)
1 2 3
0
n > 2000 p < 1.7e–65
SREBP1 probes KRT80 probes 3 representative fields of view
IB:KRT80
g
MCF10A T47D T47D- LTED
* *
IB:β-actin Cell distribution (~5000 cells)
39.9% KRT80 + 10.8% KRT80 +
Global Type II keratins H3K27ac
RPKM-TAD 0.51
LTEDF LTEDT LTED MCF7F MCF7T MCF7
cancer) strongly suggesting a progressive activation of E1 during colon cancer transformation. E1 also predicts for clonal KRT80 expression in HUVEC cells and HUVEC cells are characterized by strong KRT80 transcription (Supplementary Fig. 3c, d).
Finally, KRT80 E1 activity also correctly predicted strong expression in mammary epithelium cells (Supplementary Fig. 3c, d). Conversely, samples with no E1 activity were found to have no KRT80 transcription (i.e., immune cells and iPS cells). Overall these data strongly link E1 to KRT80 transcription. As E1 enhancers span nearly 12.5 Kb, we performed fine-mapping analysis to narrow down on potential readers. Using our com- putational pipeline, we sought for E1 sub-regions more strongly associated with KRT80 expression in our BC cell lines leading to the identification of a core-region within the E1 enhancer (1.5 Kb) (Supplementary Fig. 3a). This core enhancer showed a clear pattern of activity in actual BC patients
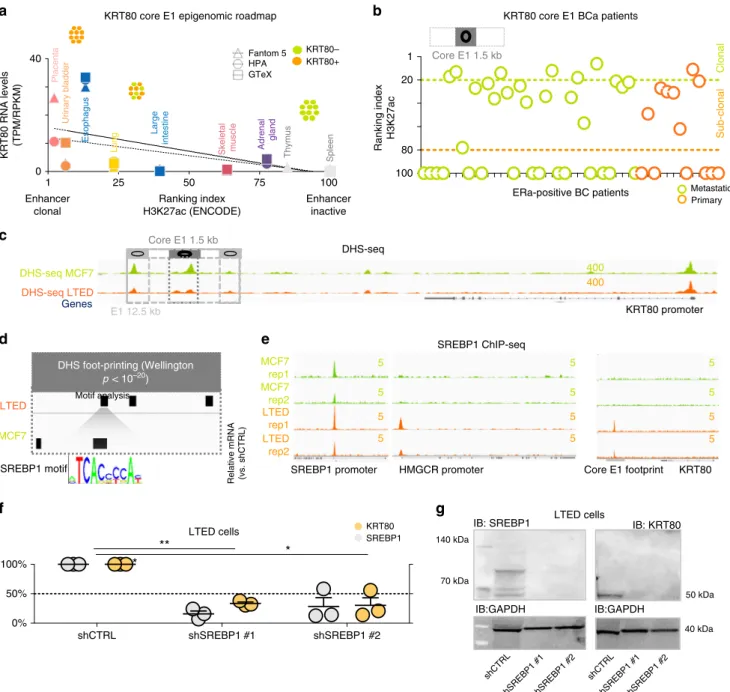
6predicting the existence of KRT80 clonal and sub-clonal populations in primary and metastatic BC (Fig. 3b). We next investigated which transcription factor/s (TFs) might regulate KRT80 expression via core-E1 binding. DHS-seq analysis
7indicated that KRT80 is already accessible in MCF7 (Fig. 3c), yet digital foot-printing suggested different occupancy sites (Fig. 3d). Intriguingly, among other footprints, we noted the appearance of a SREBP1 footprint within the core-E1 unique to LTED cells. We have previously reported that AI resistant cells upregulate lipid biosynthesis via global epigenetic reprogramming
7suggesting widespread SREBP1 acti- vation in AI resistant cells. However, SREBP1 is not differentially expressed in LTED cells when compared with parental MCF7 cells (Fig. 1f), suggesting that SREBP1 might upregulate its targets by increased nuclear shuttling and chromatin binding. This led to the hypothesis that increased SREBP1 occupancy might drive KRT80 transcriptional activation in LTED cells. ENCODE TFs mapping showed that SREBP1 can bind the core-E1 enhancers in lung cancer cells, the only ENCODE profiled cells characterized by strong KRT80 transcription (Supplementary Fig. 4a, b). To directly test if SREBP1 drives KRT80 expression in BC we per- formed ChIP-seq in MCF7 and T47D cells and their respective AI-resistant models. Our data demonstrate that SREBP1 was bound at core-E1 only in AI-resistant BC cells (Fig. 3e and Supplementary Fig. 4c). Interestingly, the expression of KRT80 and SREBP1 target genes was also strongly correlated in BC patients (Supplementary Fig. 4d). Finally, we show that SREBP1 silencing abrogated KRT80 expression in LTED cells (Fig. 3f, g). Overall these data demonstrate an unpredicted link between SREBP1 and KRT80 activation. Phastcons, PhyloP and Siphy rates, which measure the rate of DNA conservation between different species, show a significant drop in conservation
at the SREBP1 footprint within the otherwise conserved E1 enhancer (Supplementary Fig. 5), suggesting that the link between SREBP1 and KRT80 might have evolved relatively recently.
Overall, these data strongly support the hypothesis that the core- E1 is the critical enhancer driving KRT80 expression in BC cells.
KRT80 directly promotes increased tumor stiffness in vitro and in vivo. Several studies have investigated how mechanical stimuli influence the epigenetic landscape
22,23. However, our data implied a novel causal link whereby epigenetic reprogramming promoted changes in specific cytoskeletal components (e.g., KRT80) which may ultimately affect the biophysical properties of cells and tumors
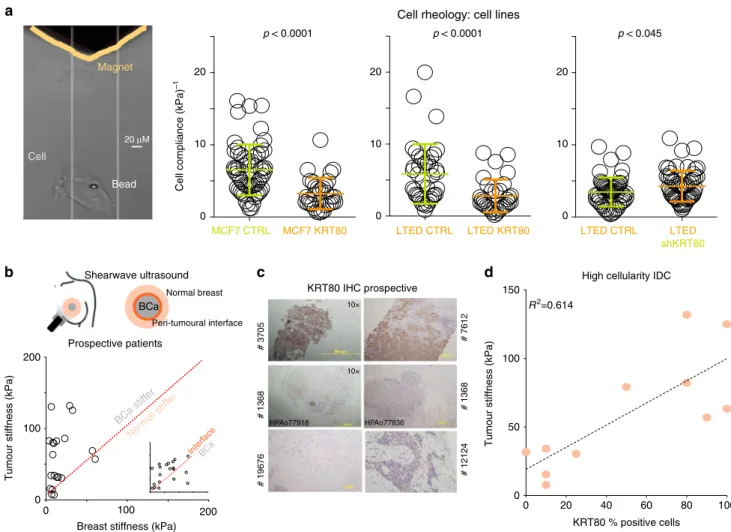
24,25(Figs. 1–3). In agreement, we observed a significant increase in cellular stiffness (inversely correlated to cell compliance/deformability) at the single cell level after KRT80 over-expression in MCF7 and LTED cells (Fig. 4a). Conversely, KRT80 depletion in LTED cells resulted in a significant loss of cellular stiffness (Fig. 4a). To test if KRT80 can contribute to tumor stiffness in vivo we prospectively recruited 20 patients with suspected BC and performed shear-wave elastography to measure intra-tumoral stiffness. Elastography was performed prior to biopsies were taken but all cases were subsequently confirmed positive breast cancer (Fig. 4b). Our data showed that cancer lesions had significantly higher stiffness than surrounding normal tissues, with the highest peak of stiffness consistently measured at the invasive border (Fig. 4b). Interestingly, meta-analysis of tumor and matched nearby tissue from TCGA show increased KRT80 mRNA in the tumor biopsies (Supplementary Fig. 6). We then performed IHC for KRT80 with validated antibodies (Fig. 4c and Supplementary Fig. 7) using biopsies collected from our prospective patients. Linear regression analysis showed that KRT80 positivity significantly correlated with intra-tumor stiff- ness (Fig. 4d). Collectively, these data demonstrate that BCs characterized with high KRT80 content are mechanically stiffer.
KRT80 upregulation leads to augmented collective invasion.
The effect of increasing stiffness in metastatic invasion is highly debated. Previous studies have suggested that decreased stiffness, through loss of keratins, improves single-cell invasion
24typical of EMT cells. However, solid tumors can also use a myriad of multicellular invasion programs
26collectively termed “collective invasion”. Recent studies have shown that keratins such as KRT14 can play critical roles in collective invasion
27and multi- clonal metastatic seeding
27,28, two processes driving BC pro- gression
27. In addition, a significant body of clinical literature has linked increased breast tumor stiffness to poorer prognosis
27,29–31Fig. 1AI treatment induces KRT80 expression via epigenetic reprogramming.aHi-C 3D interactions in GM12878 cells were analyzed usinghttp://
promoter.bx.psu.edu/hi-c/view.php. Data to derive individual TAD were downloaded fromhttp://chromosome.sdsc.edu/mouse/hi-c/download.html. Bars represent the normalized median change in H3K27ac within the Type II-Keratin TAD compared to the overall change in H3K27ac between parental MCF7 cells (green) and drug-resistant non-invasive (gray) and drug-resistant invasive (orange) counterparts. The bottom heatmap shows the normalized expression of RNA-seq data for protein coding genes within the Type II-Keratin in all breast cancer cell lines.bBird-eye view of the H3K27ac profile of the Type II-Keratins locus. ChIP-seq signal profiles from7are shown across the entire TAD.cTargeted ChIP-qPCR for the E1 enhancer locus using H3K4me1, H3K4me2 and H3K27ac antibodies. Individual biological replicates, mean and SD are shown. Asterisks represent significance at thep< 0.001 level.dLive- imaging cell counts of mate-labeled MCF7 cells grown in presence or absence of estrogen for 48 h. Dotted line represents an ideal stalling dynamic in cell number during the time of the assay. Mean and SD of three independent counts are shown.ePopulation level single-cell RNA-seq data for KRT80 expression are shown. KRT80 was identified in 10.8% of MCF7 cultured in estrogen rich media and in 39.9% of MCF7 deprived of estrogen for 48 h. The distribution of the two set of data was compared using a Fisher exact test. Experiments were run comparing cells within 48 h in absence of major cell division/apoptosis.fRepresentative single-molecule, single cell RNA-FISH for SREBP1 (red) and KRT80 (green) in MCF7 and LTED cells.gKRT80 protein levels in MCF7 and additional independent models of invasive drug-resistant breast cancer cell lines. The asterisk represents an unspecific band.
Acronyms: LTED cells: MCF7 that were long term estrogen deprived; and double resistant; MCF7T, MCF7F, LTEDT, and LTEDF: MCF7 and LTED cells resistant to Tamoxifen or to Fulvestrant respectively; ETR: endocrine treatment resistant; E2: estrogen; TAD: topological associated domain; RPKM: reads per kilobase million; KRT: keratin; SREBP1: sterol regulatory element binding protein 1
a
Quick score
IHC KRT80
Matched biopsies (pre- and post-treatment)
TAM only p= 0.355
Primary Metastatic
H Score
0 300
0 300
c
0 1.0
High Low
METABRIC ER+
n= 1486
n=1013
0 5 10 15 20 25 Time (years)
HR = 1.7 p = 8 × 10⁻⁸
Overall survival
5 yrs 25 yrs.
Follow-up
Progression
Normal breast
Intermediate DCIS High grade DCIS LCIS Invasive
Metastatic lymph node
IDC grade 1 IDC grade 3
Apocrine cyst Fibroadenoma Fibroadenoma DuctLobule
b
d
KRT4 KRT17 KRT19 KRT80 KRT81 KRT86
KRT7
Odds ratio METABRIC ER+ 5 yrs.
Breast cancer expressed KRTs
1 2
Dataset 1-ICL: primary vs. metastatic
matched biopsies Dataset 2-IEO: primary vs. metastatic matched biopsies
Dataset 3-ICL: Diagnostic material from a panel of 80 patients diagnosed with breast-related pathologies
p = 8 × 10⁻⁸
Fibroadenoma Fibroadenoma/2 BenignIn situ
METABRIC ER+
Endocrine treated only
Odds ratio 1 2 3
0 3 2 1
Endocrine therapies
p= 0.014 AI only
p= 0.045
500 μM 100 μM 50 μM
50 μM 25 μM 10 μM
50 μM 500 μM 100 μM
25 μM 50 μM 25 μM
50 μM 50 μM 50 μM
p = 1.9 × 10⁻⁷
p = 3.3 × 10⁻⁶
Fig. 2KRT80 dynamics in treated progressing breast cancer patients.aMatched clinical specimens from breast cancer patients show an increase in KRT80 positive cells following mono-treatment (Dataset 1-ICL: Imperial College London, UK) or sequential treatment with aromatase inhibitors (Dataset 2-IEO:
Istituto Europeo di Oncologia, Milan, Italy). Similar results were not significant in Tamoxifen-only treated patients.bImmunocytochemistry (IHC) analyses show changes in KRT80 protein distribution. KRT80 was imaged using IHC in a series of human samples collected at Charing Cross Hospital Imperial College NHS Trust (ICL London, UK). Tissues were collected to cover a large spectrum of benign and malignant lesions including metastatic samples from Breast Cancer patients. Yellow arrows in the bottom panels highlight cells with KRT80 expanded cytoplasmic staining.cKRT80 expression in diagnostic material has prognostic significance. Analysis were performed on the METABRIC RNA-seq splitting patient in high and low KRT80 expression. Two distinct follow-ups for an additional sub-cohort is also shown (endocrine-treated patients). Floating bars show minimum-maximum and average hazard ratios.
dOther transcribed type-II Keratins in breast cancer samples from METABRIC are not associated with prognostic significance. Floating bars show minimum-maximum and average hazard ratios
and lymph node positivity
27,29,30, independently of changes in extracellular matrix stiffness. We reasoned that a model in which KRT80 upregulation in BC cells leads to increased stiffness and augmented collective invasion might reconcile all these observa- tions. To test this, we developed 3D spheroids from MCF7 or LTED cells and assessed collective invasion (Fig. 5a) after KRT80 manipulation (Supplementary Fig. 8a–d). Spheroids from
KRT80-positive LTED cells could effectively invade intro matrigel matrices whereas stable or transient KRT80 depletion completely abrogated the invasive phenotype (Fig. 5c, d and Supplementary Fig. 8e, f). Conversely, ectopic expression of KRT80 conferred matrix invading capacities in otherwise non-invasive MCF7 cells, even in the absence of chronic estrogen deprivation (Fig. 5b, d).
KRT80 immunostaining showed that KRT80 positive cells d
f
LTED cells
e
shCTRL shSREBP1 #1 shSREBP1 #2
100%
0%
50%
Relative mRNA (vs. shCTRL)
SREBP1 KRT80
b
KRT80 core E1 BCa patientsEnhancer clonal
Placenta Urinary bladder Esophagus Lung Large intestine Skeletal muscle Adrenal gland Thymus Spleen
KRT80 RNA levels (TPM/RPKM) 0 40
1 100
Enhancer inactive
a
Primary Ranking index H3K27ac
100 80 20 1
ClonalSub-clonal
Core E1 1.5 kb
E1 12.5 kb
SREBP1 motif LTED MCF7
DHS foot-printing (Wellington p < 10–20)
SREBP1 ChIP-seq
Core E1 footprint HMGCR promoter
SREBP1 promoter MCF7
rep1 MCF7 rep2 LTED rep1 LTED rep2
5 5 5 5
KRT80 5 5 5 5
5 5 5 5
c
KRT80 promoter DHS-seq MCF7
DHS-seq LTED Genes
Core E1 1.5 kb
DHS-seq
400 400
ERa-positive BC patients Metastatic
*
**
IB: SREBP1
40 kDa 70 kDa
140 kDa
50 kDa IB: KRT80
shCTRL
shSREBP1 #1shSREBP1 #2 shCTRL
shSREBP1 #1shSREBP1 #2 IB:GAPDH
g
KRT80+
KRT80–
Fantom 5 HPA GTeX
Ranking index H3K27ac (ENCODE) KRT80 core E1 epigenomic roadmap
25 50 75
*
LTED cells
IB:GAPDH Motif analysis
Fig. 3De novo SREBP1 binding at KRT80 enhancer drives KRT80.aPredicted KRT80 enhancer clonality (x-axis) and KRT80 RNA levels (y-axis) are plotted for three independent transcriptional datasets (fantom5; HPA, Human Protein Atlas, GTEx, Genotype-Tissue Expression). Epigenetic data were obtained from the ENCODE consortia. Increasing KRT80 enhancer clonality is associated with an increasing number of KRT80 positive cells (symbols at the top, see methods for more details).bEnhancer clonality from H3K27ac data obtained in primary and metastatic breast cancer biopsies. Green dotted line indicates the presence of clonal KRT80-positive lesions. Orange dotted lines predict for KRT80-low lesions. Each circle represents an individual patient. KRT80 clonality was calculated using the core 1.5Kb H3K27ac peak.cOpen chromatin profiling via DHS-seq in MCF7 and LTED cells near the KRT80 locus.
dDigital Foot-printing analysis shows differential occupancy status within the E1 KRT80 enhancer. Footprint were identified using Wellington with ap< 10
−20threshold.eChIP-seq analysis for SREBP1 at the E1 core enhancers in invasive AI resistant breast cancer cells and treatment naive parental cell lines.
SREBP1 canonical target HMGCR locus is also shown. The SREBP1 locus is bound in both MCF7 and LTED and represent the only genomic location with SREBP1 binding in parental MCF7 cells.fStable shSREBP1 silencing in LTED cells using two independent shRNA. Individual biological replicates are shown.
Lines represent means and SD. Asterisk represent significant difference atp< 0.05 after One Way ANOVA with Dunnet’s test.gStable shSREBP1 LTED cells were assessed for SREBP1 and KRT80 protein levels
clustered at the invasive front in LTED spheroids (Fig. 5e and Supplementary Fig. 9a, b), a pattern reminiscent of the leading cells characterized in epithelial tumors during collective invasion
27,28. To confirm that invasion was driven by active motion rather than proliferation at the border of the organoids, we repeated invasion assays using proliferation sensitive live- labeling (Fig. 5f). Labeled cells maintained their invasive prop- erties while KRT80 suppression still blocked invasion (Fig. 5g). As expected, invading cells retained the dye suggesting that they actively moved into the matrigel interface in absence of cell division (Fig. 5h). These data are supported by live-imaging of organoid invasion performed previously in the same cell lines
7.
KRT80 reorganizes cells cytoskeleton to promote lamellipodia formation. Confocal microscopy analyses informed that LTED and MCF7-KRT80 cells presented an intricate network of KRT80 filaments that significantly overlap actin fibers (Fig. 6a, b). This KRT80 network was prominent at the leading edge of cells, usually localized at or annexed to actin-rich lamellipodium-like structures (Fig. 6b, asterisk). Conversely, in KRT80
lowcells (i.e., MCF7 and LTED-shA), KRT80 staining was more punctuated
and mainly observed towards the cell cortex, with border cells presenting strong cortical actin (Fig. 6b, hashtag) and no pro- minent lamellipodia
32. Quantitative analysis of confocal data showed that KRT80 expression was associated with a significant increase of F-actin at lamellipodial structures, with smaller compensating changes at the cell cortex and cytosol depending on the system (i.e., MCF or LTED) (Fig. 6c, d). Importantly, no significant changes were observed in the total F-actin between MCF7/MCF-KRT80 or LTED/LTED-shKRT80 (Fig. 6d). Toge- ther, these results suggest that the generation of a network of KRT80 positive filaments do not affect actin polymerization but rather reorganize the actin cytoskeleton to promote lamellipodia formation. In agreement, cells expressing KRT80 presented a higher proportion of cells with lamellipodia when compared with their KRT80
lowcounterparts (Fig. 6e). Focal adhesion growth and maturation are tightly coupled with the forward movement of the lamellipodium
33, are associated to cell stiffness/cellular tension
29,30, and are particularly relevant in the generation of forces required for migration and invasion in complex settings. In line with KRT80 playing a role in these processes, we observed that KRT80 directly promoted the generation of larger more mature paxillin focal adhesions, with no significant change in the a
Cell compliance (kPa)–1
p < 0.0001
MCF7 CTRL MCF7 KRT80 0
20
10
Cell rheology: cell lines p < 0.0001
LTED CTRL LTED KRT80 0
20
10
p < 0.045
LTED CTRL LTED shKRT80 0
20
10 Magnet
Cell
Bead 20 μM
Normal breast
b
0 100 200
0 100 200
Breast stiffness (kPa)
Tumour stiffness (kPa)
Prospective patients
Peri-tumoural interface Shearwave ultrasound
BCa stiff er
Nor mal stiff
er
InterfBCa ace
0
c
0 100 150
KRT80 % positive cells High cellularity IDC R2=0.614
50 KRT80 IHC prospective
100 80 60 40 20
d
Tumour stiffness (kPa)
10×
10×
HPAo77918 HPAo77836
# 3705# 1368# 19676 # 7612# 1368# 12124
BCa
Fig. 4KRT80 levels are associated with changes in cell stiffness.aMagnetic tweezers (yellow) were used to measure the biomechanical properties of individual cells with or without KRT80 manipulation. Changes in cell compliance (deformation) were measured in KRT80 over-expressing cells for both parental MCF7 and AI-resistant LTED cells (left and middle graphs). Changes in cell compliance (deformation) were measured after stable KRT80 depletion in LTED cells (right graph). Significance was calculated with a studentt- test and reported.bShearwave Ultrasound measurements in prospectively recruited patients. Measures were collected at three independent location for each patient (see diagram). Plots show matched tissue stiffness for cancer vs. normal (large panel) and peri-tumoral interface vs. cancer (small inset).cKRT80 cells in diagnostic material from prospective patients assessed with ultrasound were counted using IHC.dPlots show matched tissue stiffness against the percentage of KRT80-positive cells for each individual patient. Simple linear regression was applied to calculate the correlation coefficient between these two values
number of focal adhesions per cell (Fig. 6f). Interestingly, KRT80 positivity strongly characterized invading cells from prospectively collected pleural effusion from AI-treated patients (Supplemen- tary Fig. 9c)
33,34.
KRT80 drives cytoskeletal changes involved in migration and invasion. To test if KRT80 manipulation drives ancillary
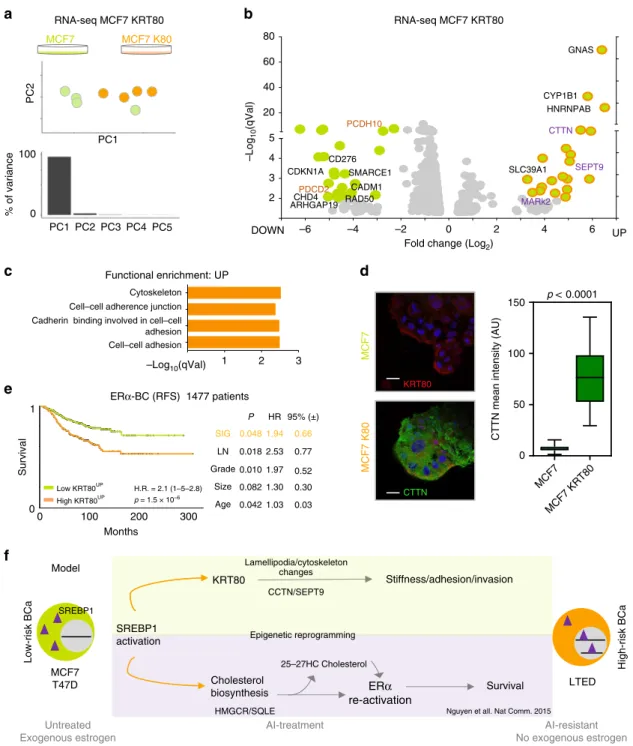
phenotypes synergistic to cytoskeletal changes, we performed RNA-seq in cells transfected with KRT80 but where SREBP1 is not yet activated (non-invasive MCF7 cells, Fig. 7a). Ectopic KRT80 expression led to clear transcriptional differences domi- nated by the reprogramming of a small set of genes (Fig. 7a, b and Supplementary Data 2). Pathway analyses of upregulated genes pointed out to cytoskeletal rearrangements (Fig. 7c and
– + – +
a
Hanging drop
Day 0 Matrigel
embedding
Day 2
Day 0Day 2
MCF7
KRT80 DKK- tagged
Fold change (area)
LTED shKRT80A
LTED LTED
shKRT80B 0
2
1
d e
KRT80 DAPI
IF: LTED spheroid 3D invasion assay
c
KRT80 manipulation LTED
4 days
Cell hanging drop
Spheroid formation
2 h 72 h
MCF7 LTED
shCTRL
LTED shKRT80A 3D invasion assay CMFDA
Non-fluorescent spheroids
Embedding in matrigel Spheroid invasion
Cell division
Fluorescence Dye entrap
Dye diffusion
fluorescent spheroids
(517 nm)
+CMFDA
3D invasion assay CMFDA
0 h 72 h 0 h 72 h 0 h 72 h
CMFDA CMFDA CMFDA
f g
h
Fold change area (day 2/day 0)
0 1 2 3 4
MCF7 LTED
shKRT80A 3D invasion assay CMFDA
KRT80 overexpression LTED
–
Day 0Day 2
shKRT80
b
KRT80 depletion+shA +shB
Fold change (area)
0 6
MCF7 MCF7 KRT80 O.E.
LTED KRT80 O.E.
LTED 3D invasion assay: quantification
KRT80 depletion KRT80 overexpression
LTED shCTRL
**
*
*
*
*
*
**
Supplementary Data 2). Amongst them, we found particularly striking the strong KRT80-dependent induction of cortactin (CTTN), a factor directly linked to actin rearrangements, lamel- lipodia formation and cancer cell invasion
34,35, that we confirmed by immunofluorescence (Fig. 7d). In addition, we also detected a significant upregulation of SEPT9, a member of the septin family directly linked to actin fiber formation, focal adhesion matura- tion, and motility
36,37(Fig. 7b). Genes activated in response to KRT80 upregulation have prognostic value, even when other classical clinical features are considered (Fig. 7e). These data parallel KRT80 prognostic features and hint that these genes might underlie early metastatic invasion (Fig. 7e). We also observed that several genes negatively regulated by KRT80 induction play central roles in cancer biology including negative regulators of migration (PCDH10, CADM1), tumor suppressors such as CDKN1A and PDCD2, genes involved in DNA repair (RAD50), chromatin remodelers as SMARCE1 and CHD4 and tumor specific antigens (CD276) suggesting a direct link between cytoskeletal reprogramming and several other oncogenic pheno- types (Fig. 7b). Together, these results further support that KRT80 manipulation is sufficient to activate genes driving dra- matic cytoskeletal rearrangements that ultimately induce invasive behaviors in BC and poorer prognosis. We cannot speculate at the moment if this is driven by a cytoskeleton-transcriptional feedback or it is mediated by some specific transcriptional factors.
Discussion
The relationship between drug-resistance and phenotypic repro- gramming in breast cancer has not been studied in detail, as generally the focus has been on characterizing the mechanisms of resistance rather than the associated changes in traits that might possibly play a role in shifting cancer cell behaviors. Furthermore, it is known that aberrant cytoskeletal architecture characterizes tumor cells and it is associated with cell migration and invasion;
yet the endogenous and exogenous triggers underlying cytoske- letal reorganization in tumor cells are not well understood. Here, we have uncovered a novel and causal link between endocrine therapy resistance, intra-tumoral stiffness and augmented inva- sive potential in luminal BC (Fig. 7f). Our data strongly suggest that therapy plays a direct role in shaping the biophysical prop- erties and invasive potential of cancer cells, by inducing epige- netic rearrangements leading to KRT80 upregulation and concomitant cytoskeletal reorganization. Our data strongly sug- gest that SREBP1 is the link between drug-resistance and cytos- keletal reprogramming. Upon long-term AI treatment, SREBP1 mediates the activation of pro-survival pathways
7by promoting the cell-autonomous production of endogenous ERα ligands. In addition, SREBP1 is also recruited at the KRT80 enhancer, a non- canonical SREBP1 target, leading to KRT80 transcription in drug- treated cells. This mechanism does not appear to be promoted by absolute changes in SREBP1 abundance, but rather by enhanced
chromatin binding. Furthermore, it is important to note that our data demonstrate that SREBP1 is essential but might not be sufficient for KRT80 activation. How SREBP1 is capable to sense AI-mediated stress needs to be worked out mechanistically, but overall these data support SREBP1 as a potential target to antagonize BC progression. We also describe an unexpected role for intermediate filaments in promoting cancer cell invasion by showing for the first time that KRT80 promotes actin cytoske- leton rearrangements. These are characterized primarily by the formation of lamellipodia and mature focal adhesions, which are critical structures required for migration in complex environ- ments
33. Our data might also reconcile some previous observa- tions that were in an apparent contrast. Few clinical studies have highlighted that stiffer BC lesions do carry worse prognosis
27,29–31, while others suggested that EMT-like processes, necessarily decrease intracellular stiffness, are needed for tumor progression.
The link between treatment, KRT80 activation and increased stiffness would fit with several of these observations, especially in the light of collective-invasion phenotypes observed for ERα- positive BC cells
27,28. Larger longitudinal clinical studies mea- suring stiffness and KRT80 activation in endocrine neoadjuvant- treated patients are needed and should be linked to long-term monitoring for distal relapse.
A directional link between epigenetic and cytoskeleton repro- gramming was not described before and it offers an intriguing axis for drug development and biomarker discovery, especially within the goal of preventing metastatic invasion in BC patients treated with aromatase inhibitors.
Methods
Cell lines and cell culture. All cell lines used in the study were karyotyped and validated and no cell lines from the ICLAC database were used. In this study we used MCF7 breast adenocarcinoma cell line and derived resistant clones (Sup- plementary Fig. 1). MCF7 Tamoxifen Resistant cell line (MCF7T) was derived from MCF7 upon one-year treatment with Tamoxifen. MCF7 Fulvestrant Resistant cell line (MCF7F) was derived from MCF7 upon one-year treatment with Fulvestrant.
LTED (Long Term Estrogen Deprivation) cell lines were derived from MCF7 cell line upon one-year estrogen deprivation, mimicking aromatase inhibitor resistance.
LTED Tamoxifen Resistant cells (LTEDT) were derived from LTEDs upon one- year Tamoxifen treatment. LTED Fulvestrant Resistant cells (LTEDF) were derived from LTEDs upon one-year Fulvestrant treatment38,39. In addition, we employed an alternative aromatase inhibitor resistant model: T47D breast adenocarcinoma cell line and T47D-LTED. The latter was derived from T47D parental upon six months of estrogen deprivation. MCF7 and T47D breast cancer cell lines were cultured in DMEM (Sigma-Aldrich) supplemented with 10% FCS (Fetal Calf Serum, First Link UK), 2 mM L-Glutamine, 100 units/mL penicillin, and 0.1 mg/
mL streptomycin (Sigma). MCF7 were further supplemented with 10-8 M Estradiol (Sigma). Estrogen-deprived cell lines (LTED, LTEDT, and T47D-LTED) were cultured in phenol-red free DMEM (Gibco, Life Technologies) supplemented with 10% DC-FCS (Double Charcoal stripped Fetal Calf Serum, First Link UK) and 2 mM L-Glutamine, 100 units/mL penicillin, and 0.1 mg/mL streptomycin (Sigma- Aldrich). LTEDT were further supplemented with 10–7 M Tamoxifen (SIGMA).
All cells were tested for mycoplasma contamination using MycoAlert mycoplasma detection kit Assay Control Set by Lonza (LT07-518) following manufacturer’s instructions.
Fig. 5KRT80 directly promotes cell invasion.aDesign of the 3D invasion assay. Organoids were derived from treatment naive (green; MCF7) or invasive AI resistant (orange; LTED) breast cancer cells. KRT80 expression was manipulated via ectopic overexpression or sh-mediated stable depletion. Organoids were embedded in Matrigel and monitored for 48 h.bRepresentative brightfield images of KRT80-manipulated organoids. Panels show results obtained in KRT80 depleted cells.cRepresentative brightfield images of KRT80-manipulated organoids. Panels show results obtained in KRT80 over-expressing cells (DKK-tagged KRT80). Small inset number represent normalized fold area changes of each represented experiment. Bars scale=400μm.dQuantification of the area fold change in organoids overexpressing KRT80 or KRT80 knock-down LTED cells in 3D invasion assay normalized to MCF7 (*p< 0.05, **p<
0.01, Studentttest;n=3 biological triplicates in which at least 4 organoids were measured). Data is presented as mean ± SD.eConfocal microscopy of matrigel embedded invasive AI resistant LTED organoids.fReplication dependent labeling of breast cancer spheroids. Cells were labeled with CMFDA that is converted to its membrane-impermeantfluorescent form by cytosolic esterase to entrap the dye. Active replication can dilute the dye until disappearance within 2–3 cell cycles.gQuantification of the area fold change in organoids treated with CMFDA. Lines represent mean and SD. Asterisks represent significance levelp< 0.05 after Studentttest.hRepresentative images of CMFDA tagged spheroids. Invasive borders are highlighted by dotted white lines. Representative original borders are highlighted by yellow dotted lines. Bars scale=400μm
Generation of stable cell lines. For KRT80 overexpression, a full length KRT80 cDNA clone Myc-DKK-tagged was obtained from OriGene and transformed into DH5αcompetent cells (Invitrogen). Plasmid DNA was isolated using Maxi-Prep Kit (QIAGEN) and transfected in MCF7 and LTED cells using X-tremeGENE 9 DNA Transfection Reagent (Roche) following manufacturer’s instructions.
Transfected cells, carrying Neomycin resistance, were selected with G418 (SIGMA), used at afinal concentration of 1 mg/mL for MCF7 and 0.5 mg/mL for LTED.
Knock-down of KRT80 was achieved by transfection of two different shRNA expression vectors and a scrambled negative control obtained from OriGene. Cells carrying the corresponding construct were selected with Puromycin (Sigma- Aldrich) at afinal concentration of 1 ug/mL for MCF7 and 0.5 ug/mL for LTED cell line. NucLight Red Lentivirus (IncuCyte, 4627) was used to infect MCF7 and generate MCF7 mKate2. Stable and polyclonal cell populations were established after Zeocin selection (300μg/ml).
* *
**
MCF7-K80 MCF7
KRT80 F-actin DAPI Intensity (AU)Intensity (AU)Intensity (AU)
*
*
#
#
Distance from cell edge (μm) F-actin KRT80
KRT80 F-actin DAPI KRT80 F-actin
MCF7MCF7-K80
MCF7
LTED-shCTRL MCF7-K80
LTED-shKRT80A
pPAX F-actin DAPIF-actinpPAX
MCF7 MCF7-K80 LTED-shCTRL LTED-shKRT80A
a
b
c d e
f
250 200 150 100 50 0
0.0 2.5 5.0 7.5 10.0 12.5 250
200 150 100 50 0
0.0 2.5 5.0 7.5 10.0 12.5
Intensity (AU)
250 200 150 100 50 0
0.0 2.5 5.0 7.5 10.0 12.5 250
200 150 100 50 0
0.0 2.5 5.0 7.5 10.0 12.5
Mean F-actin intesity(AU)
100 80 60 40 20 0
MCF7
MC F7
MCF7 MC
F7
MC F7 KRT80
MC F7 KRT80
MC F7 KRT80 LTED shCTRL
LTED shKRT80 A
LTED shCTRL LTED shCTRL LTED shKRT80
A
LTED shKRT80 A
MC F7
MCF7 KRT80 LTED shCTRL
LTED shKRT80 A
LTED shKRT80 B
MC F7
MCF7 KRT80 LTED shCTRL
LTED shKRT80 A
LTED shKRT80 B MC
F7
KRT80 LTED
shKRT80 A Lamellipodia
Mean F-actin intesity(AU)
150
100
50
0
ns ns ns
ns
ns ns ns
*
*
Cortex Cytosol Overall
Cells with lamellipodia (%)
100 80 60 40 20 0
*** *
*
****
Focal adhesion area (μ2) 10
8 6 4 2 0
FA size 12
Focal adhesion per cell
6
4
2
0
FA number LTED-shKRT80B
LTED shC TRL
LTED-shCTRLLTED-shKRT80A
LTED-shCTRL LTED-shKRT80A
Live cell imaging and data analysis. Live cell imaging was performed on Incu- Cyte ZOOM (Essen BioScience) equipped with temperature, humidity and CO2
control. Images were acquired every 6 h with 10× planfluorescence objectives for the proliferation assay. Data were analyzed and plotted using Prism6. Individual cells were counted longitudinally to verify absence/presence of proliferation/
cell death.
TAD analysis. TADs were identified using Hi-C data from IMR90 and H1 stem cells as described in ref.7(http://chromosome.sdsc.edu/mouse/hi-c/download.
html). Acetylation profiles were averaged on each TAD locus and difference in normalized read numbers between TAD loci from MCF7 cells or ET-treated cells were calculated. Difference were expressed in terms of positive or negative ratios and ranked according to increase or decrease acetylation7. The Type II Keratin Locus was identified within the top 5% of TAD which increase acetylation during the acquisition of ET-resistance (comparing MCF7 with LTED cells7). In the current manuscript we have used a similar strategy while comparing MCF7 with all ET derivatives. Actual averaged read number/TAD are now plotted in Fig.1a according to each cell line.
RNA extraction and RT-qPCR. Cells were washed with PBS and harvested using a cell lifter (Corning) in RLT buffer supplemented with 1%β-mercaptoethanol.
Cell lysate was homogenized using QIAshredder columns (QIAGEN) and RNA extraction was performed with RNeasy Mini Kit (QIAGEN) following manu- facturer´s instructions. RNA concentration was measured using a NanoDrop 1000 Spectrophotometer and 0.5–2μg of RNA were retrotranscribed using High Capacity cDNA Reverse Transcription Kit (Applied Biosystems). Quantitative PCR (qPCR) was performed using 2× SYBR GREEN Mix (Invitrogen) and expression levels of each gene were calculated using the 2-ΔΔCt method, normalizing expression levels to 28S transcript.
Protein extraction, quantification, and western blotting. Cells were harvested in 50μL ice-cold RIPA buffer (50 mM Tris- HCl at pH 8.0, with 150 mM sodium chloride, 1.0% Igepal CA-630 (NP-40), 0.5% sodium deoxycholate, and 0.1%
sodium dodecyl sulfate) (Sigma; #R02780), supplemented with 1× protease (Roche;
#11697498001) and 1× phosphatase (Sigma; #93482) inhibitor cocktail. The cell pellet and RIPA were mixed by pipetting up and down, incubated at 4oC for 30 min and vortexed every 5 min. Cell lysates were then centrifuged at 13,000 rpm for 30 min at 4 °C. The supernatants were transferred to a new 1.5 mL eppendorf tube and the pellets were discarded. Protein concentration was measured using BCA Assay Kit (Thermo Fisher) following manufacturer’s instructions. With regard to western blotting, 20μg of protein per sample, were mixed with 4× Bolt sample buffer (Life Technologies; #B0007), 10× Bolt sample reducing agent (Life Tech- nologies; #B0009), ddH2O and heated at 95oC prior to loading. Protein lysate were loaded into BOLT 4-12% Bis-Tris Plus Gel (Life Technologies; NW04120BOX).
The pre-made gel was placed into a mini gel tank (Life Technologies; #A25977) containing 1× Bolt running buffer (Life Technologies). Electrophoresis was carried out at 90 V for 35 min to allow proteins to adequately run through and also until the bromophenol blue dye reached the bottom of the gels. The gels were transferred into a Biotrace nitrocellulose membrane (VWR; #PN66485) using a TE-22 transfer unit (Hoefer GE Healthcare) at 100 V for 90 min. The membrane was incubated in blocking buffer for 45 min at room temperature to reduce non-specific binding of primary antibody. The membrane was then incubated with the diluted primary antibodies (Anti-KRT80 for cell lines characterization from12, Anti-KRT80 for shRNA and IHC from HPA 077836 and 077918, Atlas Antibodies (1:200 dilution), Anti-SREBP1 H-160 sc-8984 Santa Cruz Biotechnology (1:200 dilution), (Guinea Pig Anti-KRT80 1:5,000; Mouse Anti-DKK 1:1,000, OriGene; Mouse Anti-β-Actin 1:10,000) in blocking buffer at 4oC and allowed to shake overnight. After primary antibody incubation, the membrane was washed three times in PBST (5 min per
wash on a rocking platform) and then incubated for 1 h with the HRP-GAPDH (Abcam; #ab9482 (1:5000 dilution)) conjugated antibody (for the loading control membrane) which was diluted in 5% BSA/PBST and goat anti-rabbit IgG (H+L) Cross Absorbed secondary antibody, HRP 1:20000 dilution (ThermoFisher Sci- entific; #31462). The membranes (including the loading control membrane) were washed three times in PBST. Amersham ECL start Western Blotting Detection reagent (GE Healthcare Life Sciences; #RPN3243) was used for chemiluminescent imaging using the Fusion solo (Vilber; Germany) imager.
Chromatin immunoprecipitation (ChIP). For ChIP, cells werefixed with 1%
formaldehyde for 10 min at 37 °C and reaction was quenched with 0.1 M glycine.
The cells were subsequently washed twice with PBS after which they were lysed in lysis buffer (LB) 1 (50 mM HEPES-KOH, pH 7.5, 40 mM NaCL, 1 mM EDTA, 10% glycerol, 0.5% NP-40, 0.15% Triton X-100), for 10 min, then for 5 min in LB 2 (10 mM Tris-HCl, pH 8.0, 200 mM NaCl, 1 mM EDTA and 0.5 mM EGTA) and subsequently eluted in LB 3 for sonication (10 mM TRIS-HCl, pH 8.0, 100 mM NaCl, 1 mM EDTA, 0.5 mM EGTA, 0.1% Na-Deoxycholate, and 0.5%N-laur- oylsarcosine). DNA was sheared using the Bioruptor®Pico sonication device (High, 10 cycles of 30”on and 30”off) (Diagenode). Sheared chromatin was cleared by centrifugation. Magnetic beads were precoated by adding 10μg of antibody Rabbit-anti-SREBP1 (H-160): sc-8984 (Santa Cruz Biotechnology, Inc.); Rabbit- anti-Histone H3 acetyl K27 antibody (abcam, ab4729); Rabbit- anti-Histone H3 (monomethyl K4) antibody (abcam, ab8895); Rabbit- anti-Histone H3 (dimethyl K4) antibody (abcam, ab7766) to 50μl magnetic beads per ChIP (Dynabeads protein A, Life technologies) and incubated for 6 h on a rotating platform at 4 °C.
Diluted sheared chromatin was added to the coated magnetic beads and incubated on a rotating platform at 4 °C O/N. Ten microliter of sheared chromatin taken as input and treated the same. The next day magnetic bead complexes were washed three times with RIPA buffer (50 mM HEPES pH 7.6, 1 mM EDTA, 0.7% Na deoxycholate, 1% NP-40, 0.5 M LiCL) and two times with TE buffer (10 mM Tris pH 8.0, 1 mM EDTA). DNA is O/N eluted from the beads in 100μl de-crosslinking buffer (50 mM Tris-HCl, pH 8.0, 10 mM EDTA, 1% SDS) at 65 °C. After overnight de-crosslinking, DNA was treated with 2.7μl of 1 mg/ml RibonucleaseA (RNaseA) for 30 min at 37 °C and subsequently incubated with 1.3μl of 20 mg/ml proteinase K (Invitrogen) for 1 h at 55 °C. Then DNA extraction was performed using SPRI magnetic beads (Beckman Coulter, B23318). After elution in TE buffer, DNA was quantified using Qubit (ThermoFisher Scientific; Qubit 3.0 Fluorometer; #Q33216) high sensitivity assay (ThermoFisher Scientific; #33216). Quantitative polymerase chain reaction (qPCR) was then carried out (Applied Biosystems; #7900HT Real time PCR, #StePOnePlus). If sufficient enrichment is seen in the antibody treat- ment samples over the‘input’samples and compared with internal negative con- trols, these undergo DNA size selection and library preparation.
Library preparation and ChIP-seq data analysis. Prior to sequencing, ChIP samples were library prepared using the NEBNext Ultra II DNA Library Prep Kit for Illumina (New England Biolabs, NEBNext Ultra II DNA library prep kit for Illumina, #E7770, NEBNext Multiplex Oligos for Illumina, #E7335L). Adaptor ligated DNA was size selected with SPRI magnetic beads (Beckman Coulter, B23318) which aims to retain DNA fragments between 200–300 base pairs (bp), recognizable for the Illumina sequencer (#NextSeq500). After library preparation, we performed qPCR, high sensitivity DNA quantification and size selection mea- surement (Agilent Bioanalyzer 2100 system+High sensitivity DNA measurement assay; 5067–4626) before sending samples for sequencing. Raw sequencingfiles processed by the Illumina NextSeq500 sequencer were obtained in“FASTQ”for- mat. The raw sequencingfiles were then aligned to the genome using Bowtie 1.11 short reads sequence aligner using the human reference genome 19 (Hg19) as the reference genome. The output of Bowtie 1.1.1 is the“SAM”file extension format, for both input (control) and ChIP samples, which were then used by Fig. 6KRT80 induces invasion-associated cytoskeletal changes.aRepresentative confocal microscopy images showing F-actin (magenta), KRT80 (green) and DAPI (blue) staining of MCF7-control, MCF7-K80, LTED-control and LTED-shacells. Scale bars represent 25μm.bZoom-up magnifications of areas indicated ina, showing F-actin (magenta), KRT80 (green) and DAPI (blue) staining in cells located at the border of clusters. Single channel images for F- actin and KRT80 are also shown. Scale bars, 10μm. Asterisks indicate lamellipodia-like structures in MCF7-K80 and LTED cells, and hashtags indicate cortical actin areas in MCF7 and LTED-shacells. Graphs on the right show line scan analysis for F-actin and KRT80fluorescence across the leading edges of cells, as indicated in the broken line in the merged images.c,dGraphs show quantification of F-actinfluorescence intensity at lamellipodial regions (c) and at cell cortex, cytosol and overall (i.e., whole cell) (d) in MCF7-control, MCF7-K80, LTED-control and LTED-shacells (n=19, MCF7;n=20, MCF7- K80; n=14, LTED;n=16, LTED-shaindividual cells).eGraph shows quantification of percentage of cells with clear lamellipodia and membrane ruffles in MCF7-control, MCF7-K80, LTED-control, LTED-shaand LTED-shbcells (n=8, MCF7;n=12, MCF7-K80;n=12, LTED;n=7, LTED-sha;n=6, LTED-shb fields of view).fRepresentative confocal microscopy images showing F-actin (magenta), pY118-Paxillin (green) and DAPI (blue) staining of MCF7-control, MCF7-K80, LTED-control, LTED-shaand LTED-shbcell. Scale bars, 25μm. Graphs show quantification of individual leading-edge focal adhesion size (left) and number of adhesions per cell (right). Focal adhesion size (n=269, MCF7;n=251, MCF7-K80;n=257, LTED;n=331, LTED-sha; n=276, LTED-shb).
Focal adhesion number (n=20, MCF7;n=20, MCF7-K80;n=20, LTED;n=20, LTED-sha;n=20, LTED-shb, individual cells). Statistical analyses were performed using one-way ANOVA with Tukey’s post-test. Floating bars and lines represent mean, inter-quantile distribution and SD. Asterisks represent significance at *p< 0.05, **p< 0.01 and ***p< 0.001 levels
Model-based analysis for ChIPSeq (MACS) version 1.42 for peak calling; with all peaks called at a Q-value cut-off of 10−3and default settings applied. MACS outputs result in“BED”file format and“WIG”files.
Digital footprinting. Data from digital footprint were obtained from7. Briefly, DHS-seq libraries were analyzed using Wellington40with the following parameters:
-fdr 0.01 -pv“−5,−10,−20,−30,−50,−100”, using the DHS called using MACS v1.4 with a threshold of 1e−10.
RNA sequencing and single cell RNA-seq. Total RNA from each sample was quantified by Qubit®Fluorometer and quality checked by Agilent Bioanalyzer® RNA 6000 Nano Chip. All samples have high quality RNA with a RIN score > 7.
One microgram of total RNA from each sample was used as starting material for paired-end RNA-seq library preparation using NEBNext rRNA Depletion Kit (NEB #E6310) and NEBNext Ultra II RNA Library Prep Kit for Illumina (NEB
#E7770) following the manufacturer’s instructions. Libraries were sequenced on an
f
SREBP1 activation
KRT80 Stiffness/adhesion/invasion
Cholesterol biosynthesis MCF7
T47D
Low-risk BCa High-risk BCa
ERα re-activation
Survival Model
Untreated Exogenous estrogen
AI-resistant No exogenous estrogen
Endogenous ligands Epigenetic reprogramming
AI-treatment Lamellipodia/cytoskeleton
changes CCTN/SEPT9
HMGCR/SQLE
LTED
d a
MCF7 MCF7 K80
PC1 PC2 PC3 PC4 PC5 0
100
% of variance
c
MCF7MCF7 K80
KRT80
CTTN
PC2
PC1
–Log10(qVal)
Fold change (Log2)
0 2 4 6
–6 –4 –2
2 3 4 5 20 40 60 80
GNAS
b
RNA-seq MCF7 KRT80DOWN UP
CYP1B1 HNRNPAB
CTTN
SLC39A1
MARk2 CDKN1A
RAD50 CD276
CHD4
SMARCE1
ARHGAP19 PDCD2
PCDH10
CADM1
SEPT9
Functional enrichment: UP
1 2 3
Cytoskeleton Cell–cell adherence junction Cadherin binding involved in cell–cell adhesion Cell–cell adhesion
–Log10(qVal) ERα-BC (RFS) 1477 patients
e
0 100 200 300
Months 0
1
Survival
H.R. = 2.1 (1–5–2.8) p = 1.5 × 10⁻⁶ Low KRT80UP
High KRT80UP
CTTN mean intensity (AU)
0 MCF7
MCF7 KRT80 50
100
150 p < 0.0001
Nguyen et all. Nat Comm. 2015
RNA-seq MCF7 KRT80
SREBP1
25–27HC Cholesterol SIG
LN Grade
Size Age
P
0.018 0.010 0.082 0.042 0.048
HR
2.53 1.97 1.30 1.03 1.94
0.77 0.52 0.30 0.03 0.66 95% (±)
Fig. 7KRT80-changes induce transcriptional changes of cytoskeletal genes.aPCA analyses of RNA-seq profiled MCF7 breast cancer cells or MCF7 cells with ectopic expression of KRT80.bVolcano plots of over-expressed or under-expressed genes in MCF7 cells following KRT80 ectopic expression. For a complete list, see Supplementary Data 2.cFunctional enrichment for upregulated genes following KRT80 ectopic expression.dRepresentative confocal microscopy images showing F-actin (magenta), cortactin (CTTN, green) and DAPI (blue) staining of MCF7-control and MCF7-K80 cells. Scale bars represent 25μm. Graph shows meanfluorescence intensity of cortactin in MCF7-control and MCF7-K80 cells (n=40, MCF7;n=4, MCF7-K80 individual cells).eKaplan-Meier plot of ERα-positive breast cancer patients dichotomized to average high or low expression for genes upregulated in response to KRT80 over-expression (Panelb). Multivariate statistics are shown on the right inside table.fCurrent model: long-term AI treatment promotes constitutive activation of SREBP1 leading to pro-survival re-activation of estrogen receptor12, and global cytoskeletal re-arrangements. Cytoskeletal re- organization leads to direct biomechanical changes and promotes pro-invasive behavior