CRUDE OIL STOCK MARKET TREND REVERSAL FORECAST BASED ON WALL STREET JOURNAL
ARTICLES WITH KEYWORD INDICATION
Akos Barta 1*, Mark Molnar 2
1 PhD student, Doctoral School of Business Management, Hungarian University of Agriculture and Life Sciences, Hungary
2 ELTE Faculty of Economics, Department of Comparative Economics, Budapest, Hungary https://doi.org/10.47833/2021.3.ECO.005
Keywords:
oil price
Wall Street Journal forecasting
keyword research trend reversal Article history:
Received 30 Oct 2021 Revised 15 Nov 2021 Accepted 22 Nov 2021
Abstract
The research aims to find correlations between articles in the Wall Street Journal (WSJ) and oil price change. Exactly how much the WSJ induces, how much impact it has, or how much it predicts future trend reversals. Current speculative trading and the willingness to buy or sell following certain events have a decisive influence on stock market prices. In the case of oil, we cannot talk about purely speculative pricing, but its sensitivity to market processes and the decisions of market participants, and possibly only possible decisions, is indisputable. In this way, we search for and determine correlations based on the above.
1 Introduction
Crude oil is one of the most sought-after products in the world, so changes in oil prices have a major impact on macroeconomic activities, and this impact has a fairly large body of literature and analysis.[2][6][15] The frequency and extent of oil price volatility has been steadily increasing since 2004. [7][10]
There is a very broad consensus that unexpected high and persistent oil price volatility is detrimental to the economies of both oil-importing and oil-producing countries, and accurate forecasts of oil prices are calculated. Central bank and private sector forecasters consider oil prices and price volatility, as well as the unpredictability of volatility, to be one of the most important unknowns in making macroeconomic forecasts and assessing macroeconomic risks. Of particular importance is the extent to which oil prices help predict recessions. Several pieces of evidence and studies are known that the recession at the end of 2008 was amplified and preceded by the economic slowdown in the automotive industry and deteriorating consumer sentiment. [5][9]
There are countless theoretical approaches to modeling oil prices. Two main categories of future estimation of crude oil prices are known. The first category includes classical statistical and econometric techniques, including the exponential smoothing model (ESM), linear regression (LinR), autoregressive integrated moving average (ARIMA), generalized automatic regressive conditional heteroskedasticity (GARCH), random walk (RW) and error correction models (ECM). Statistical methods are limited in some respects, so several new prediction methods have been developed or used to overcome these limitations, such as artificial intelligence (AI) models with powerful self- learning capabilities, such as artificial neural networks (ANNs), support vector (SVM) and intelligent optimization algorithms such as genetic algorithm (GA) price prediction. [8][14]
Several studies have confirmed that the press, the internet, has something to do with influencing prices. To some extent, exchange rate movements can be predicted and correlated with certain online activities.[4]
* Corresponding author. Tel.: +36 30 905 6396 E-mail address: mail@bartaakos.com
The Search Volume Index, or number of Google searches, inferred exchange rate movements, volatile periods, attempted forecasts, and successfully examined past data. [3][11]
Furthermore, it is important to note that the exchange rate is not only affected by works dealing with classical oil prices. Several studies are known about the impact of the world's leading powers, the decisions and sentences of leading officials, their possible expected and ultimately non-existent decisions on the prices of certain assets and raw materials. The possibility of a state of war and other external threats already have a strong price-adjusting effect on a country rich in raw materials. [1][12]
[13]
2 Method
The main source of data is the daily price of Crude oil and articles published in the Wall Street Journal (hereinafter: WSJ) between 21/01/2010 and 31/12/2020. In the case of the daily price of oil, it was necessary to bridge trading breaks. In the case of WSJ, we can talk about the analysis of nearly 200,000 articles.
2.1 WSJ key and indicator analysis
For WSJ, we looked for keywords in the article before examining the indicator words. That is, we only examined articles that contained at least one of the following:
- oil price - OPEC - WTI - crude oil
Articles that were not found were ignored. The change in the price of oil is a topic affecting the world economy, so almost all actors, and has an impact on the daily lives of the actors, so in the case of the WSJ it can be considered a relatively common topic. The keywords were found in 1.82%
of the articles.
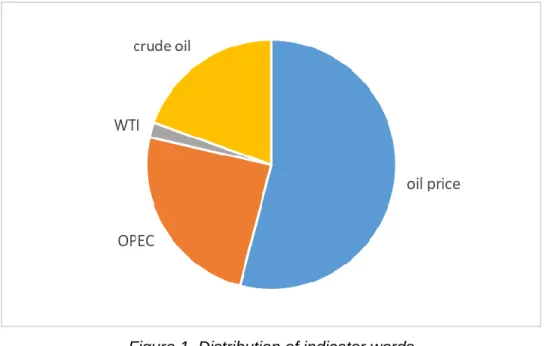
Examining the distribution of indicator words, it can be shown that due to the importance of oil, the articles deal directly with the issue of oil prices, so the examination of indicator words can be done directly. The most common keyword found is "oil price". In addition, "OPEC", whose decisions almost without exception, but most of all its volume decisions, will have a major influence on the future development of oil prices. Furthermore, due to these, it can be stated that the noise effect is presumably disturbing due to the specified keywords, but it is present in a relatively small amount.
Figure 1. Distribution of indicator words
For the items selected in this way, we searched for predefined indicator words, i.e., which could indicate an increase or decrease in oil prices as a result of the report.
Table 1. Summary of the examined indicator words
Words referring to price increases Words referring to price decrease increase
rise rising
grow optimism enhance expensive
climb optimal agreement cooperation
solution deal
bull gain demand
positive
decrease bear
fall low cut dramatically
pessimism emergency recession
collapse negative reduce disagree
decline
The monthly average occurrence of positive words for the indicator words is 104.04 and the max value is 563. In the case of negative words, the monthly average is 105.54 and the max is 703 per month.
The distribution of words that are positive, that is, suggestive of ascension, although not identical, does not show any outliers. Their distribution is even, so no words need to be counted or offset.
Figure 2. Quantitative distribution of positive / rising words
In the case of the negative, that is, the words indicating a decrease in price, very different quantitative results can already be seen. Another question is to what extent these different volumes can be attributed to the reduction in OPEC production quotas, which characterized most of their decisions due to the amount of raw materials consumed. Based on this, and the fact that we do not see a result above 50% for the time being, we do not consider it necessary to conduct a further investigation in this case.
Figure 3. Quantitative distribution of negative / declining words
2.2 Crude Oil price analysis
In connection with the change in the price of oil, our goal is to determine the trends of rising and falling prices, and precisely within that, to precisely define and forecast the turning points. As well as in the present research, the examination and method of predictability of these turning points.
Moving Average Convergence Divergence (MACD) is one of the most reliable and commonly used momentum indicators. Its calculation method is relatively simple: the quotient of two moving averages with different number of periods. Several variants are known, currently the 12-day exponential moving average (EMA) is divided by the 26-day exponential moving average (EMA).
The value of the indicator fluctuates around the value of 1. In most cases, the MACD is calculated by taking the difference between the two moving averages, but in the present exchange case and in the trading method, the percentage shift shows the actual market movements.
The general formula for the Exponential Moving Average (EMA) is:
1
2 2
(1 )
1 1
n oil n
EMA P EMA
T T
The classic formula for Moving Average Convergence Divergence:
12, 26,
n n n
MACD EMA EMA
Instead, based on a more valid analysis of the current problem and the stock market dynamics described earlier, we use the following formula:
12, / 26,
n n n
MACD EMA EMA The Signal line used is the 9-day EMA for MACD:
1
2 2
(1 ) T=9
1 1
n n n
Signal MACD Signal
T T
Also, the Histogram formula used for visual display:
Histogramn MACDnSignaln
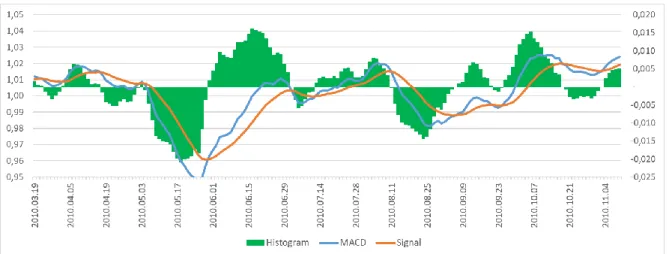
With the described method we can draw the trends, determine the trend turning points in the past, thus examining the period before the trend reversals, looking for correlations between the keywords of the articles and the stock market movement. Exactly in terms of keyword volumes before trend rounds.
Figure 4. Oil price MACD indicator with Signal and Histogram (detail)
3 Results
We examine the period before trend reversals in relation to the occurrence of keywords in the articles, thus trying to find correlations between more / fewer, different types of words at the sample level in the period before the trend reversal.
Furthermore, we also examine how many days before the trend reversal, if a relationship can be found, the trend reversal can be indicated.
3.1 Test 1
We examined the extent to which the words Positive and Negative occur in the period prior to the already known trend reversals. Also, since future estimation is the goal, we also examine False Positive and False Negative.
Examining False results is especially important in this case because a small deviation from the valid value can be misleading and can help determine how sensitive your keywords should be.
Table 2. Pre-trend keyword volume by group
days before POSITIVE NEGATIVE FALS POS FALS NEG
5 1420 1375 1378 1443
10 2741 2277 2885 2596
15 3770 3046 4070 3511
Based on the results of the first test, the actual results are present in a slightly larger number, but the difference is not significant enough, and the false results are present too strongly in these periods.
It is also clear that close enough to the trend reversal, the difference between valid and non- real results is relatively small or non-valid keywords are present, while the proportion of real words increases significantly with increasing period.
Based on the present research, we can state that based on this method, the direction of the trend reversal cannot be clearly detected in this way.
The fact of the trend reversal, or with another examination, its direction is still conceivable.
3.2 Test 2
Examining the quantitative occurrence of keywords before trend rounds, without assuming a bad forecast based on a positive / negative forecast, it is clear that the number is higher than the average occurrence. Or, as we move away from the trend reversal, ie we perform a longer study, the approach to the average can be observed, the difference is getting smaller and smaller.
Table 3. Quantitative average occurrence of keywords with days before trend rounds, or Average occurrence
TRENDS 5 day 10 day 15 day 20 day
AVG/2 3,487490618 3,487490618 3,487490618 3,487490618 BULL 4,068767908 4,066765579 3,910788382 3,730608841 BEAR 4,146551724 3,851632047 3,623323013 3,777133389 For a better illustration, do the same on a chart:
Figure 5. Quantitative average occurrence of keywords with days before trend rounds, or Average occurrence
It is clear from the statement that both positive and negative keywords are present in higher amounts before the trend reversal than in the general case. Also, their numbers are higher than average. Moving away from the trend reversal in a negative direction, the quantitative data decreases significantly. Thus, the relationship is unquestionable. However, the extent of the deviation and the direct effect require further investigation.
3.3 Test 3
The purpose of the next research phase is self-validation, i.e., to examine how questionable the validity of key research is. Thus, we look at keywords only on a quantitative basis and take the average occurrence of keywords as a benchmark.
Figure 6. Quantitative detection of keywords with the examined days before the trend, comparison with the average occurrence
From the statement, we can clearly conclude that the quantitative occurrence of keywords decreases in a negative direction from the trend reversal.
Within a 5-day time interval, it is 17.78% higher than the average incidence. As the time interval increases, the difference from the mean gradually decreases, and when examining a range of about 50 days, it takes on almost the same value.
That is, we can state that there is a relationship before the trend rounds by examining the quantitative occurrence of keywords.
In the course of the research, as mentioned earlier, we try to predict possible trend reversals.
4 Discussion
Based on the studies, it can be stated that the keyword research of the WSJ articles predicts the turnarounds in the price of oil to a certain extent. The relationship can be considered clear in the light of the above statements.
That is, it can be said that by examining the articles of the WSJ, a trend reversal can be predicted. We can state quite accurately that the growth of keywords is getting more and more intense as the trend turns. Thus, even by examining the keywords, a trend reversal event is likely to occur.
The direction of the trend reversal cannot be determined on the basis of the present research.
Based on the research methods described in the study, as well as previous research, we can state that a much more sensitive research is needed to accurately formulate the direction, to predict the trend reversal and the length of trends.
By more sensitive research, I mean a more accurate examination of keywords. Furthermore, the precise definition of keywords using a neural network, the extent to which words were present before trend trends in certain directions. Expanding keywords to key phrases, that is, searching for not only words but also word combinations and sentence details in articles.
Respectively, our research can be further refined by examining not only the fact of the trend reversal in the course of past trend reversals, but also the length of the trend preceding it and the direction of its increase / decrease. During trend reversals, it is necessary to minimize erroneous keyword analysis resulting from volatility.
In light of the above, the relevance of the forecast is unquestionable, and even deeper and more sophisticated research is needed to achieve even more accurate results. The fact of the correlations is known, but their precise definition requires much more sophisticated and weighted keyword and exchange rate history research.
References
[1] Afanasyev, D. O., Fedorova, E., & Ledyaeva, S. (2021). Strength of words: Donald Trump’s tweets, sanctions and Russia’s ruble. Journal of Economic Behavior & Organization, 184, 253–277. doi:10.1016/j.jebo.2021.02.002 [2] Ahmed H.J.A., Bashar O. H. M. N., Wadud I K. M. M. (2012). The transitory and permanent volatility of oil prices:
what implications are there for the US industrial production? Appl Energy, 92. pp. 447–55.
[3] Barta A., Molnar M. (2021). Forecasting oil price based on online occurence volume, MODERN SCIENCE / MODERNI VEDA № 1 - 2021 pp. 5-11., ISSN 2336-498X
[4] Campos, I. Cortazar, G., Reyes, T. (2017). Modeling and predicting oil VIX: Internet search volume versus traditional mariables, Energy Economics, Volume 66, pp. 194-204. doi: 10.1016/j.eneco.2017.06.009 [5] Edelstein, P., Kilian, L., 2009. How sensitive are consumer expenditures to retail energy prices? Journal of
Monetary Economics 56, 766–779.
[6] Ghosh S. (2011). Examining crude oil price-exchange rate nexus for India during the period of extreme oil price volatility. Appl Energy 88(5), pp. 1886–9.
[7] Guo J. F., Ji Q. (2013). How does market concern derived from the internet affect oil prices? Appl Energy 112(12), pp. 1536–43.
[8] Hamdi M, Aloui C. (2015). Forecasting Crude Oil Price Using Artificial Neural Networks: A Literature Survey.
Economics Bulletin 2015; 35(2) pp. 1339-1359.
[9] Hamilton, J.D. (2009). Causes and consequences of the oil shock of 2007–08. Brookings Papers on Economic Activity, vol. 1. Springer, pp. 215–261.
[10] Ji Q, Fan Y. (2012). How does oil price volatility affect non-energy commodity markets? Appl Energy 89(1), pp.273–
80.
[11] Li J., Tang L., Wang S. (2020). Forecasting crude oil price with multilingual search engine data, Physica A:
Statistical Mechanics and its Applications, Volume 551, 124178, doi: 10.1016/j.physa.2020.124178
[12] Oussalah, M., Zaidi, A. (2018). Forecasting Weekly Crude Oil Using Twitter Sentiment of U.S. Foreign Policy and Oil Companies Data. 2018 IEEE INTERNATIONAL CONFERENCE ON INFORMATION REUSE AND
INTEGRATION (IRI), pp. 201–208. doi:10.1109/IRI.2018.00037
[13] Reboredo, J. C., Ugolini, A. (2018). The impact of Twitter sentiment on renewable energy stocks, ENERGY ECONOMICS, Volume 76, pp. 153-169. doi: 10.1016/j.eneco.2018.10.014
[14] Safari, A.,; Davallou, M. (2018). Oil price forecasting using a hybrid model. Energy, Volume 148, pp. 49-58. doi:
10.1016/j.energy.2018.01.007
[15] Uri N.D. (1996). Crude oil price volatility and agricultural employment in the USA. Appl Energy 54(4), pp. 355–73.
[16] Yu L, Dai W, Tang L. (2016). A novel decomposition ensemble model with extended extreme learning machine for crude oil price forecasting. Engineering Applications of Artificial Intelligence 2016; 47: 110-121. doi:
10.1016/j.engappai.2015.04.016