OPERATIONS MANAGEMENT Case study package
TÁMOP 4.1.2.A/1-11/1-2011-0048 project
Demand forecasting process at a multinational company
*The case study focuses on a multinational company in the fast moving consumer goods (FMCG) sector. The company is a leader in the market for household cleaning supplies and a determining factor in the health and beauty care market. They have a presence in the Hungarian market, including a sales office and regional central warehouses for particular cleaning supplies. In this case study, we describe their forecasting and planning process.
At the company, the logistics department conducts demand forecasting and uploads the final demand plan values into the ERP system. Within the logistics department, the demand planner first makes a statistical estimation of the future expected demand and the finished goods inventories that are necessary to serve it.
The expected demand can be divided into two parts: volume sold during the normal course of business (baseline) and additional promotional sales (uplift). Logistics is responsible for calculating the baseline demand, while promotional estimations are the purview of sales. The baseline is calculated by stock keeping units (SKUs) based on weekly average sales data over the last 12 months, excluding promotional elements. The baseline is therefore not the simple average, but the average free of promotional distortions and seasonal fluctuations. The baseline is estimated in a simple Excel spreadsheet by SKU and product group using various methods: exponential smoothing and timeline regression. Thus, the Excel table contains preliminary demand data showing the approximate volume for a given week required by partners for various products if there is no promotion on the given SKU. That is, we can consider this table as containing future standard sales. Next, sales and marketing correct the demand forecasting values with the expected promotional sales volumes.
When estimating promotional sales data or preparing a corrected demand plan for effective operations, the demand planner must continuously cooperate with the marketing, sales and controlling departments. Future promotions, based on inputs from marketing and sales, are built into the demand plan by the demand planner.
Promotions (e.g., packing identical products together, packing different products together, price actions) are planned quarterly at the company. In this case, first the marketing department – starting from the yearly marketing plan – determines the products for action and the timing of image campaigns and estimates the total sales volume (baseline + uplift) by brand and by product within brand. Forecasting by estimating the promotion sales by customers and products is the task of the sales group. Then, after input from marketing, sales estimates the required amount based on information such as how many hypermarket chains are involved, what type of outplacement is planned and what volume they want to sell; they usually also take last year’s promotion volume into account. Furthermore, marketing provides the timing of promotions and their demand- generating impact. All of these elements are allocated to customers by the sales department. That is, sales determines the products intended for sale and the volumes for each customer and each promotion period. To this end, each sales colleague would normally fill in data for each customer in the Excel file, which already
* © BCE Logisztika
contains the baseline data. Sales provides the demand planners with the intended sales volumes by product depending on partner forecasts and other information. This file contains each partner and each SKU. Each sales colleague completes this file for his/her own customers at the SKU level. During demand planning, this
“full product” Excel file shows the expected sales volume by SKU and partner for the normal course of business supplemented by the demand increase due to promotions.
The volumes for various SKUs are summed by the demand planners. Thus, the demand planners know the total forecasted weekly demand for every partner for a given SKU and can calculate how many cases of products are required. Then, demand planners check manually that the maximum number of promotional cases indicated by sales do not exceed the original plans from marketing or, just the opposite, do not fall short of it. It can happen that forecasts summed by customer outdo the total planned promotional volume or the opposite. In this situation, marketing and sales must decide together whether they want to sell promotionally lower or higher amount than originally planned (it also means that even if they maintain their yearly objectives in terms of volume, they will surely diverge from it in value) or maintain the original plan. If the diversion significantly affects the yearly plan, they must also obtain the opinion of the finance department regarding the
“fate” of the promotion, but in practice, finance is usually only informed about the “final result”.
Then, demand planners at the logistics department create the final demand forecast, corrected by the various affecting factors. The corrected forecast is made for 12 months by customer and by SKU in a weekly breakdown. Marketing, sales and logistics representatives review this forecast every Monday on the forecasting meeting, and they supplement and modify it based on new demand or factors, in other words, on the basis of short-term forecast data. The frozen period of the forecast is 6 weeks: the rolling planning data can be modified only from the 7th week on because earlier changes cannot be handled by the factories. One problem, however, is that certain raw materials have a longer purchasing period (reaching up to 12 weeks), so if there is not enough inventory in the regional central warehouses, even these modified plans cannot be accurately followed by factories. A further problem or difficulty in the process is that due to long distances, factory representatives are not present for forecasting meetings. Thus, if data are overwritten in the system by meeting participants, then the demand planners discuss all values between the 7th and 12th weeks with the factories one by one to make sure that they can react to the changes. If the factories cannot adjust, then the demand planners leave the original data in the system, which, however, generates conflicts in their cooperation with sales.
The demand planners upload the Excel file, which contains cumulative data, into the company ERP system;
thus demand information becomes available for the factories. In the ERP system, the factory can see how much inventory is available in the country by SKU, and they can also see the demand forecast in a weekly breakdown. Therefore, the factory can see how many weeks of inventory coverage the company has for a given product. The system automatically indicates when inventory falls below the 3 week safety level (on the basis of the forecast). Then, the ERP system suggests scheduling manufacturing for the given product in the minimum production batch size. Aside from the manufacturing requirement, the factory can also see the distribution centre to which they will have to deliver the manufactured product.
The company measures the accuracy of the demand plan using Mean Absolute Deviation (MAD). According to parent company objectives, the discrepancy between the actual and planned sales volumes is appropriate if it does not exceed the 30% threshold value. Unfortunately, in case of the Hungarian company this objective is not fulfilled: the current MAD level is 40-45%. The high MAD value is a frequent source of conflict between the logistics, sales, marketing and finance departments. Usually, the demand estimation for the promotional periods is the most inaccurate, and the various product variations stemming from frequent promotions highly strain the central warehouse and logistics. Another frequent phenomenon is that demand drops after promotions, so that demand during normal periods is often lower than forecasted. Currently there are two – a regional and a local – projects to improve forecasting accuracy. The local project is trying to improve data by involving key customers in the forecasting process, while the regional project is trying to optimise the inventory levels in the central warehouses. Because the initial results have shown that there is substantial difference in the inventory turnover of various products, they have extended the project over the entire demand management process.
Questions
1. Draw and analyse the demand forecasting process at the company. What type of process management problems can lie behind the demand forecast inaccuracy?
2. Identify the problems during the planning process for promotional and normal demand planning.
3. Give advice to the company. How could they increase demand forecast accuracy?
Pine Furniture Company
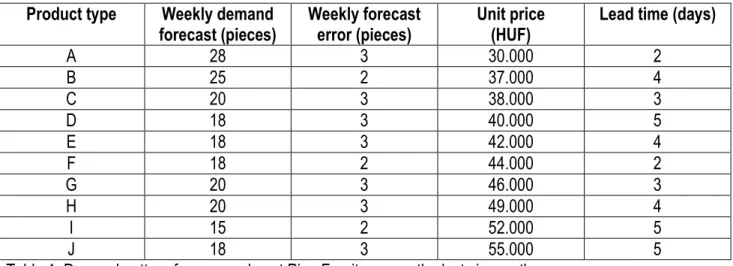
†Pine Furniture Company is a small manufacturing company located in Székesfehérvár, Hungary. It produces wood furniture that is distributed by retailers and wholesalers. The company’s special product is well-designed and practical commodes. The market for wood furniture is highly fragmented, with small players such as Pine Furniture commanding approximately 65% of the market. The factory is also in Székesfehérvár and has a daily production capacity of 50 commodes. However, due to lack of demand, hardly 60% of the capacity was used in the past quarter. Pine Furniture is planning to expand this capacity once it establishes itself in the market, but presently, due to production constraints, the firm is only concentrating on the markets of Hungary and Slovakia. Pine Furniture has appointed 10 distributors in Slovakia and 20 distributors in Hungary to sell its products. These distributors can act as wholesalers as well as retailers. The distributors are expected to sell commodes in the region that they are responsible for. Each distributor can supply as many retailers as possible, but it may not be practical to expect one distributor to supply more than 20 retailers. Distributors are given a discount of 5% by the company, while the retailers usually charge a margin of 15%. These rates are comparable to those of the other competitors in the industry. The gross margin to Pine Furniture from each commode is 25%. However, if the factory is producing with economies of scale, the gross margin is expected to increase another 8-10% because a large share of the manufacturing cost incurred by the company consists of fixed costs. Distributors are given a credit period of 14 days. The factory makes 10 varieties of commode in three different colours. Because the factory produces to order, the 10 varieties are not produced in equal quantities. Most of its commodes are priced less than its competitors, so there is a growing demand for the company’s products in the market. In the last six months, Pine Furniture has observed the following demand pattern for its commodes, as shown in Table 1.
Product type Weekly demand forecast (pieces)
Weekly forecast error (pieces)
Unit price (HUF)
Lead time (days)
A 28 3 30.000 2
B 25 2 37.000 4
C 20 3 38.000 3
D 18 3 40.000 5
E 18 3 42.000 4
F 18 2 44.000 2
G 20 3 46.000 3
H 20 3 49.000 4
I 15 2 52.000 5
J 18 3 55.000 5
Table 1: Demand pattern for commodes at Pine Furniture over the last six months.
† © BCE Logisztika
Order processing is performed manually, and there are two workers responsible for it. The order processing cost to the company is estimated at approximately 3000 HUF/order. Being a small player, the distributors are not highly motivated to spend their working capital to carry inventory for Pine Furniture. Consequently, the company has noticed that at the retailers’ end, many stockouts for some of the most popular models occur.
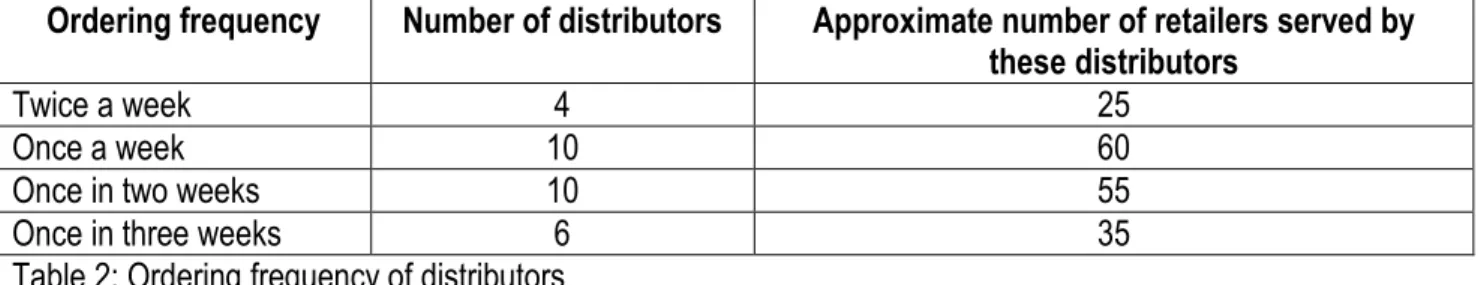
The distributors usually reorder after consolidating orders from their retailers and are generally not interested in carrying minimal inventory. Once the stock reaches the distributor, it is transported to the retailer within a day. It is difficult to estimate the level of inventory held at the retailers’, but because stockouts occur, it is assumed that they do not adequately stock products. Table 2 shows the ordering frequency of the distributors.
Ordering frequency Number of distributors Approximate number of retailers served by these distributors
Twice a week 4 25
Once a week 10 60
Once in two weeks 10 55
Once in three weeks 6 35
Table 2: Ordering frequency of distributors
Due to intense competition, any sales lost due to stockouts are gained by competitors. At the company, it is not possible to reduce the lead time unless more capacity is added at the factory. The lead time consists of
• 1 day for order processing
• 1 day for order preparation and production planning
• 2 to 5 days for production
• 2 days for transportation to the distributor.
Pine Furniture engages a transporter to transport products. The transportation cost is estimated to be 1% of the value of the goods. The transportation cost is covered by the company. The transportation from the distributor to the retailers is the responsibility of the distributor.
Pine Furniture can, of course, reduce manufacturing costs by producing with economies of scale and maintaining a high inventory at its factory. While the company keeps some inventory, it cannot afford to increase this level due to working capital constraints. In a case where the company carries inventory, its inventory carrying cost is forecast to be approximately 25% of the inventory per year. The company feels that if the lead time is reduced, the distributors would be motivated to sell more. The reason for this belief is that although it is impossible to pressure distributors to carry more inventory due to the small size of the company, a shorter lead time would ensure a greater flow of goods through the chain. The improved flow would be advantageous because it would not lead to higher levels of inventory and would certainly reduce stockout incidents. In the present system, when the retailer does not order at the reorder level or if the demand is greater than expected, the retailer may be out of stock for more than 10 days. In this case, customer demand is served by competitors because customers usually will not wait more than 7-10 days for order fulfilment.
7 There are two options facing the company’s management. The first option is to produce to full capacity and stock commodes at two warehouses, one located at the factory in Székesfehérvár to meet the needs of Hungary and another in Slovakia. The second option is to automate the order processing and production planning process by developing the information technology tools in the factory. This upgrade would also require electronic order transmitting methods on the part of the distributors. Both of these processes will increase fixed and variable costs for the company. The first option is also expected to reduce transportation costs because less than truck load (LTL) inventory will now be transported over small distances rather than over long distances as in the previous system.
Questions
1) Depict Pine Furniture’s distribution system. Define the primary players and indicate lead times.
2) What are the fundamental logistical service expectations of the different players?
3) Assess the current customer service performance of the company. Which service dimensions need development and what type of development is needed?
4) Assess the given alternatives. What option should the company pursue and why?
5) How do the different types of distribution costs link to each other?
6) Is there any option other than the two presently being considered?
8
Purchasing at an SME
‡Fair Helena Ltd. is a firm manufacturing cosmetic products. The company was founded in 1992, when the owner started production in a small workshop in her garage. Over the subsequent decades, the company developed into a medium sized firm. Currently, it has 100 employees, and 4 years ago they acquired a new manufacturing facility near Budapest; a new warehouse was also built there. Although the economic crisis affected their market, they managed to keep their sales over 2 billion HUF; however, their profit decreased significantly.
Two years ago Andrea - the owner and manager of the firm - decided to retire. Although the company was able to survive the crisis, something had changed. Since production started in the new plant, the company was not as it had ones been. She used to know everybody, and most of the employees had been selected and hired by her personally. Fair Helena Ltd. was the first job for many of her employees, and Andrea trusted them all. She used to talk to each employee almost every day. After the launch of the new plant, these daily conversations became impossible. Andrea made a final decision after the birth of her grandson that she would leave the leadership to a professional manager. The recommendation of friends helped her to find someone who appeared to fit the position. When she hired him, he was mandated to analyse the current operations of the company and to make suggestions to keep the company financially stable in the short run, improve liquidity, and lay the foundation for growth.
To Andrea's huge surprise, one of his suggestions was to reorganise purchasing. Most of the purchasing decisions had been made by Andrea herself after she agreed on with the area placing the request.. The company's growth eventually reached a point where it was not possible for Andrea to manage everything herself. Therefore, when she was busy, her secretary Jolika (later head of the secretariat) took over the tasks. Gradually, most of Jolika’s work time was spent on purchasing-related tasks. Jolika was a reliable employee who performed her job properly: administration tasks were complete, requests were satisfied on time and there was no doubt regarding her loyalty to the firm.
The new manager insisted on his ideas, and because he was responsible for the profitability of the firm, Andrea endorsed employing a strategic buyer. Peter was hired, and in a few weeks, he reviewed the existing supplier contracts. In his evaluation, he highlighted that the company had many long-term relationships with its suppliers; in these cases, the supplier was being treated as a single supplier. Peter completed some market research for selected products and concluded that in most of the cases, there was more than one supplier; it was possible to generate competition between these suppliers, which could result in substantial savings. Good examples of this potential are stickers (used for labelling jars), plastic jars, and the service contract for dispatching the products. In each case, there were other potential suppliers, and the technologies were standard. In other cases, it might be reasonable to offer long-term contracts, but Peter sees room for improvements. For example, there is a vegetable extract
‡ © BCE Logisztika
9 used as the raw material for a soap that is 100% natural origin. This extract is produced only in South America. The relationship with the South American partner is problematic, personal communication is expensive, and deliveries are often late, resulting in scheduling problems in manufacturing. Peter enthusiastically argued that supplier segmentation and the transformation of the overall purchasing practices will result in significant savings, and in many cases, the more active management of supplier relationships would help to strengthen the company's competitive position. Other ideas included the merging of small ad-hoc items (most of them belonged to Jolika) into framework contracts; e.g., instead of buying pens, folders and copier paper, bids should be requested for office supplies, and instead of toner or cartridges, memory sticks and laptops, a framework contract for IT assets should formulated.
Andrea did not know what to do. When she retired, she had decided not to interfere in the daily affairs of the business. She trusted the manager. However, last week, she received some phone calls from her employees, and all of them were worried about the new purchasing initiatives.
Questions
1. How would you describe the current situation of the company? Please summarise the challenges posed by the larger size of the company.
2. How has growth changed the role of purchasing?
3. Describe the short-term and long-term goals of the owner, the manager, the new buyer, and the head of the secretariat (Jolika)? What types of conflicts can you identify among them?
4. Describe the major spending areas of the company.
5. Find out why supplier segmentation is important. How would you classify the cases mentioned in the text in a Kraljic matrix?
10
Reengineering – the case of BigWash
§New strategic directions
“We’re pretty much going to turn the entire company upside down with this new strategy,” summarised Hunor Nagy, logistics manager, reflecting on the anticipated effects of his company’s new direction. In an environment of changing and ever growing demand, distribution floundered and production failed to properly support commercial goals. For a while, they had hoped that the new production manager would come up with a solution. However, Nikolett Kiss, the new manager appointed to the position six months ago, also could not manage the situation. “Overtime, extra workers – they were all in vain. Our present practice simply doesn’t allow for the flexibility that our sales reps promise and that the warehouses expect. Fortunately, everyone has come to admit that by now,” the production manager said, explaining the need for change. In terms of the future, she said “Currently we’re very positive, because this new system carries the promise of stable and predictable manufacturing operations. We only ask for a couple of weeks, and then we’ll be well-prepared to set it all into motion.” Despite her optimistic words, Nikolett was in fact seriously worried about a number of issues. It will not take longer than a mere couple of days to find out whether she would be able to prepare the production department for the changes ahead.
BigWash in the market for commercial washers
BigWash is a Hungarian-owned company with headquarters located in the countryside. The primary activity of BigWash is the manufacture of commercial washing machines. The company’s market does not stretch beyond Europe, and they typically sell their products to commercial customers. Thanks to their development efforts and strong customer relationships, the company has been able to keep up with fierce competition from the Far East. Flexibility is one of their great strengths – they are very quick to react to specific customer needs. A sizable share of their revenue comes from the sales of two self- developed washing machine models: Speed and Hippopotamus. Given the high level of customer satisfaction, the company will most likely have the opportunity to enter new markets (North America) and to launch new products (e.g., laundry businesses, launderettes). Both of these changes, however, will put further pressure on their production system, which many managers already consider to be the key bottleneck hindering further growth.
Product manufacturing and distribution until now
BigWash operates warehouses in six European countries. The quantities ordered by the warehouses are delivered from the factory twice a week. The warehouses handle and forward orders from the company’s partners in their region and manage stock levels. This system evolved when the factory was founded and has not changed significantly since.
§ © BCE Logisztika
11 As Nikolett recalls, “right from the beginning, production has always been subordinated to this distribution system. For quite a while, the manufacture of large quantities of the primary products based on forecasts ensured a smooth, predictable operation. For a couple of days, we worked on one product, then we changed to another one for the next couple days and so on. This way, we could avoid mixing up parts, and we also had many fewer manufacturing defects. The system has, however, become inflexible with time. Even though that’s been our own bitter experience, we still haven’t really managed to find a new practice yet.”
”In line with the market’s expectations – everyone wants their washers immediately – we usually commit to ship within 1 or 2 days. We have to make tremendous efforts to meet this commitment, and sometimes we still fail. Forecasts relate to total volumes, but the quantities released at any one time vary widely. And it’s pretty hard to make any sense of that. If we strictly kept ourselves to the plans, we’d hardly have any work to do one day, while even substantial overtime hours wouldn’t suffice to meet demand the next day. But the actual quantities released may even differ from these planned figures, which could then leave us high and dry, lacking the necessary quantity of products,” Nikolett said about the situation.
The company’s management is very committed to meeting customer demand: no order can be left unmet! Because of all the last minute, cancelled or postponed orders, the production lines resemble a battlefield. As Nikolett so aptly put it: “Stocks, raw materials, unfinished products lying around all over the place. Each day, our material handlers spend several hours looking for things, workers herd stocks around themselves in case that’s the next thing they might need. And to make things worse, many of the bulky parts we use tend to be rather easily damaged.” The problem was apparent to management, as well. Production plans were being altered constantly due to customer requests and internal constraints.
Because of all the repeated changes and the constant firefighting, “some of our suppliers, too, started to see red in the last couple of months. After all, we’ve kept vexing them, as well. Accordingly, inbound as well as outbound shipments have been anything but predictable.”
The new system: production feeding a supermarket warehouse
The new strategy states that in the future, the factory will ship to a single central warehouse location in Western Europe. Warehouse orders received by noon are delivered by a third-party transport provider by 6 p.m. the next day. The warehouse was designed to function as a so-called supermarket warehouse.
“The supermarket warehouse maintains a predetermined level of stock for our primary products. This stock level ensures that production will surely be in line with customer demand during a given period of, say, one month,” Nikolett said, highlighting the central element of the concept. She also told us about the changes expected in production: “This supermarket idea will most probably improve our manufacturing performance, as we may be able to better cope with fluctuations. Of course, this will require our production planners and foremen to start thinking along new lines in terms of methodology. It might even ease the tension with our purchasing department and our suppliers to some extent. Surely, this requires serious preparation efforts!”
12 For the meeting scheduled for two weeks from now, Nikolett would like to prepare a hand out that would clearly underscore the viability of the new system. She started to work out a levelled production schedule based on data from one of last year’s particularly stressed periods.
Questions
1. Why did the managers regard production as a bottleneck? List the problems that the company’s production manager currently faces.
2. Draw a schematic showing the company’s distribution system (present and planned).
3. What would the levelled production schedule for the individual products look like based on the production plan (Appendix 1: Monthly quantity planned to be delivered to the warehouse)?
4. How would you argue in favour of the new system? What are the advantages of implementing a levelled schedule?
5. How could the company further reduce its stocks in the new system?
Homework assignment: Calculate the levelled production schedule for each product, assuming a planning period of two weeks.
Appendices
Appendix 1. Monthly quantity planned for delivery to the warehouse Machine type /
DAY
1 Sa
2 Su
3 M
4 T
5 W
6 Th
7 F
8 Sa
9 Su
10 M
11 T
12 W
13 Th
14 F
15 Sa
16 Su
17 M
18 T
19 W
20 Th
21 F
22 Sa
23 Su
24 M
25 T
26 W
27 Th
28 F 29 Sa
30 Su
31 M
Speed 200 300 200 400 300 100 200 200 400 600 300 300 400
Hippopotamus 300 300 300 400 400 500 250 300 450 600 500 200 600
Total 500 300 300 500 800 400 800 350 500 200 450 1000 600 800 500 1000
The company only operates on weekdays, and work is performed on a one-shift basis.
Total quantity planned to be delivered of Speed: 3900 pcs; total quantity planned to be delivered of Hippopotamus: 5100 pcs; altogether: 9000 pcs.
Production cycle time is (for both types) 55 seconds.
The company only operates on weekdays; work is performed on a one-shift basis; net working time is 8 hours per day. Daily capacity is 480 pieces (8*3600s/60s) and monthly capacity is 9600 pieces (480pcs*20).
14 Levelled Production Schedule (student template)
Items/DAYS 3
M 4 T
5 W
6 Th
7 F
10 M
11 T
12 W
13 Th
14 F
17 M
18 T
19 W
20 Th
21 F
24 M
25 T
26 W
27 Th
28 F
31 M
Production day 1 2 3 4 5 6 7 8 9 10 11 12 13 14 15 16 17 18 19 20 21
1. Order – ………..
Condition:
Quantity “A” is available one day before delivery.
Total required quantity
“B”. Daily required quantity as based on “A”
“C”. Maximum of “B”
2. “D”. Quantity ordered and met
“E”. Cumulative quantity planned to be
manufactured 3. Stock after delivery 4. Maximum stock
The supply chain of the European Sanitary Company
**The European Sanitary Company (ESC) achieved outstanding performance by bringing nationalities, languages and business cultures together and simultaneously managing these resources. ESC has a wide portfolio of sanitary products in the market. Aside from mass products, the company designs and manufactures unique sanitary goods. According to some estimations, one quarter of the world’s population uses ESC products daily. In recent years, ESC’s supply chain went through a significant transformation. A key feature of this transformation was the establishment of the European Supply Chain Service (ESCS) team. The company’s top managers – including Vanda Smith, CEO of the ESCS team and Reg Gibbon, Purchasing Manager – have been taking part in the last serious meeting before the company Christmas party.
Vanda Smith is proudly describing the structure and activities of the ESCS team and the results. The team consists of three offices. Brighton handles retailers in the UK, Iberia, Benelux, Germany, Austria, Switzerland and Denmark; Klucze serves Poland and the Baltic states; and Prague serves the Czech Republic, Slovakia and Hungary. The team provides country-specific, integrated support along supply chain operations for 16 countries in 14 languages. The new team replaced two former separate departments in Brighton – the customer service team and the European freight management team – that, despite their co-location, were working independently with the resulting inefficiency. The new, integrated team comprises order taking and processing, the communication of customer service processes and finished goods inventory planning.
In the new structure, actual sales data are forwarded by the ESCS team to primarily company-owned manufacturing units. These manufacturing units plan, manufacture, and transport finished products to logistics service providers. The logistics service providers manage finished goods inventories as well as customer-demand warehouse processes and outgoing transportation.
The basic goal of integration has been to provide a higher level of customer service to independent retailers, but Smith claims that due to better communication, the ESCS team can also work more cost efficiently. The team adopts a forward planning mentality, identifying in advance potential issues, finding the most appropriate solutions and planning up to four months in advance. Consistency and standardisation across the integrated country teams in ordering and communication processes has enabled a number of technological improvements. For example, outdated IT systems in Prague and Poland were replaced by more up-to date technological solutions applied in more developed countries.
That shift eliminated several thousands of faxed messages monthly that were previously manually processed.
Reg Gibbon has been thoughtful while listening to Smith’s report. The two managers have been friends for years. This friendship, however, is specific; it also does not avoid professional competition. Therefore, listening to Smith’s results, Gibbon suddenly decides that here, now, before the Christmas party, he will
** © BCE Logisztika
16
also present his own idea. He will present a state-of-the-art proposal that proposes to increase supply chain level performance by harmonising order sizes between factories and key suppliers. Essentially, his proposal is for the ESC manufacturing units to account for not only their own costs but also the costs arising at key suppliers in relation to their orders when the order size is selected. There is an astonished silence after the proposal is finished. Apparently, nobody understands. Finally, after a period of silence, a noise runs through the room. Gibbon knows that his proposal needs some further explanation, and thus he continues.
“I illustrate the essence of my proposal with the following example:
Let’s assume that one manufacturing unit of ESC orders 10,000 pieces of a product in a year from its supplier. The unit ordering cost for the given product and supplier is 100 Euro/order, while maintaining the product inventory is 10 Euro/piece. Let’s also assume that the supplier has a fixed cost of 300 Euro/order (e.g., setup cost) in relation to the ESC order. The supplier does not have inventory costs, because it delivers the product to the assigned logistics service warehouse right after it is finished.
Optimizing the costs related to the given order at both the customer and the supplier can cause significant supply chain level savings”. (Certainly, optimisation, in this case, takes place for a restricted supplier-customer relationship, or dyad).
His explanation is, again, followed by silence. Some stared at him with curiosity and others with incomprehension. Will Reg Gibbon be able to convince his co-managers to accept his suggestion? If yes, under what conditions?
Questions
1. Draw the supply chain map for ESC.
2. Using the map, identify the internal and external supply chain members.
3. Describe the division of labour within the supply chain. What changes did they carry out and why did these changes improve their operating performance?
4. Using Gibbon’s example, calculate the potential savings that can be achieved along the supply chain. Use the EOQ model for this purpose.
5. Under what conditions do you think Gibbon’s proposal for harmonising order sizes can be viable?
17
Value creation in the sewing department – the case of tinyBIG Automotive Parts Ltd
††Process development in reaction to quality issues
At 3 p.m. sharp, the phone rang at the production department of tinyBIG Automotive Parts Ltd, as had been the case every single day lately. Department Head Kende Varga knew that it would be their largest customer, OEM Vehicles Co, on the other end of the line. Since the supply issues began two months before, it had become a daily routine for this customer to verbally inquire about deliveries. The factory supplied OEM with a number of products. Most recently, the seat covers were affected by production issues. In view of the difficulties, they decided two months ago, in concert with the customer, to assess the processes within the company’s sewing department. Kende was extremely doubtful about this “customer-helps-supplier-to-develop” type of project. Among his co-workers, he repeatedly voiced his disapproval: “Sure, someone turns up here from nowhere and within three days, they work out a solution for what we’ve been working on for years?” Given the situation at hand, however, he tried to appear open and cooperative because he was aware the customer would not tolerate another blunder like the last one. In terms of the joint project with the customer, he was worried about the absence of a process development team at the company. Kende entrusted the recently hired young logistics specialist, Andrea Makk, with the preparation for the joint project with the customer: to forestall a potentially embarrassing situation, he asked her to try to explore any deficiencies and to possibly come up with some solution alternatives, as well.
It was clear to Andrea that, given the circumstances at hand, a project like this would be a tough challenge. Nevertheless, at the end of her discussion with Kende, she made a bold proposal: ”As a preparatory step, it would be reasonable to develop a better understanding of our own processes.
During my time with Superb Motors, my team had a number of value stream mapping assignments;
typically, it was the first step in each development project. I’d suggest that in preparation for our cooperation with OEM, we prepare a value stream map of the work done in the sewing department.”
Kende was unsure about the utility and the feasibility of the idea, but he did like Andrea’s determination. He had a high opinion of the young logistics specialist’s work, anyway. He even entertained the idea that if both the preparation and the joint project turned out to be a success, he might set up a process development team, which could, after all, even be headed by Andrea.
Processes – as seen in the gemba
Only a couple of days after their discussion, Andrea set out to assess the processes. From her experience at tinyBIG so far, she knew that the task would require an approach fundamentally different from the usual mentality there: “The first big surprise came right away, during my on-the-job training days: even though ordering materials is part of my job, it didn’t seem to even have crossed anyone’s mind to take me down to the shop floor and explain the processes. To maybe help me to understand
†† © BCE Logisztika
18
how I’ll contribute to value creation. I did, however, go down there a couple of times to take a look at things on my own initiative. I explored the sewing department as well as the metal processing departments. People looked quite puzzled, both my colleagues from the office and the workers on the shop floor. You just don’t do that here. Whereas personal experience and good relations with the production teams would be particularly important because – as it became clear to me, as well, within the first few weeks – we, the office staff, share a blind faith in the IT system. For us, it’s comfortable and convenient to work on the assumption that all pieces of information are correct. But they aren’t, naturally enough. But hey, never mind, we’ll just order a bit more. Or simply put the blame on the worker for poor record keeping. This preparation means an extra challenge because I’ve only recently gained any insight into our metal processing operations.”
In preparation for the process assessment, Andrea strived – in line with her previous experience– to spend most of her time on the shop floor: “Ideally we should’ve set up a multiple-day meeting where all those affected by the process would participate. But we won’t have an opportunity for that until later, when the people from OEM are here. So I instead asked all major interested parties personally. I talked to people from all areas: shipping, final inspection and packaging, assembly, padding, face-stitching and sorting. In accordance with the methodology, I started from the point closest to the customer. I walked through the manufacturing process several times and collected all the data myself. Theoretically, one could have performed lot of this work from the office, too. But when looking at the reports, I often had the feeling they weren’t even about the same plant I’d seen the previous day. And to top it all off, our widely known capacity issues and human inventiveness ensure that inventory discrepancies are quite common and significant. Data I collect myself right on the spot will be far more reliable!”
Logistics department
In keeping with her discussion with Kende, Andrea focused her preparatory work on the product affected by OEM’s latest complaint: seat covers. Being relatively unfamiliar with both the product and the customer, the first person she had a serious discussion with after her first process walk-through was the logistics coordinator who managed customer orders. The team member responsible for seat covers, Adalbert Homonyik, helpfully explained the process: “The customer orders about 16 thousand seat covers each month. The customer ordering process itself is a rather standard one, similar to those of other automotive parts. We receive six-month rolling forecasts for the seat covers. There is an EDI connection between OEM’s system and ours; the two databases are synchronized continuously. The month directly ahead of us is shown in a weekly breakdown. This term is absolutely necessary for capacity planning. Based on the forecasts, we keep generating weekly schedules in the MRP system.
These are then forwarded to all internal departments: among other uses, they serve as a guide for the foreman in directing the main sewing operations. Also, these are what the weekly emails from our purchasing team to FabriCut Ltd, the supplier of the sewing department, are based on. We provide the supplier with weekly plans, and they receive three-month plans, as well, based on the rolling forecasts.
According to the contract in place, the fabric cutter ships raw material on Tuesdays and Thursdays, for 2500 seat covers at a maximum on any one occasion. In preparing the supplier’s schedule, we focus on the quantity ordered by the customer, but in-process inventory and finished goods stock levels are also
19
important, of course. Building upon previous experience, downtimes and defects are taken into account, as well. There is a daily schedule for shipments to the customer. We receive seat cover release orders from OEM on a daily basis – with next day shipment. The customer expects us to have the seat covers delivered by truck, one shipment a day.”
Shipping
On the afternoon of a later, less exhausting day of that week, Andrea visited the shipping department.
On her way there, she kept wondering how seat cover supply problems were even possible. She clearly recalled having heard at last week’s team meeting that the in-process inventory in the sewing department was permanently in the 6000 to 8000 range. She began to understand why some of the managers kept expressing their bewilderment that despite such a high inventory level, the plant still failed to meet the customer’s release orders.
She did not really learn anything new at the shipping department though. From final inspection, the seat covers are transferred to the finished goods storage. From there, they are shipped by truck on a daily basis, consistent with the customer’s expectations. The warehouse operatives who work in shipping even pay attention and load, according to the customer’s wishes, 4 boxes onto a pallet and 50 pieces in one box. The workers also told her, “If there’s a sufficient quantity of products in the finished goods storage, the shipping itself usually runs smoothly. Sometimes it’s hard to find the items, though.
We do have the finished goods, you know, it’s just not at its designated place within storage. Oftentimes, someone brings the seat covers over to storage with a pallet jack, but then doesn’t leave the pallet at the designated place, but somewhere else, in one of the corners, for example. This might have various reasons, for example, the forklift driver may have something more important to do and thus, lacking the time to arrange things, leave something in the middle of the aisle. Or he might simply remove something from the shelf because production will soon need it, and he wants to have it prepared. It also happens, of course, that finished goods pile up on the shop floor, and no one is available to move them.” They had already finished picking and packing that day’s 800-piece shipment; it was waiting to be loaded into the truck.
Having learnt the above, Andrea headed over to the finished goods storage. At the place designated for seat covers, she counted 1,000 pieces altogether. Having walked through the entire finished goods storage area, Andrea found two more pallets at two other locations, with four full boxes on one of them and six on the other.
Final inspection and packaging
A couple of days later, Andrea commenced the assessment of the production area. Although her working hours were almost over, that did not mean she could not proceed with the observation.
Production in the sewing department was generally run on a two-shift basis (2x8 hours). The customer operated on a similar two-shift schedule, as well. In accordance with the regulations, each shift in the plant was allowed a 30-minute break.
OEM expects all their suppliers to strictly keep to the requirements in terms of both quality and quantity. Even the smallest mistake might result in a production disruption in the car factory. tinyBIG also operates a final inspection area. In the sewing department, there is one person in each shift
20
addressing the final inspection and packaging of seat covers. During the afternoon shift, the area was manned by Vencel Toth. On each and every item, Vencel inspected the quality of the materials and the seams, and he then also put the covers into boxes and sealed the boxes. According to Andrea’s measurements, it took Vencel 40 seconds to complete one product and he would start with the next one right away. There was no changeover time at this step. The worker performs a manual task, and he is available 100% of the time. Based on Andrea’s figures, Vencel had already filled 7 boxes (350 pieces) that day. In the area surrounding the station, she found 200 more products that had already been assembled but not inspected.
Assembly
Having completed her review of final inspection, Andrea walked over to the assembly station, only a few meters away. Assembly actually means the completion of some vital, final stitches. At this location, some additional elements are sewn onto the seat covers that have already been sewn together from multiple parts and equipped with the necessary pads. As Maria Piros, the woman who worked here, told Andrea, “we keep working here continuously, don’t ever stop for a second. Just take a look at all those products still waiting to be assembled today. Sometimes, though, we have to go and retrieve the products from various parts of the plant ourselves. There’s always some more products, it’s just that the material handlers sometimes leave it at the wrong place. Look what we have here, 400 pieces, unfinished, the faces already stitched together. I keep begging them, but they just won’t listen…” Based on what she had heard, Andrea kept in mind that pre-assembly products may crop up at other places, as well. Having performed repeated measurements with her stopwatch, she concluded that the assembly operation takes 46 seconds. This workstation, as well, ran on a two-shift schedule. Production was continuous; there was no need for changeovers. As a matter of fact, 400 pieces had already been assembled, and an additional 250 pieces were ready for assembly.
Padding
It was about half past seven when Andrea arrived at the padding process. Padding means the sewing-in of smaller pieces of fabric at predetermined places on the backside of the cover. These thicker pieces of fabric are meant to increase comfort. The workers were having their break at the time, so she could count the inventories undisturbed. Taking into account the diversity of inventories, she decided that this process was a very busy point for the sewing department. A closer look confirmed her observation. It was pre-assembly (already padded) products that she counted the highest number of (300 pieces). Yet she also found some (200 pieces) waiting to be packaged (ready and inspected, but surprisingly not packaged yet), and a number of sets still to be face-stitched (200 pieces). And there was a heap (300 pieces) of covers that had already been face-stitched, too. She measured how long it took for Linda Havas, who had just returned from her break, to complete the padding operation on 10 sets (380 seconds). Under the continuous, two-shift availability condition, changeovers were not necessary here, either. She was now headed to the face-stitching station.
21 Face-stitching
The workers sewing the faces of the covers together were already back from break, deep in their work.
Their job is to sew the faces of the covers, as sorted into sets by the previous station, together. The faces are the main elements of the cover; following this stitching operation, the unfinished product already looks almost like a seat cover. Andrea measured the station’s cycle time to be 62 seconds. This area’s inventories, too, were sufficient to ensure a continuous workflow. Altogether, she counted 200 pieces that already had their faces sewn. Based on the amount of raw material at the workstation waiting to be processed, 300 more pieces were expected. Much to Andrea’s surprise, there was no
“stray material” lying around here. This process worked on a two-shift schedule, as well, and its availability was 100%.
Sorting
It was Adam Hegyes, the man performing the first step in the entire process, who was responsible for arranging the “parts” – that is, the faces – of the seat covers into the correct sets to be released for further processing. Adam’s job was to take one piece from each of a group of articles and forward them as a single set. ”Today, we haven’t had any problems yet. I’m being continuously supplied with the faces. Sewing has also managed to keep up the pace. If only it would be like this each day!” At Adam’s workstation, Andrea counted 350 sorted sets awaiting transfer. When Adam noticed that Andrea was counting the sorted sets, he noted: ”There’s hardly room for more; it’s high time a material handler came and took those sets away. There’s no room here for the sorted sets, because we need it for the raw material. It happened quite frequently, you know, that we couldn’t find anyone in the warehouse to release the raw material. So, even though the bosses don’t know a thing, but we agreed with the foreman that we would store some extra raw material here, as well. We give it back, of course, whenever there’s an inventory count, we make sure of that. It’s important that we have something to work on at all times. Because who do they blame if the stuff isn’t ready? Us, of course, just like the last time…” Ergo, Andrea was not surprised to find raw material worth 1200 sets waiting to be sorted. It took Bernát approximately 23 seconds to complete one set. This workstation, as well, was run on a two-shift schedule, and work was performed continuously, without interruptions.
Raw material
Lastly, one of the material handlers accompanied her to the raw material storage area. The raw materials received from the fabric cutter stood all arranged in neat order. Altogether, in multiple large packages, there was material worth 2300 seat covers awaiting release to production.
Andrea left for home shortly before the end of the second shift. By that time, the current-state value stream map of the seat cover process was practically complete. She was absolutely sure that Kende, too, would be interested to learn about the data.
Assignment: Draw the value stream map for the sewing department.