Introduction
The legitimacy of functional foods is reflected in the changing dietary expectations of consumers. Diets are usu- ally modified by health protection considerations or illness.
“A food can be regarded as ‘functional’ if it is satisfactorily demonstrated to affect beneficially one or more target func- tions in the body, beyond adequate nutritional effects, in a way that is relevant to either an improved state of health and well-being and/or reduction of risk of disease. Functional foods must remain foods and they must demonstrate their effects in amounts that can normally be expected to be con- sumed in the diet: they are not pills or capsules, but part of a normal food pattern” (Anon, 1999, p.S6).
According to Bagdy (2010), health consciousness implies one’s responsibility for the preservation of their personal and bodily integrity, consisting of sound bodily and emotional health based on balanced physical, psychological and interper- sonal relationships. Thus, health consciousness can function as a foundation for subsequent decisions and the elaboration of the respective decision-making criteria. Specific actions are manifested in health-related conduct. Szakály (2011) defined health-related conduct as the sum of all behavioural forms connected with one’s health deduced from health needs and health-related motivations promoting a healthy lifestyle.
Consumers have different priorities when embarking on healthy diets, including facilitating health preserva- tion or preventing or treating illness. Consequently, their information demands concerning selectable foods also vary. Directive 2000/13/EC1 of the European Parliament and the European Council and the subsequent Regulation
1 http://eur-lex.europa.eu/legal-content/EN/TXT/PDF/?uri=CELEX:32000L0013&
from=HU
1169/20112 pertaining to the labelling and information con- tent of foods determine the scope of product-related data and markings. Marketing-related or informal components can be placed on products or at the point of sale, but the amount of information given often limited by the size of the particular food item. Consumers are eager to find relevant product- related information that enables them to decide whether the chosen item meets their dietary requirements. Consequently, reading the product labels can help in considering the ingre- dients or, by extension, facilitating product selection (Chen et al., 2011; Méjean et al., 2011). A greater stake (fulfilling dietary requirements or weight-loss plan) a consumer has in the selection of a product, the more he or she needs informa- tion for decision making.
Soós et al. (2012) showed that the priority given to hav- ing a healthy lifestyle, and closely connected to this the acquisition of information, increases with the level of edu- cational qualification. Similarly, evaluation of the informa- tion demands a specific level of knowledge that impacts interest in, and motivation for, information search. Several researchers have focused on the correlation between quali- fication and the willingness for information acquisition:
Borgmeier and Westenhoefer (2009) noted that prior nutri- tional knowledge predicts the use of food labels. Kelly et al.
(2009) pointed out the need to accompany the introduction of any front-of-pack labelling system with public education campaigns that inform consumers about how to interpret this labelling in the context of other nutrition guidelines.
Campos et al. (2010) showed that more educated individu- als have reported greater use of nutrition labels. Grunert et al. (2010) found that consumers with different levels of
2 http://eur-lex.europa.eu/legal-content/EN/TXT/PDF/?uri=CELEX:32011R1169&
from=EN
SOÓS Gabriella* and BIACS Péter Ákos**
The role of product-related information and factors impacting consumer attitudes during health-conscious food purchase in Hungary
The aim of this study is to identify factors impacting consumer attitudes towards the purchase of functional foods, also known as foods with a positive physiological impact on health, in Hungary. Our work also focuses on the volume of information cur- rently available to consumers when making such a choice, and on identifying consumer clusters. Particular attention is paid to the extent to which the available information can impact the respective purchase decision, which channels are used in obtaining such information, and which information is considered reliable or unreliable by shoppers. Based on the results of focus group research, we conducted a questionnaire-based survey (n=502). To reduce the high number and hard-to-interpret attitude variables, a factor analysis was performed, followed by the formation of consumer segments via cluster analysis according to the consumer attitude indicators. These segments were termed Health-conscious consumers, Consumers with limited information, The sceptics and The price conscious, and were characterised according to socio-demographic, behav- ioural and attitude variables. Then, we sought to identify the sources of information that would best address a given segment, and explored the efficiency of information transfer in the functional food market.
Keywords: functional food, healthy consumption, information process, segmentation JEL classifications: D12, D81, D83, M31
* Eszterházy Károly Egyetem, H-3300 Eger, Eszterhazy tér 1, Hungary. Corresponding author: soos.gabriella@uni-eszterhazy.hu
** Szent Istvan Egyetem, Gödöllő, Hungary.
Received 21 October 2017; revised 12 May 2018; accepted 14 May 2018.
nutritional knowledge will infer the healthiness of a food product in different ways.
In addition to educational background, the level of knowl- edge can have a role in determining the extent of one’s need for information. Too much or too complex information can cause confusion: Campos et al. (2010) reported that some consumers found different nutrition label formats confusing;
Temple and Fraser (2014) pointed out that front-of-package labels may give misleading information, so consumers are likely to find themselves confused by the information; and Miller and Cassady (2015) found a positive association between knowledge and food label use. Time pressures resulting from an accelerated lifestyle can make consumers turn to evasive strategies.
In the light of the abovementioned factors, our research explores the use of product information by consumers in Hungary, and examines the expected information content and the related difficulties of information use. Our starting point was the growing trend in health-conscious behaviour in the country. While this trend can impact several types of consumers, its direction and intensity can differ according to basic consumer attitudes. Consequently, in addition to a descriptive statistical analysis of consumer reactions, we paid special attention to the correlation between certain con- sumer characteristics and behaviour patterns. Our research was based on the following hypotheses: H1: The demand for information and obtaining the respective knowledge from product labels depend on the personal stake or involvement of the given consumer; H2: The higher the related knowledge level is, the more intense the need for further information is;
and H3: Lack of information leads to declining interest or the use of avoidance strategies.
Methodology
Focus group method and questionnaire
In the summer of 2016 we performed a comparative examination of two groups with special emphasis on general familiarity with the functional product concept, the respective consumer attitudes, the typical demands and expectations, and the causes of potential rejection. The schedule of the
inquiry was based on a model composed of related research findings (Soós, 2016). The results were used to develop a questionnaire composed of 30 closed, open answer, general scale, ranking and Likert scale type questions. The starting point was the growing trend of health-conscious behaviour.
While this trend can impact several types of consumers, its direction and intensity can differ according to basic con- sumer attitudes.
The questionnaire was conducted among the general public in Hungary by trained staff in the spring of 2017, and 502 usable responses were obtained. We collected the data either in person or via e-mail, and the sampling method was non-probable. The survey did not aim to be representative of the entire Hungarian adult population, but rather focused on the most relevant sections of society. Thus, 70.7 per cent of the respondents were woman (52.3 per cent of the Hungarian population was female in 2017), so they are overrepresented, but in Hungary women frequently do the shopping for the family (Soós et al., 2012). Furthermore, men are more likely to refuse to answer this type of questionnaire.
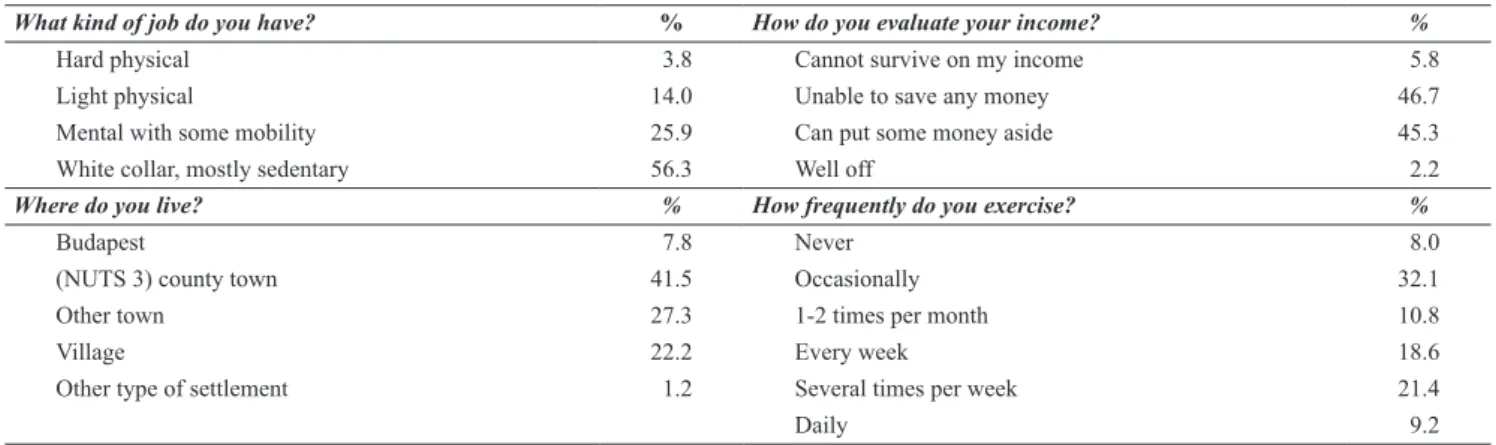
Of the 502 respondents, 39.9 per cent were single, 57.5 per cent married and 2.6 per cent were widow(er)s. The average age was relatively young: 42.5 per cent were aged 18-30, 17.4 per cent 31-40, 20.8 per cent 41-50, 10.6 per cent 51-60, and 8.8 per cent 60+. Around half (47.1 per cent) had children. Most had white collar, mainly sedentary jobs, more than 90 per cent stated that they could survive on their incomes but were either unable to save any money or could put some money aside. Around half lived in Budapest or a (NUTS 3) county town and around 50 per cent exercised weekly or more (Table 1). The data were recorded and ana- lysed using the SPSS software package (IBM Corporation, Armonk, NY, United States).
Sample testing for determining the suitability of factor analysis
During the questionnaire survey, we strove to examine the highest possible number of attitude factors. Inevitably, the large number of variables made segmentation difficult, and consequently we performed a factor analysis in order to facilitate data reduction. The variables used in factor analysis are metric, mostly represented on an interval scale.
Firstly, the normality test of dependent and non-dependent
Table 1: Employment, income, residence and exercise frequency profiles of the respondents.
What kind of job do you have? % How do you evaluate your income? %
Hard physical 3.8 Cannot survive on my income 5.8
Light physical 14.0 Unable to save any money 46.7
Mental with some mobility 25.9 Can put some money aside 45.3
White collar, mostly sedentary 56.3 Well off 2.2
Where do you live? % How frequently do you exercise? %
Budapest 7.8 Never 8.0
(NUTS 3) county town 41.5 Occasionally 32.1
Other town 27.3 1-2 times per month 10.8
Village 22.2 Every week 18.6
Other type of settlement 1.2 Several times per week 21.4
Daily 9.2
Source: own data, n=502
variables was performed. In line with recent research find- ings, absolute value 1 was the maximum declared normal value for slanted or peaked graphs. The respective distribu- tion was also examined by the Shapiro-Wilk test. As Jureck- ová and Picek (2007) and Liang et al. (2009) assert, its effi- ciency level is optimal even with a high component number or sample population. Accordingly, all dependent variables assumed a value near 1 and, based upon the principle of nor- mality, this is acceptable too (Huzsvai and Vincze, 2012).
The homogeneity of the sample was assessed using the Levene test. The shared variance is applicable to the whole sample, the dependent (attitude) variables scheduled to be subjected to factor analysis display identical distribution in the context of the various levels of non-dependent variables, thereby proving the existence of homoscedasticity (based on Sajtos and Mitev, 2007).
We prepared a correlation matrix in order to explore the applicability or eligibility of the respective data. The correla- tion was statistically significant for all variables, and very low correlation coefficients (0.096) were found in only two cases, while the value of the strongest correlation was 0.55.
Thus, the expectation related to variables, namely the exist- ence of a correlation which is not too close or strong, was met and the respective variables could be appropriately allo- cated or divided into factors.
As expected, the extradiagonals (indicating a variance not depending on the variables) of the anti-image-matrix covariance chart were low. The partial correlation coeffi- cients of the anti-image correlation table were also low, lead- ing to the conclusion of the existence of strong factors. The measure of sampling adequacy (MSA) values displayed in the diagonal line of the matrix were high (≥0.5, the small- est was 0.864) indicating a potentially close integration into the factor structure. The significance level of the Bartlett test was 0, suggesting that the starting variables were suitable for factor analysis. The Kaiser-Meyer-Olkin (KMO) criterion was 0.885, implying that the average of the MSA values was
‘very good’, confirming the eligibility of the given variables for factor analysis (after Sajtos and Mitev, 2007).
Cluster analysis
Reflecting the attitudes of functional food consump- tion, two consumer groups, ‘Price-conscious’ and ‘Health- conscious’, were initially set up in line with Soós et al. (2012) but, after examination of the impact of information on atti- tude, additional clusters were formed in order to improve our results. For the cluster analysis, the survey questions were allocated to three basic groups:
• Descriptive questions, used for the preparation of basic descriptive statistics facilitating the basic char- acterisation of the multitude and the assessment of suitability for integration into the sample;
• Cluster-forming questions, to facilitate segmentation and help in the creation of groups while mostly con- taining scale-displayed attitude variables;
• Segmentational questions, which serve the more detailed description of the clusters, and vary accord- ing to their type.
Results
Profiles of the respondents
Three quarters of the respondents believed that diet can significantly influence their health, but only 11.8 per cent said that they always tried to purchase healthy products.
Furthermore, 57.1 per cent mostly, and 29.1 per cent rarely, consider the available product information. Four fifths of those paying attention to product selection are motivated by maintenance of health or the prevention of illness, 8.4 per cent want to improve their general health and 4.0 per cent do so because of a treatment of an illness or disorder.
Replies in the ‘Other’ category included such remarks as “I choose such products which are cheaper”, and references to sports, diet, avoiding harmful materials and the demands of child rearing.
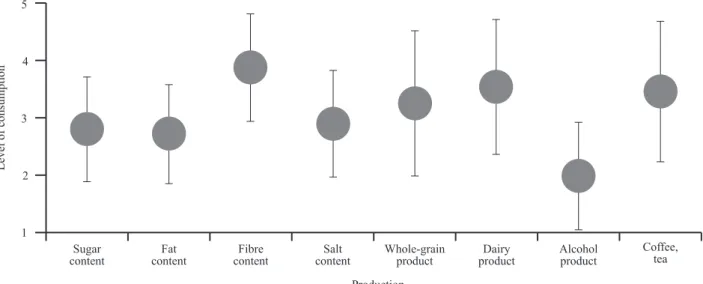
In terms of their self-assessed levels of nutrient consump- tion, respondents recorded the lowest average value for alco- hol consumption, followed by fat, sugar and salt (Figure 1).
Higher than average consumption was reported for whole- grain products, seeds, coffee and tea, and the highest con- sumptions were of dairy products and foods containing fibre.
The 652 health-related responses gathered from the 502 interviewees reflect the fact that several respondents answered positively to more than one topic. Almost one third of those surveyed reported no health-related issues (Figure 2). The most frequent determining factor of diet is the choice of type, which can be either weight loss or candida oriented, and this is followed by food allergy or some kind of intoler- ance, along with the effect of sports on eating and nutrition.
The diet of some respondents was influenced by such health issues as high cholesterol level, diabetes and heart condi- tions.
We were also interested in knowing which factors played a role in food purchase-related decision making by the respondents, and they were asked to rank the factors shown in Figure 3. Respondents considered product composition, with a score of 3.0, to be the most important factor, followed by flavour or taste, price and nutritional value. Brand, loca- tion of production and trademark were accorded much lower priorities, and the least important factors included the poten- tially reduced price, organic nature and packaging of foods.
Factor analysis
We began the factor analysis with the KMO criterion and, according to our original, exploratory intent, identified factors with a value of at least 1. Although with this method two factors can be discerned, this phenomenon explained only 47.6 per cent of the respective variance. Thus, it was necessary to include factors with a value below 1. Subse- quently, we applied the elbow rule and could recommend the exploration of four factors. We identified the optimally integrable model by the maximum likelihood method. While the two- or three-factor approach did not result in appropri- ate integration (ML<0.01), with four factors the model was optimally integrated (ML=0.011). However, with the four- factor model, the explained variation quotient was only 55.7
Sugar
content Fat
content Fibre
content Salt
content Whole-grain
product Dairy
product Alcohol
product Coffee, tea Production
1 2 3 4 5
Level of consumption
Figure 1: Self-assessed levels of consumption selected nutrients among the respondents.
1: respondent does not consume such nutrients; 5: high level of consumption Source: own data, n=502
0 5 10 15 20 25 30 35
Vegetarian / vegan lifestyle Ethical reasons Cardiac illness Diabetes Cholesterin niveau Expectation of sports Allergy, intolerance Special diet (candida, to weight loss etc.) None of these
Percentage
Figure 2: Incidence of illnesses reported by the respondents, per cent of all responses.
Source: own data, n=652
0 1 2 3 4 5 6 7 8
Components Flavour Price Nutritional value Brand Geographical origin Trademark of quality Price discount Organic, bio-, functional character Packaging
Percentage
Figure 3: Ranking by respondents of food purchase or selection-related decision-making factors.
1: extremely important; 9: unimportant Source: own data, n=500
per cent. Since for social science research the explained or interpreted variance quotient is expected to be around 60 per cent, we explored the option of including a fifth factor.
Consequently, we could explain 61.6 per cent of the vari- ance while the ML indicator of integration is significantly improved (ML=0.387).
Normally, only factors with a weight at least 0.5 are considered for analysis but we noted a factor weight below 0.5, i.e. 0.41 for a variable referring to attitudes to packag- ing-related information. In order to determine whether this variable should be excluded from the model we performed the abovementioned test without it. Since neither the appro- priateness nor interpretation of the respective results were modified, the variable remained part of the model. Thus, the analysis resulted in the following factors: (a) ‘health- conscious attitude’; (b) ‘price and safety orientedness’; (c)
‘conviction’; (d) ‘physiological impact’; (e) ‘the information transfer function of packaging’.
Cluster analysis
Based upon the results of the factor analysis and the attitude indicators of the respondents, the cluster analysis resulted in four consumer segments: ‘Health-conscious con- sumers’ represented 30 per cent of the respondents, ‘Con- sumers with limited information’ made up 20 per cent, ‘The sceptics’ accounted for 28 per cent, and 22 per cent of the sample were ‘The price conscious’. Below, we firstly charac- terise the four clusters, and then compare the knowledge and attitudes towards diets and functional foods, food consump- tion habits and the criteria determining them, and the price sensitivity of the different clusters.
Characterisation of the clusters
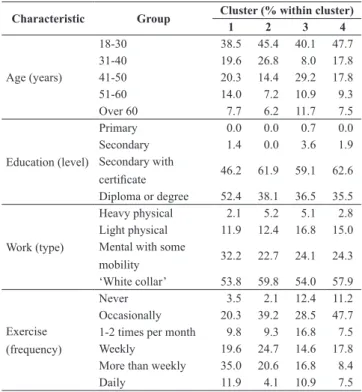
Three quarters of the ‘Health-conscious consumers’ are women, and most of them live either in county towns or Budapest. The proportion of the older age group, aged 40 or over, in this segment is relatively high. Many are either occasionally or regularly involved in sports activities, and they tend to have savings (Table 2).
Young adults are the dominant population of the ‘Con- sumers with limited information’ cluster, thus the number of households without children is the highest. Two thirds of the sample have completed secondary education, and most live in towns, with one quarter residing in villages. They tend to exercise weekly. Like the members of the first cluster they have savings, but the number of men is the highest in this segment. Members of the frequently do not shop alone or someone else does the food shopping for the household.
Their limited knowledge can be due to their relatively young age, their hectic life style or not being impacted by condi- tions affecting the other groups.
One half of the ‘The sceptics’ cluster is more than 41 years old, and they are mostly married with children. Sec- ondary education is dominant and the incomes are sufficient only for subsistence. They primarily shop on their own and are mostly blue-collar workers whose sports activities can be either sporadic or regular.
Finally, ‘The price conscious’ cluster includes either young or middle-aged people; most of them are married, but 57 per cent of the households have no children. They have completed secondary education, and may be either white- and blue-collar workers, but the income of 56 per cent is only sufficient to meet basic needs. They may live either in the city or countryside, and exercise occasionally or not at all.
Table 2: Age, education, work and exercise profiles of the four clusters.
Characteristic Group Cluster (% within cluster)
1 2 3 4
Age (years)
18-30 38.5 45.4 40.1 47.7
31-40 19.6 26.8 8.0 17.8
41-50 20.3 14.4 29.2 17.8
51-60 14.0 7.2 10.9 9.3
Over 60 7.7 6.2 11.7 7.5
Education (level)
Primary 0.0 0.0 0.7 0.0
Secondary 1.4 0.0 3.6 1.9
Secondary with
certificate 46.2 61.9 59.1 62.6
Diploma or degree 52.4 38.1 36.5 35.5 Work (type)
Heavy physical 2.1 5.2 5.1 2.8 Light physical 11.9 12.4 16.8 15.0 Mental with some
mobility 32.2 22.7 24.1 24.3
‘White collar’ 53.8 59.8 54.0 57.9
Exercise (frequency)
Never 3.5 2.1 12.4 11.2
Occasionally 20.3 39.2 28.5 47.7
1-2 times per month 9.8 9.3 16.8 7.5
Weekly 19.6 24.7 14.6 17.8
More than weekly 35.0 20.6 16.8 8.4
Daily 11.9 4.1 10.9 7.5
Clusters: 1: ‘Health-conscious consumers’; 2: ‘Consumers with limited information’;
3: ‘The sceptics’; and 4: ‘The price conscious’
Source: own data (n=484)
Influence of diet on health
‘Health-conscious consumers’ are convinced that diet can have a significant impact on their health (Table 3). ‘Con- sumers with limited information’ and ‘The sceptics’ have an occasional awareness of health-conscious food selection, and ‘The price conscious’ are the least convinced about the physiological impact of food.
Table 3: Respondents’ assessments of the extent to which their diet affects their health status by cluster.
Extent of effect Cluster (% within cluster)
1 2 3 4
Entirely 1.4 1.0 0.0 0.9
Substantially 90.2 76.3 72.3 54.2
Average 8.4 20.6 24.1 39.3
Somewhat 0.0 2.1 2.9 5.6
Not at all 0.0 0.0 0.7 0.0
For cluster labels see Table 2
Kendall’s tau-b: 0.271, sig. = 0.000; Kendall’s tau-c: 0.196, sig. = 0.000 Source: own data (n=484)
them to distinguish foods with a positive physiological impact from traditional items. They are not as eager to find healthy foods unless they are motivated by the maintenance of health or the prevention of diseases, i.e. allergies, and special diets play a role in their decision making.
Similarly, ‘The sceptics’ do not consider themselves to be well informed, but they are slightly less convinced about the impact of nutrition on health. Thus, health disorders or illnesses play a limited role in their decision making and they tend not to take special dietary needs into considera- tion. Information on food packaging, including the prod- uct’s influence on health, does not play a significant role in their purchasing decisions. Furthermore, they are reluc- tant to buy new products. While they do not often read the information on food labels, they consider the information to be reliable.
‘The price conscious’ are the least sure in their food- related knowledge and can hardly interpret the available information; they consider their knowledge insufficient to determine which food can be beneficial to health. Dietary considerations do not influence their decision making and they pay little attention to product data. Owing to their exist- ing health disorders, they tend to select the same products and do not opt for new ones.
Food consumption habits
‘Health-conscious consumers’ try to limit sugar, fat, salt, alcohol or coffee intake, and prefer foods with substantial fibre content and whole-grain cereals (Table 6). ‘Consum- ers with limited information’ strive for a favourable diet and have the highest milk consumption among the four clusters, while their alcohol, coffee and tea intakes are among the low- est. The diet of ‘The sceptics’ contains more fat, salt, alcohol, coffee, tea and fibre, while ‘The price conscious’ consume the most sugar, fats, salt, alcohol, the least amount of fibre and whole-grain products, and drink much milk, coffee and tea. The following data show the self-assessed nutritient con- sumption of the respondents.
Attitudes to diet and to food labels
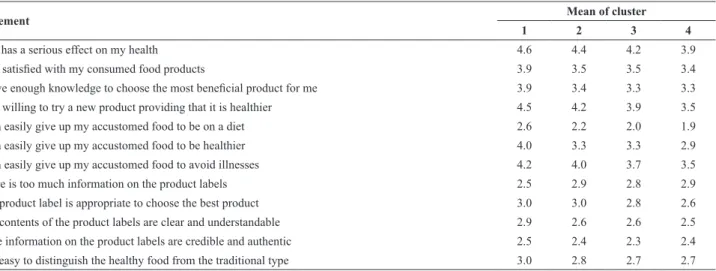
‘Health-conscious consumers’ are the most willing to try new types of foods and to forego traditional ones for the sake of their diet (Table 4). Consequently, they try to select foods with a positive physiological impact primarily for maintenance of their health, even if the flavour of the food is reduced or its price increases. Furthermore, they understand, interpret and trust product labels and can eas- ily recognise safe foods and those with healthy physiologi- cal impact among the traditional ones. Their nutritional needs are often controlled or impacted by the expectations of the sports they pursue, food allergy, or special, weight- loss diets, but in most cases food-related decisions are not connected with health issues or diseases. Members of this group consider themselves the most informed regarding the health food market (Table 5).
Table 5: Respondents’ perception of adequacy of information availability regarding the health food market by cluster.
Do you have enough information?
Cluster (% within cluster)
1 2 3 4
Yes 15.4 7.2 8.8 13.1
I have much but try to improve my knowledge 57.3 50.5 32.1 32.7 I have some but I need more 26.6 41.2 51.8 43.0 I do not understand much of the information 0.7 1.0 7.3 11.2 For cluster labels see Table 2
Kendall’s tau-b: 2.02, sig. = 0.000; Kendall’s tau-c : 0.185, sig. = 0.000 Source: own data (n=484)
Although many ‘Consumers with limited information’ are familiar with the term ‘functional food’, they do not consider themselves to be well informed about its meaning. Although they wish to acquire more detailed knowledge, 91.7 per cent of them have much or some information about this topic. They are unable to interpret or understand the product labels; they do not consider the information reliable and it is difficult for Table 4: Respondents’ attitudes to diet and to food labels by cluster.
Statement Mean of cluster
1 2 3 4
Diet has a serious effect on my health 4.6 4.4 4.2 3.9
I am satisfied with my consumed food products 3.9 3.5 3.5 3.4
I have enough knowledge to choose the most beneficial product for me 3.9 3.4 3.3 3.3
I am willing to try a new product providing that it is healthier 4.5 4.2 3.9 3.5
I can easily give up my accustomed food to be on a diet 2.6 2.2 2.0 1.9
I can easily give up my accustomed food to be healthier 4.0 3.3 3.3 2.9
I can easily give up my accustomed food to avoid illnesses 4.2 4.0 3.7 3.5
There is too much information on the product labels 2.5 2.9 2.8 2.9
The product label is appropriate to choose the best product 3.0 3.0 2.8 2.6
The contents of the product labels are clear and understandable 2.9 2.6 2.6 2.5
*The information on the product labels are credible and authentic 2.5 2.4 2.3 2.4
It is easy to distinguish the healthy food from the traditional type 3.0 2.8 2.7 2.7
For cluster labels see Table 2
Data are significant (ANOVA α<0.5, except * α<0.6) 1 = completely agree; 5 = completely disagree Source: own data (n= 502)
Table 6: Respondents’ consumption of foodstuffs by cluster.
Nutrient Mean of cluster
1 2 3 4
Sugar 2.5 2.9 2.9 3.3
Fat 2.5 2.7 2.8 3.1
Fibre 4.3 3.7 3.8 3.7
Salt 2.8 2.9 3.1 3.2
Maize, whole-grain products 3.9 3.2 3.1 2.8
Dairy 3.4 3.8 3.6 3.8
Alcoholic drinks 2.0 1.9 2.1 2.2
Coffee, tea 3.4 3.4 3.7 3.5
For cluster labels see Table 2 1 = not at all; 5 = very much Source: own data (n=484)
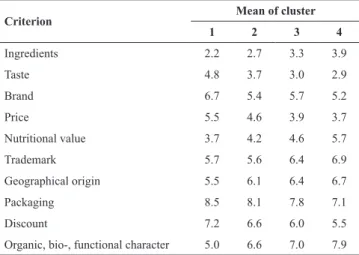
Criteria of food purchasing habits
The main defining criteria of the food purchasing habits of ‘Health-conscious consumers’ include product structure, nutritional value, flavour and the organic aspects of the item (Table 7). The food purchase-related decisions of ‘Consum- ers with limited information’ are based on content, flavour, nutritional value and price; product labels play a lesser role than for their health-conscious counterparts. The primary factors determining food purchase among ‘The sceptics’
are taste, composition and price: these are more important for them than the physiological impact. The food purchase decisions of ‘The price conscious’ are based on taste, price, composition and brand. Thus, their food purchase decision is mostly determined by taste and price compared to the physi- ological impact, even if it is scientifically justified.
Table 7: Defining criteria of respondents’ food purchasing habits.
Criterion Mean of cluster
1 2 3 4
Ingredients 2.2 2.7 3.3 3.9
Taste 4.8 3.7 3.0 2.9
Brand 6.7 5.4 5.7 5.2
Price 5.5 4.6 3.9 3.7
Nutritional value 3.7 4.2 4.6 5.7
Trademark 5.7 5.6 6.4 6.9
Geographical origin 5.5 6.1 6.4 6.7
Packaging 8.5 8.1 7.8 7.1
Discount 7.2 6.6 6.0 5.5
Organic, bio-, functional character 5.0 6.6 7.0 7.9 For cluster labels see Table 2
1 = important; 10 = not important Source: own data (n=502)
Frequency of buying healthy products
There is notable difference among the clusters in terms of food consumption (Table 8). ‘Health-conscious consum- ers’ buy healthy products often or always, while much larger percentages of the ‘The sceptics’ and ‘The price con- scious’ clusters occasionally or never do so.
Table 8: Frequency of buying healthy products by cluster.
I buy healthy products … Cluster (% within cluster)
1 2 3 4
never 0 0 1.5 1.7
occasionally 4.9 21.6 35.0 29.3
often 71.3 73.2 56.2 57.2
always 23.8 5.2 7.3 11.8
For cluster labels see Table 2
Kendall’s tau-b: 0.421, sig. = 0.000; Kendall’s tau-c: 0.366, sig. = 0.000 Source: own data (n=484)
Awareness of the term ‘functional food’
Among ‘Health-conscious consumers’, 45.5 per cent are familiar with the term ‘functional food’ (Table 9). ‘The scep- tics’ tend to be less familiar with this concept as, although they heard about it, they do not have a clear idea of the meaning.
Table 9: Awareness of the term ‘functional food’ by cluster.
Awareness Cluster (% within cluster)
1 2 3 4
Yes, I know what the term means 45.5 27.8 22.6 16.8 I have heard the term, but I do not know
precisely what it means 43.4 47.4 45.3 43.9
No, I have never heard the term 11.2 24.7 31.4 39.3 For cluster labels see Table 2
Kendall’s tau-b: 0.249, sig. = 0.000; Kendall’s tau-c: 0.243, sig. = 0.000 Source: own data (n=484)
Regularity of reading product labels
To choose the most appropriate product, the costumers need to have more information. One of the most important sources of information is the product label. The more regu- larly consumers read the label, the greater is their aware- ness level. There is a significant difference among clusters according to the usage of product label (Table 10).
Table 10: Regularity of reading product labels by cluster.
Regularity Cluster (% within cluster)
1 2 3 4
Always 19.6 5.2 4.4 8.9
Mostly 73.4 56.7 46.7 52.9
Sometimes 5.6 23.7 34.3 25.2
Rarely 1.4 14.4 13.9 12.2
Never 0 0 0.7 0.8
For cluster labels see Table 2
Kendall’s tau-b: 0.393, sig. = 0.000; Kendall’s tau-c: 0.360, sig. = 0.000 Source: own data (n=484)
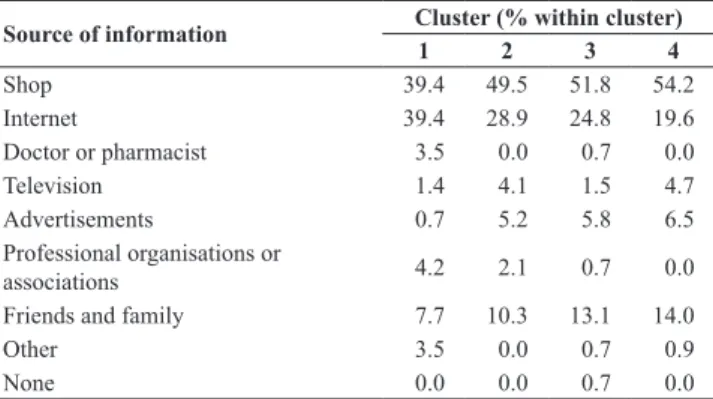
Sources of information on functional foods and their credibility
‘Health-conscious consumers’ are the most likely to lis- ten to the opinions of doctors and pharmacists, but also use the Internet sources to gather information (Table 11). Adver- tisements play little role in their food selection. They con- sider information issued by professional organisations (i.e.
food safety regulating authorities) credible, along with that
from the Internet and from professional organisations (Table 12). Most frequently they read the information on the pack- aging or on the label. They are mainly interested in the com- position, product description, nutritional value and expiry date of the foods. They believe consumer awareness can be improved by more informative labels and the integration of such topics in school curricula. Moreover, they consider functional foods safe for one’s health. Their food purchase is determined by credible, detailed and scientifically-sound information. Since their main information source is the Inter- net they can be reached without difficulty.
‘Consumers with limited information’ peruse food labels for components, description, expiry date and nutritional value. Whereas their most frequent source of information is the shop itself, they also tend to consider the views of pro- fessional organisations, their families and friends. They do not trust Internet sources or advertisements. In addition to more understandable and intelligible product descriptions, they would welcome information from authorities and com- mercial chains.
Table 11: Respondents’ preferred sources of information on functional foods by cluster.
Source of information Cluster (% within cluster)
1 2 3 4
Shop 39.4 49.5 51.8 54.2
Internet 39.4 28.9 24.8 19.6
Doctor or pharmacist 3.5 0.0 0.7 0.0
Television 1.4 4.1 1.5 4.7
Advertisements 0.7 5.2 5.8 6.5
Professional organisations or
associations 4.2 2.1 0.7 0.0
Friends and family 7.7 10.3 13.1 14.0
Other 3.5 0.0 0.7 0.9
None 0.0 0.0 0.7 0.0
For cluster labels see Table 2
Phi 0.324 Sig. 0.001, Cramer 0.187 Sig. 0.001 Source: own data (n=483)
Table 12: Most credible sources of information on functional foods by cluster.
Source of information Cluster (% within cluster)
1 2 3 4
Advertisements 0.7 1.0 5.1 9.3
Traders 16.1 12.4 10.9 9.3
Internet 30.1 17.5 24.1 15.0
Journals and magazines 5.6 11.3 7.3 5.6
Friends and family 17.5 27.8 17.5 35.5
Professional organisations or
associations 23.1 24.7 23.4 14.0
None of these 7.0 5.2 11.7 11.2
For cluster labels see Table 2
Phi 0.311 Sig. 0.000, Cramer 0.18 Sig.0.000 Source: own data (n=484)
‘The sceptics’ regard information provided by profes- sional organisations, and family and friends reliable, but they are divided on the credibility of Internet-based sources and do not trust advertisements or information provided by merchan- disers. They object to the small size of lettering on product labels, but most of them do not fully understand the respec- tive data, and one quarter of the sample is not even interested.
Those reading the product labels seek information on expiry date, composition, product description and price. They expect product labels to be readable and more informative.
Among ‘The price conscious’, the most frequent sources of information are the point of sale and the opinions of fam- ily members and friends. Members of this group do not con- sider advertisements and Internet-based resources reliable.
One half of the sample do not read the labels due to a lack of interest; if they do, however, they check the expiry date, price and the product description.
Price sensitivity
‘Health-conscious consumers’ show the lowest level of price consciousness, as 16 per cent of the sample are willing to pay 20 per cent more for a chosen product (Table 13).
‘Consumers with limited information’ are willing to pay between 1-15 per cent more for healthy foods regardless of taste or price. ‘The sceptics’ are more price conscious, as they would only pay 1-10 per cent more for a healthy food product. Consciousness or sensitivity to price is the highest among ‘The price conscious’ as 41 per cent would only pay 1-5 per cent more for a healthy product, while 31 per cent are willing to spend 6-10 per cent more for such items.
Table 13: Respondents’ price sensitivity by cluster.
I would pay % more for a
healthy product … Cluster (% within cluster)
1 2 3 4
0 2.8 4.2 3.6 9.3
1-5 11.2 22.9 32.8 41.1
6-10 33.6 42.7 35.8 30.8
11-15 20.3 21.9 16.1 12.1
16-20 15.4 4.2 8.0 4.7
more than 20 16.8 4.2 3.6 1.9
For cluster labels see Table 2
Kendall’s tau-b: 0.281, sig. = 0.000; Kendall’s tau-c: 0.282, sig. = 0.000 Source: own data (n=483)
Discussion
Consumption-related research should not use the term
‘functional food’ due to the public’s limited familiarity with the expression. Although the 17 per cent rate of familiarity with the concept reported by Soós et al. (2012) has since increased, still 70 per cent of those surveyed have no clear idea of the meaning of the term. In questionnaires addressed to shoppers, we suggest using the term ‘product with healthy physiological impact’ instead.
The consumer’s use of food product labels depends pri- marily on the extent of their involvement, either in terms of regularly shopping for food or having health conditions that restrict the food selection. We have shown that among consumers that pay little attention to the available product information the shopping is mostly done by another member of the family, and the frequency of nutritional disorders is lower (R1). In line with the survey of Campos et al. (2010), according to which “label use was generally high: 82 per cent in New Zealand, 52 per cent in Canada, 47 per cent in the European Union and 75 per cent in the USA”, in our
survey 61.1 per cent of the respondents read the label always or most of the time.
Health-conscious, highly-informed consumers demand product information most often and they obtain it from sev- eral sources (R2). Those with more limited education do not even take advantage of information available at the point of sale, or pay attention only to a few factors, primarily the expiry date. This result is consistent with the statement of Grunert (2010) that “a lower use of nutritional information in the lower classes is due to lower nutrition knowledge, lower interest in healthy eating, or other factors”. Their decision making is based on habit and is primarily aimed at avoiding risks (R3).
Consumers’ knowledge of the physiological impact of the ingredients of healthy or functional foods should be increased so as to help them understand the content of food labels. Even if they are not actively seeking information, they could be given food-related information at the point of sale by the sales personnel. They are willing to pay a higher price for a healthy product if they find the information reli- able, reinforced by the given reference group. Such motiva- tion can be increased by effective information transfer. The
‘health-conscious consumers’ pay the most attention to a healthy lifestyle and are more likely to buy healthy food, as price is not a decisive factor for them. As long as they are open to innovations, they can be easily influenced by point of sale, QR code-based, or info-point data search. The motiva- tion of the ‘Price conscious’ could be increased with more readable and understandable product data.
Consumers’ demand for information to justify food pur- chase decisions varies according to their level of knowledge, involvement, personal attitudes and socio-demographic indi- cators. The higher the level of existing knowledge and the extent of involvement, the greater the need for information.
Furthermore, attitude can impact the search for and process- ing of the respective information. Socio-demographic data suggest that higher income and higher educational qualifi- cations increase information demand; the lower amount of obtained or ‘learned’ information limits the expectations of young shoppers, and existing nutrition-related disorders in the older age group call for informed and sound decision making. This statement is consistent with the findings of Miller and Cassidy (2015), according to which “food label use may be even more important for older adults because of their higher risk of diet-related chronic diseases”.
In order to make an informed and optimal decision, con- sumers need reliable data, but they do not trust some of the available information and the latter remains ineffective. Reli- able data obtained from effective sources can vary according to the given segment. The health-conscious consumers need more and more information on the point of purchase (POP), so we suggest that more informative, readable and easily under- standable product-related information, along with the place- ment of digital accessories such as QR codes with the size of the given product in mind or infopads at the point of sale, along with the provision of more information on the credible and authentic Internet sites can help in realising these objec- tives. Thanks to the growing popularity of the digital word, these modern methods and instruments can be used success- fully in many countries of the world, including Hungary.
References
Anon. (1999): Scientific Concepts of Functional Foods in Europe:
Consensus Document. British Journal of Nutrition 81, S1-S27.
https://doi.org/10.1017/S0007114599000471
Bagdy, E. (2010): Vitalitásgenerátorok [Vitality generators]. Lege Artis Medicinae 19 (1), 6-7.
Borgmeier, I. and Westenhoefer, J. (2009): Impact of different food label formats on healthiness evaluation and food choice of con- sumers: a randomized-controlled study. BMC Public Health 9, 184. https://doi.org/10.1186/1471-2458-9-184
Chen, X., Jahns. L. and Gittelsohn, J., Wang, Y. (2011): Who is missing the message? Targeting strategies to increase food label use among US adults. Public Health Nutrition 15 (5), 760-772.
https://doi.org/10.1017/S1368980011002242
Campos, S., Doxey, J. and Hammond, D. (2010): Nutrition labels on pre-packaged foods: a systematic review. Public Health Nutrition 14 (8), 1496-1506. https://doi.org/10.1017/S1368980010003290 Grunert, K.G., Wills, J.M. and Fernaendez-Celemín, L. (2010): Nu- trition knowledge, and use and understanding of nutrition infor- mation on food labels among consumers in the UK. Appetite 55 (2), 177-189. https://doi.org/10.1016/j.appet.2010.05.045 Huzsvai L. and Vincze Sz. (2012): SPSS-könyv [SPSS book]. Hun-
gary: Seneca Books. Available online at http://seneca-books.hu/
doc/spsskonyv.pdf (accessed 9 July 2017).
Jurecková J. and Picek J. (2007): Shapiro-Wilk-type test of normality under nuisance regression and scale. Computational Statistics
& Data Analysis 51 (10), 5184-5191. https://doi.org/10.1016/j.
csda.2006.08.026
Kelly, B, Hughes, C., Chapman, K. and others (2009): Consumer testing of the acceptability and effectiveness of front-of-pack food labelling systems for the Australian grocery market. Health Promotion International 24 (2), 120-129. https://doi.org/10.1093/
heapro/dap012
Liang, J., Tang, M.L. and Chan, P.S. (2009): A generalized Sha- piro-Wilk W-statistic for testing high-dimensional normality.
Computational Statistics and Data Analysis 53 (11), 3883-3891.
https://doi.org/10.1016/j.csda.2009.04.016
Méjean, C., Macouillard, P., Pe´neau, S., Hercberg, S. and Castet- bon, K. (2011): Perception of front-of-pack labels according to social characteristics, nutritional knowledge and food purchas- ing habits. Public Health Nutrition 16 (3), 392-402. https://doi.
org/10.1017/S1368980012003515
Miller, L.M. and Cassady, D.L. (2015): The effects of nutrition knowledge on food label use. A review of the literature. Appetite 92, 207-216. https://doi.org/10.1016/j.appet.2015.05.029 Sajtos, L. and Mitev, A. (2007): SPSS Kutatási és adatelemzési
kézikönyv [SPSS Manual for research and data analysis]. Buda- pest: Alinea Kiadó.
Soós, G. (2016): A termékinformáció fogyasztói magatartást be- folyásoló hatása az élelmiszervásárlás során [The impact of prod- uct information on food purchase-related consumer behaviour].
Táplálkozásmarketing 3 (1), 73-83. https://doi.org/10.20494/
TM/3/1/6
Soós, G., Biacs, P. and Kiss, A. (2012): Fogyasztói attitűdök a funk- cionális élelmiszerfogyasztás területén [Consumer attitudes re- lated to functional foods]. Élelmiszer, táplálkozás és marketing 9 (1), 13-22.
Szakály, Z. (2011): Táplálkozásmarketing [Nutrition Marketing].
Budapest: Mezőgazda Kiadó.
Temple, N.J. and Fraser, J. (2014): Food labels: A critical assess- ment. Nutrition 30 (3), 257-260. https://doi.org/10.1016/j.
nut.2013.06.012