DOI: 10.1556/606.2019.14.2.16 Vol. 14, No. 2, pp. 181–192 (2019) www.akademiai.com
STABILITY ANALYSIS OF EMBANKMENT DAM AND FORECAST OF FAILURE SCOPE BASED ON
POINT SAFETY FACTOR
1 Oumnia ELMRABET, 2 Hasnae BOUBEL, 3 Mohamed ROUGUI*
4 Ouadia MOUHAT
1,2,3,4
Structure of Research Laboratory of Civil Engineering and Environment High School of Technology of Salé, Mohammed V University in Rabat
e-mail: 1oumnia90.elmrabet@gmail.com, 2boubel.hasnae@gmail.com
3rougui93@yahoo.fr, 4ouadie.mouhat@gmail.com Received 22 May 2018; accepted 8 November 2018
Abstract: In the context of verification of civil engineering structures stability and determination of sliding surface and safety factor, a careful analysis of several parameters was carried out to guarantee their safety against failure. To quantitatively forecast failure scope, the embankment dam located on Oued Rhiss in the province of Hocemia is chosen as the model of this study. A static stability analysis is performed by using the Slope/W software. A parametric study performed to evaluate the influence of dam’s height, the height of water in the reservoir and the length of drains on the safety coefficient and pore pressures. Reliability analysis elaborated by using the Comrel application, and it allows to statistically quantifying the probability of failure by employing the Monte Carlo distribution. Results show that the dam structure has some weak zones and not strong enough as the safety factor is less than one, it is related to structure’s parameters and the drainage system.
Keywords: Embankment dam, Dam-break, Finite element method, Pore pressure, Safety factor, SLOPE/W, Analysis of variance
1. Introduction
The breakdown of structures or dikes when it occurs always has serious consequences. Thus, stability studies continue is the subject of much scientific research [1]. The stability of earth dams depends on their geometry, the properties of the materials used and the forces to which they are subjected.
* Corresponding Author
To evaluate the stability of a civil engineering structure [2], to detect abnormal behavior, to determine the origins of disorders, to predict potential risks, and to decide on appropriate measures are the missions of diagnosis and risk analysis [3, pp. 3-12]
performed by engineers specialized in civil engineering. To accomplish these tasks, powerful methods exist and provide valuable help: physical models, numerical calculations, statistics, and reliability.
In the field of civil engineering, dams have always been considered as specific structures [4]. The reasons lie in the uniqueness of each dam, the complexity of the behaviors and mechanisms involved, and the major effects of water actions.
The methods of stability analysis of the usually used slopes [5] are based on a statement of experience that in case of a general landslide, there is separation of soil mass from the rest of the massif and sliding along a breaking surface [6]. The analysis of slope stability is treated as a limiting equilibrium problem.
To calculate the stability of the embankment dam, the surface of rupture, which will be sliding is must be given. By applying one of the calculation methods according to the nature of the hypotheses, a coefficient is determined, which will be the safety coefficient of sliding [7].
The studied dam is an embankment dam with a mask upstream located on Oued Rhiss in the province of Hoceima in Morocco. The objective is to present here the approach of this work and the main results obtained in research and development. In a first part, a proposed method is presented for the calculation of the dam’s stability, then, the distribution of pore pressures is evaluated and the rupture surface is determined. The calculations are carried out using the Mohr-Coulomb criterion [8] using the finite element software Slope/W [9].
A parametric study on the influence of the dam’s height, the length of the drainage device and the water’s height in the reservoir on the safety coefficient is carried out.
Finally, a probabilistic analysis [10] is developed to statistically quantify the failure probability of embankments using the Monte Carlo method [11] implemented in the Comrel software.
2.Theoretical basis: Analysis method of slope stability
In addition to the site recognition and the choice of the mechanical characteristics of the soil, the study of the slope involves the calculation of the stability, in order to determine, on the one hand, the breaking curve along which the risk of sliding is the highest and on the other hand, and the corresponding value of the factor of safety. These points will be developed in the follows.
Among the most used methods of embankments stability study are those of Fellenius and Bishop [12]. In both cases (Bishop and Fellenius methods), it is assumed that the rupture takes place along a sliding surface in the form of a cylinder and that it occurs instantaneously along the whole surface.
The method adopted in this article is that of Fellenius (Method of slices). The mass considered unstable relative to the sliding surface and fictitiously cut into (n) juxtaposed vertical slices of small thickness. Each slice, (i) is subjected to the following forces:
• Its own weight Wi (soil and water);
• The reaction forces with tangential component Ti and normal Ni;
• The inter-slice forces Fi-1 and Fi applied to the lateral faces.
The analytical resolution of equilibrium equations is easy to determine by adopting simplifying hypotheses on the inter-slice forces: Fellenius proposes Fi = Fi-1; and the normal force reduced to the normal component of its weight Wi which the action of the pore pressure is subtracted.
Under these conditions, Coulombs law stipulates that, at the break, the limiting force (tangential) of shear strength is expressed in the form of:’
( )
i i(
i i ii)
ii mobilized CL W ul
T = + cosα − ⋅tanϕ , (1)
where Ci is the cohesion of the soil at the breaking surface; φi is the internal friction angle of the same soil; ui is the pore pressure prevailing at the base of the slice; the term CiLi represents the part due to cohesion; and the term (Wicosαi–uili) tanϕI represent the part due to friction.
Consequently, taking into account the circular shape of the sliding line, the global limit equilibrium is written in terms of the resulting moments relative to the center (O) of the rupture circle of radius R:
(
∑Mtresistant)
=Fs⋅x⋅(
∑Mtmotor)
, (2)where Fs is the safety coefficient [13] for this circle, a coefficient which finally makes it possible to appreciate the margin of safety existing between the resisting moment and the applied motor moment:
= ∑
= ∑
∑
=
=
n
i i
n
i i
motort RW R W
M
1 1
sin
sinα α (3)
and according to (1):
( )
[ ]
∑ + −
∑ =
= n
i i i i i ii i
resistantt RCL W ul
M
1
tan
cosα ϕ , (4)
where from the value of Fs for the tested circle can be deduced:
( )
[ ]
∑
∑ + −
=
=
=
n
i i i
n
i i i i i ii i
s
W
l u W
L C F
1 1
sin
tan cos
α
ϕ α
. (5)
Thanks to the many simplifying hypotheses introduced, it can be seen that the calculation of stability by the Fellenius method is not complex from the analytical point
of view. On the other hand, it appears to be tedious since it must be repeated for a series of slip circles until the circle with the lowest safety coefficient is reached, called as the critical circle.
3.Numerical results analysis
Today, numerical methods [8], combined with powerful computers, solve virtually all physical problems formulated with sufficient precision.
Among these methods, there is finite elements method and finite differences method that have allowed modeling the beginning of the rupture. Numerical methods are a useful or even necessary complement to limit equilibrium methods for the analysis of the stability of earthen structures.
The software used in this study is Slope/W; a powerful program for stability analysis of embankments.
Using the limit equilibrium method, it is possible to calculate the slope safety factor and to model heterogeneous soils of complex stratigraphy with different pore pressure conditions.
A static stability analysis using finite element modeling was performed to establish the static safety factor of the potential breaking surface.
3.1. Pore pressures analysis
Mechanical and hydraulic properties of the dam
Table I shows the mechanical and hydraulic properties of the dam.
Table I
Mechanical and hydraulic data of the dam
Parameters Embankment Foundation
φ (°) Friction angle 36 32
C (kPa) cohesion 0 0
γsat (kN/m³) Saturated soil weight 22 22
γh ( kN/m³) Specific wet weight 20 20
ru pore pressure coefficient 0 0
K (m/s) Coefficient of permeability 1 2
υ Poissons ratio 0.334 0.334
ξ Damping ratio 0.10 0.10
Two-dimensional numerical modeling
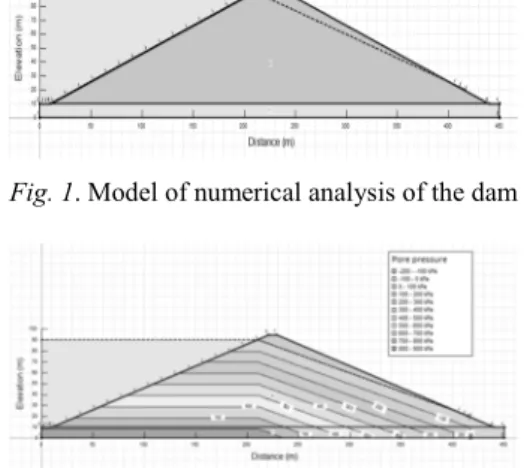
Fig. 1 presents the two-dimensional numerical modeling of the dam structure using Slope/W software.
The calculation principle is based on the determination of the contour lines of pore pressures acting on the dam in the absence of drain.
Fig. 2 indicates a remarkable variation in pore pressures, the maximum values observed are at the base of the dam.
Water plays a decisive role in most cases of slip. Drainage techniques, which are designed to reduce pore pressures, are therefore commonly used at the rupture surface.
Fig. 1. Model of numerical analysis of the dam
Fig. 2. Iso-contour of the initial pore pressures (kPa) 3.2. Sliding surfaces and safety factors:
The study of slope involves, in addition to the recognition of the site and the choice of the mechanical characteristics of the soils, calculation of stability, to determine, on one side, the rupture curve along which the risk of slippage is the highest, and on the other hand, the corresponding value of the safety coefficient.
Fig. 3 shows the saturation line and the sliding surface corresponding to the minimum safety factor.
The dam’s downstream slopes are very susceptible to instability and erosion due to seepage. The safety factor of the critical surface is Fs = 1.032 <1.5.
Fig. 3. Sliding surfaces
3.3. Parametric study
Influence of horizontal drain length on the variation of safety factor and pore pressures In most cases, the construction of earth dams requires the installation of drainage systems [14] to evacuate infiltrated waters and protect the downstream slope from the increase of pressure and erosion.
That constitutes to determine the optimal horizontal drain length for a homogeneous dam resting on a substratum. This is summarized in Table II, which represents the variation of the safety factor as a function of the Ld/Lb ratio.
Table II
Variation of the safety coefficient in function of the drain’s length
Relative length of drain Ld/Lb 0 1/4 1/3 1/2
Fs 1.03 1.44 1.62 1.79
where Ld is the length of drain; Lb is the length of dam.
Fig. 4 shows the variation of the pore pressures as a function of the drain length.
For short drainage systems, the saturation line still cuts the downstream slope. As the drainage systems go deeper, the saturation line does the same too. Numerical simulation shows an improvement in the safety coefficient as the drainage system length increases. It stabilizes at a drain length Ld≥1/4Lb.
Fig. 4. Variation of pore pressures as a function of drain length Behavior of the downstream slope under continuous flow conditions for different reservoir levels
The variation of the safety factor is influenced by several parameters, among them there is the height of water in the reservoir as it is shown in Table III.
Table III
Variation of safety coefficient in function of water height
Height of water in the reservoir (m) Lb/2 Lb/3 Lb/6
Fs 1.72 1.76 1.78
The most critical conditions for stability of the downstream slope, correspond to periods when the level water reservoir is the highest. The lowering of water level causes a drawdown of saturation line and therefore its distance become away from the downstream facing, which positively influences the safety coefficient. The flow generates pore pressures in the downstream slope, which have greater value when the water in the reservoir reaches a higher level.
The flow network influenced by: the height of water upstream, the position of the drain, the variations in the permeability ratio of backfill and foundation. It also varies in function of time when filling or emptying the reservoir.
The following Fig. 5 shows the sliding surfaces in the permanent flow.
Fig. 5. Visualization of sliding surfaces in permanent flow Influence of dam height
Table IV shows the variation of safety factor according to the dam height.
Table IV
Variation of the safety coefficient according to the height of the dam Height of dam (m) Hb Hb /2 Hb /3
Fs 1.54 2.51 3.84
Fig. 6 shows that the safety factor is also related to the geometrical properties of the structure and therefore to the shape of the rupture surface. It reaches its maximum values with the reduction of the height of the dam (Fs> 2), which allows to conclude that the margin of safety against the instability under the static load was quite large.
Experiments have shown that slopes always remain stable if Fs> 1.5, the slip is practically inevitable if Fs <1, [13]. For certain sites (quarries, open-pit mines, embankments under construction), the safety factor can be reduced to 1.2 or 1.3. In this case, monitoring and auscultation is generally reinforced.
3.4. Reliability of structure
The inadequacies of the deterministic approach have led many researchers to embark on the path of probabilistic methods [10]. Their objective was to evaluate quantitatively the degree of security according to its true meaning, which is the probability of ruin.
Initially, the notion was vague but promising because it would be considered the uncertainties of all kinds that affect the data.
Probabilistic analysis is performed on the critical slip surface, taking into account the variability of the input parameters [10]. The variability of the input parameters is assumed to be normally distributed with specified mean values and standard deviations.
a) Height of dam (Hb/2)
Height of dam (Hb/3)
Fig. 6. Variation of the safety coefficient and the pore pressures as a function of the dam’s height
Design of experiment table for parametric study
To perform reliability analysis, an analytical model giving an explicit representation of the problem is constructed.
This is performed by selection of pertinent trial points over the explored domain of the basic variables according to a design of experiment (DOE) [15].
The objective of the subsequent parametric study is to investigate at first, the effect of the three following parameters (hydrostatic pressure, Ph, Young’s modulus, E and the density, d of foundation material) on the static stresses. To quantitatively evaluate this effect, simulations are performed according to a full DOE table.
Keeping these three active variables, the static stress can be expressed explicitly as:
(
Ph Ed)
cr
cr σ , ,
σ = . (6)
This hypothesis makes it possible to focus on the main effects governing the static stability of embankment dam, the derivation of a predictive model is considered in the form of a quadratic polynomial response surface [16] that approximates the function σcr. The densities of probabilities that describe the three intervening random variables are defined and Monte Carlo method is used to calculate the probability of failure.
Analysis results
Calculations were performed for all the 27 combinations (33). Fig. 7 gives the obtained static stress as a function of the combination number.
Fig. 7. Static stresses as a function of the combination number
The most adverse case was found to be given by the parameters of combination 1.
The lowest static stress is then σcr = 176 Pa.
The quadratic polynomial giving the static stresses as obtained using Matlab is:
( )
, 10 44 . 1 10
07 . 3 10
95 . 1
10 47 . 1 10
6 . 6 10
72 . 4
10 8 . 2 10 8 . 6 2 . 16 10 74 . 3
2 19 2
4 2
4
18 17
2
15 1
2
d E
P
Ed d
P E
P
d E
P x
h
h h
static h cr
−
−
−
−
−
−
−
−
× +
× +
× +
× +
× +
× +
×
−
×
− +
× σ =
(7)
( )
, 10 68 . 442 . 1 10
03 . 3 10
63 . 8
10 88 . 4 10
97 . 7 10
5.45
10 53 . 2 10 72 . 6 3 . 95 36
2 19 2
5 2
2
19 17
5
15 2
d E
P
Ed d
P E
P
d E
P y
h
h h
static h cr
−
−
−
−
−
−
−
−
×
−
×
−
× +
×
−
×
−
×
−
× +
× + +
− σ =
(8)
( )
, 10 47 . 2 10
11 . 2 3 . 26
10 26 . 1 10
82 . 1 10
02 . 3
10 03 . 1 10
65 . 9 109 401
2 19 2
18 2
18 17
16
17 15
d E
P
Ed d
P E
P
d E
P z
h
h h
static h cr
−
−
−
−
−
×
−
× + +
× +
× +
× +
×
−
×
−
− σ =
(9)
The associated R-square values are R2 = 99.99%, R2 = 99.99% and R2 = 100% for the static stresses. These indicate that the interpolations are quite good for all the stresses and that the quadratic surface response models can be used to predict these efforts within the intervals of interpolation.
Table V gives the obtained results in terms of F and p-value statistics.
The high value of the Fisher variable F of pore-pressure indicates that this variable (P) is the most influential factor; it is followed by the material Young’s modulus.
Table V
Analysis of variance of the static stress as function of the three considered factors Source Sum Sq. d.f. Mean
Sq.
F Prob>F
P 161502.5 2 80751.2 11098365293926460 0
E 7678.2 2 3839.1 527641042444994 0
d 0 2 0 0 1
P*E 571.9 4 143 19650683857013 0
P*d -0 4 -0 -3 0
E*d 0 4 0 0 1
Error 0 8 0
Total 169752.6 26
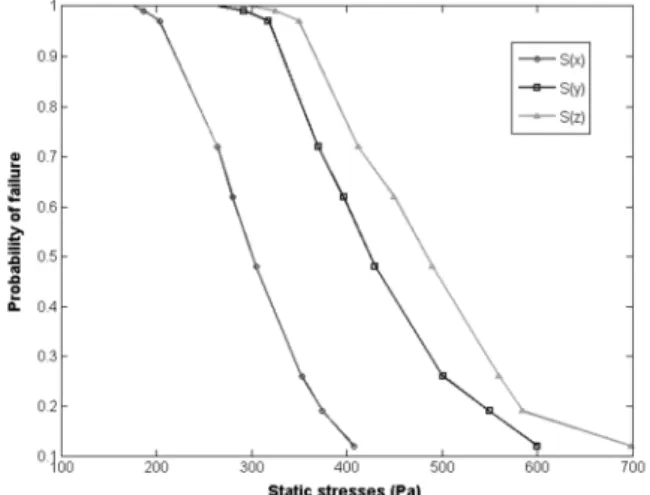
Fig. 8 gives the probability of failure as a function of the static stresses σ. The population size used in Monte Carlo process was fixed by the convergence requirement and a total number of 5×10⁴ samples were found to yield sufficiently accurate results.
The random variables associated with the active parameters are assumed to be distributed according to normal density of probabilities. Fig. 8 shows that the probability depends on the standard deviation of the intervening random variables and mean values.
Fig. 8. The Probability of failure as a function of the static stresses
4. Conclusion
The purpose of this study is to numerically analyze the influence of pore pressures on slope stability. The analysis of the stability of the embankments is treated as a limiting equilibrium problem.
Numerical simulations on the behavior of the upstream mask embankment on Oued Rhiss using Geo-slope software (Slope/W) were developed. Parametric studies have
been undertaken, which highlighted the importance of the geometric properties, the materials used and the drainage system in the stability of the structure. Reliability analysis of the static stability of embankment dam as influenced by several parameters was performed as function of dam’s height, the height of water in the reservoir and the length of evacuation drains by using Monte Carlo method.
Finite element analysis of the dam’s slopes stability was conducted for various combinations of these last parameters.
Analysis of the simulation results of this research shows that the pore pressures cannot affect the stability of a well-built dam unless the drainage system does not fulfill its role due to insufficiency or absence.
According to the simulations, the drawdown of the saturation line in a ground dam can be ensured by installing a horizontal drain whose length is: Ld≥1/4Lb. The safety factor is also related to the geometrical properties of the structure and therefore to the shape of the rupture surface. It reaches its maximum values with the reduction of the height of the dam and of the filling rate (Fs> 2).
The calculation of stability (slope and foundation) and especially its monitoring throughout their lives are extremely delicate tasks and require colossal means to predict catastrophes.
One of the most effective methods of dissipating excess pore pressure and improving the stability of the upstream slope during rapid drainage is the use of horizontal drain upstream. Equipotential lines tend to become horizontal.
Earth dams have always been regarded as the safest type of structure in the event of an earthquake. However, and according to many scientific researches this opinion may prove to be an error and an analysis of the behavior of dams under seismic stress is crucial. This is what is shown in the previous article.
References
[1] Zhang L., Liu Y. R., Yang Q. Evaluation of reinforcement and analysis of stability of a high-arch am based on geomechanical model testing, Rock Mechanics and Rock Engineering, Vol. 48, No. 2, 2015, pp. 803–818.
[2] Kuriqi A., Ardiçlioglu M., Muceku Y. Investigation of seepage effect on river dike’s stability under steady state and transient conditions, Pollack Periodica, Vol. 11, No. 2, 2016, pp. 87‒104.
[3] Peyras L., Royet P., Boissier D., Vergne A. Diagnosis and risk analysis related to the aging of dams, Development of methods of assistance to expertise, Engineering water, agriculture, territory, National Research Institute in Science and Technology for the Environment and Agriculture edition 2004,.
[4] Ait bihi M., Rhouzlane Pr., Fuamba Pr. Dam design, Hassania School of Public Works, 2013.
[5] Xu B., Wang Y. Stability analysis of the Lingshan gold mine tailings dam under conditions of a raised dam height, Bull. Eng. Geol. Environ, Vol. 74, No. 1, 2015, pp. 151–161.
[6] Abdellatif Z. Contribution to the seismic analysis of earth dams: Behavior of the structure, Department of Hydraulics, Faculty of Engineering, University El Hadj Lakhdar Batna, Algeria, 2009.
[7] Fagnoul A. Study of the construction and stability of earth or rockfill dams: Application to very deformable foundation soils, PhD Thesis, University of Harvard, 1960.
[8] Rahmouni O., Mabrouki A., Benmeddour D., Mellas M. Numerical study of geogrid- reinforced segmental earth retaining wall, Journal of Applied Engineering Science and Technology, Section C: Seotechnical and Civil Engineering, Vol. 1, No. 2, 2015, pp. 43‒49.
[9] Slope/W: for slope stability analysis, Geo-Slope Office, Version 5, User’s guide, Geo-Slope International Ltd. Calgary, Alberta, Canada, 2004.
[10] Kang F., Han S., Salgado R., Lie J. System probabilistic stability analysis of soil slopes using Gaussian process regression with Latin hypercube sampling, Computers and Geotechnics, Vol. 63, 2015, pp. 13‒25.
[11] Guillaume S. Determination of a precise gravity field for the CLIC feasibility studie, PhD Thesis, ETH Zurich, 2015.
[12] Tassadit A., Abderrahim R. Geotechnical study of slope stability case of the Meftah quarry, in Blida, Department of Mines and Geology, Faculty of Technology, University Abderahmane Mira, Bejaia, Algeria, 2015.
[13] Zhao L., Yang F., Zhang Y., Dan H., Liu W. Effects of shear strength reduction strategies on safety factor of homogeneous slope based on a general nonlinear failure criterion, Computers and Geotechnics, Vol. 63, 2015, pp. 215‒228.
[14] Pálinkášová Z., Šoltész A. Hydrologic and hydraulic evaluation of drainage system in eastern Slovak Lowland, Pollack Periodica, Vol. 7, No. 3, 2012, pp. 91‒98.
[15] Dang C. T. Methods of construction of seismic fragility curves by numerical simulations, University Blaise Pascal, Clermont II Graduate School Sciences for the Engineer of Clermont-Ferrand, 2014.
[16] Ouadiaa M., Abdellatif K. Reliability analysis of dynamic buckling stiffened panels, Procedia Technology, Vol. 22, 2016, pp. 139–145.