NAŠE GOSPODARSTVO OUR ECONOMY
pp.
3–14
Citation: Harnos, L. (2018). Cycles of the Housing Market in Hungary from the Economic Crisis until Today. Naše gospodarstvo/Our Economy, 64(2), 3-14.
DOI: 10.2478/ngoe-2018-0007
DOI: 10.2478/ngoe-2018-0007 UDK: 332.72:338.12(439) JEL: E32, R21, R31 RECEIVED: MARCH 2018 REVISED: MAY 2018 ACCEPTED: MAY 2018
Vol.
64
No.2 2018
in Hungary from the Economic Crisis until Today
László Harnos
PhD student at the Lámfalussy Sándor Department of Economics, University of Sopron, Hungary
easy.harnos@gmail.com
Abstract
The main aim of this paper is to identify the underlying reasons for the cyclical nature of the Hungarian housing market, in particular the business cycles, the construction, and market participants’ expectations. Our research was conducted based on analysis of statistical data and of the housing market indices. As a result, it can be stated that cyclic behaviour of the housing market may be explained primarily with business cycles, but state subsidies and mortgages also affect the variations. Accordingly, the increasing lending and the high amount of subsidies can generate a price bubble. The supply of second-hand dwellings looks more flexible compared with that of new ones. However, the expectations of market operators do not have a demonstrable effect on the housing market.
Keywords: property market, housing market cycles, asset price bubble
Introduction
The requirement of a detailed assessment of the global crisis in 2008 also high- lighted the importance of the research in the cyclic behaviour of the economy and the individual sectors, including the property market.
The property sector is one of the most important sectors of the national economy.
The aggregate value of the Hungarian residential properties is estimated to be about half the total estate of households, which is approximately 30–40 trillion Hungarian forints (Békés, Horváth, & Sápi, 2016). Construction of new buildings provides 2–3% of the GDP, out of which, the production value of new residential properties is only responsible for 0.3–0.8% of the GDP (Table 1).
The pro-cyclical behaviour of investments has long been treated as a fact in a macroeconomy. In the case of property investments, the short-term inflexibility of stock can be seen as the main reason for delays. The inflexible market stock of land is due to the limited quantity and the immovable nature of real properties. In the case of buildings, the relatively long time required for planning, authorisation, and construction is the reason why the only way the market can react to the varia- tion of demand on the short term is a price change.
The dominance of residential property ownership over rental has always been significant in Hungary, which was also amplified by the large-scale privatisation of state and council-owned properties at the beginning of the 1990s as well as
the state subsidies of residential properties that have been introduced since then. Based on the data of the latest census in 2011, 92.1% of all residential properties were used by the owner or his relative or the person with a right of usufruct.
The proportion of rented residential properties was only 6.8%, and uses based on other titles (lodging, service flat) constituted 1.1%. Such an overwhelming proportion of property ownership makes the analysis of market cycles more difficult because these cannot be assessed by the changes in rental costs.
When assessing the economic and social effects of Hun- garian property support, Hegedüs (2006), Kiss and Vadas (2006), and Mádi (2008) highlighted that the national property policy in Hungary has always favoured purchasing new properties over used ones, and that, in addition to nonre- imbursable aids, mortgages also play a key role in financing.
The latest type of subsidy, the family home creation support introduced in 2016, has not changed this either.
The main purpose of this paper is to identify the underlying reasons for the cyclical nature of the Hungarian housing market, in particular the business cycles, the construc- tions, and market participants’ expectations. The following key questions were mainly addressed by the research we conducted:
• How state grants and housing loans granted influence the general housing market cycles.
• Whether the general expectations of market players have any meaningful effect, influencing the Hungarian housing market.
• Whether the time period required for new housing con- struction projects and the seasonality factor alter the cycles seen on the housing market.
Our research was conducted based on a statistical analysis of the data published by the Central Statistical Office for the various periods (the mean price per sqm of new and sec- ond-hand dwellings, the amount of housing loans and state
grants provided, the total number of housing market transac- tions completed, and the total number of new constructions) as well as of the various housing market indices published by GKI Economic Research Co. The global crisis com- menced in 2008 has caused a notable change in the Hungar- ian housing market, so the period from the commencement of the crisis will be evaluated primarily. In the case of some of the indicators used, statistical data are only available from 2007, so amongst the years before the crisis, the year 2007 was used as the starting year. The data regarding price and value used in the research are provided in Hungarian forints.
At the time this manuscript was completed, the official exchange rate of the European Central Bank was EUR 1 = HUF 317.68
The study has four main parts. First, the theoretical bases and research results of the topic will be reviewed. The next part will show the changes of the Hungarian housing market from the political transformation until the economic crisis in 2008. The third part will analyse the behaviour of the market of residential properties over time, from the crisis until today. Finally, the conclusions will be drawn at the end of the study.
Factors Affecting the Short- and Long-Term Behavior of the Housing Market
The theoretical basis of the cyclic behaviour of the housing market, including the residential property, is the so-called four-quadrant model of DiPasquale and Wheaton (1992) (Figure 1).
Quadrant I represents the demand for real estate stock (D), which primarily depends on the economic circum- stances, mainly the income and the real estate stock (S).
Market equilibrium is achieved at the intersection of the two curves. Due to the short-term inflexibility of stock, the Table 1. Value of Construction Activities in Hungary (2000-2016)
Year 2000 2001 2005 2010 2015 2016
Value of construction activities (million HUF)
Residential buildings 59.694 124.566 170.266 101.158 96.369 190.479
Buildings total 397.109 471.129 669.614 591.231 684.585 779.628
Value of construction activities (percent of GDP)
Residential buildings 0,45 0,81 0,75 0,37 0,28 0,54
Buildings total 2,97 3,06 2,97 2,17 1,99 2,20
GDP at current prices (billion HUF)
13.350,1 15.419,1 22.559,9 27.224,6 34.324,1 35.420,3
Source: KSH (2017a)
balance rent charge mainly depends on the variations in demand. Quadrant II shows the variations of market prices (value) of real estates, which depend on the money flow expected from the property investment, where the main element is the rent charge (R), and these are also affected by the expected income from the investment (i). The expected income depends on the long-term interest rates as well as on the risks of the investment. If the long-term market interest rate or the risk increases, the slope of the curve also increases. Quadrant III represents new construc- tion. For the construction of new real estate, the market prices of real estate must exceed the construction costs, so the curve does not start from the origin. Finally, quadrant IV shows the variation of stock (e.g., quantity of residential properties), which is the difference of the newly construct- ed quantity (C) and the abandoned quantity (A). In the case of constant demand, these two quantities must be the same for the market equilibrium.
If the income increases, the demand curve (D) moves upward, so the rent charges also increase in the market, ac- cordingly; if the construction costs remain the same, more rentable properties are built, thereby increasing the supply, which ultimately leads to the decrease of rent charges. Ac- cording to the Friedman’s income hypothesis, households spend a constant proportion of their permanent income on housing; thus, according to DiPasquale and Wheaton (1992), if a family lives in a property owned by them, the housing costs, as with the installments of the mortgage and the utility costs, can be treated as rent charges payable by the household. If the income increases, households can afford to pay more on their housing, which also moves the demand curve upward, so the model is also suitable to assess housing markets, where ownership is predominant over rental.
When long-term interest rates decrease, property prices increase, so, presuming that all other conditions remain Source: Edited by the author, based on DiPasquale és Wheaton (1992)
Figure 1. Relationship Between the Real Estate Market and Real Estate Development
I.
II.
III. IV.
Stock (m²)
∆S = C – A P = Ri
Construction (m²) Price (HUF)
S Rent (HUF)
D
P
unchanged, the stock will also increase. It is similarly clear that any potential increase in construction costs will result in fewer new properties being constructed, which will increase property prices as well as rent charges.
When assessing the crisis of Houston’s housing market in the 1980s and the prices of residential properties, Smith and Tesarek (1991) proved, using the so-called two-dimen- sional price index, that the cyclic behaviour of the housing market is also affected by regional factors, e.g., employment conditions of the relevant region and migration. They also established that even a drastic decrease in property prices does not result in an immediate increase of demand, but achieving the market equilibrium again takes several, even three to four years.
By the beginning of the 1980s, nearly 200,000 jobs were lost in Houston due to the oil and gas industry crisis; thus, the number of households started decreasing rapidly. This was party due to the migration it started and partly because grown-up children moved away from the parents owing to the decreasing income and the lack of employment pros- pects, so the establishment of new households was delayed in time. Nevertheless, building residential properties contin- ued until 1983, so the number of empty residential properties doubled by the middle of the decade. Due to over-construc- tion, house prices decreased by an average of 30%, but there were regions where the decrease in value was nearly 40%
in the case of detached houses and 60% in the case of flats.
However, empty properties were mostly residential proper- ties built a few years earlier, where, owing to the decrease in value, the property no longer provided sufficient security for the mortgage debt. The concentration of empty prop- erties, however, was not stable, but it started to spread to other segments of the housing market because many people moved to a lower category property, while the new demand was mainly aimed at residential properties in good condition built a few years earlier, with prices significantly lower than before. As a result of such market correction, the propor- tion of empty residential properties effectively reached the pre-crisis level in all segments of the housing market by the end of the 1980s.
Wheaton (1999) established that the cyclic behaviour of various real estate market segments might differ in various aspects. Although the main reason of the cyclic behaviour of all sectors is in the economic cycles, there are market segments (offices, stores), where this relationship is not as close as in other segments (residential properties, in- dustrial properties). The shorter the transition period of property development is, and the more inflexible the stock is, the more effect the external factors have on the cyclic behaviour of the market. However, in the case of long tran- sition periods, and more flexible stock, internal cycles are
much more likely to develop, so the cycles of the relevant segment will be less aligned to the economic cycles. In the case of residential properties and industrial properties, the time period of property development is around one year, while in the case of offices and shopping centres, this may even take up to four to 10 years. The market stock of res- idences is much more flexible than the market of offices or stores, but, according to Wheaton (1999), there had not been sufficient information on industrial properties in the United States.
The cyclic behaviour of the property market was assessed in Hungary by Horváth et al. (2016). Horváth et al. (2016) described the market of offices based on profit, rental turnover, number of empty properties, and the variations of new completion in time. Their research proved that changes in the profits of investments in the market of offices had the first effects on the number of empty properties and rental turnover (with a delay of three to four months), while the reaction of rent charges and office constructions was delayed significantly more, and it roughly took one year.
From the second half of the 1990s, house prices increased rapidly on the American housing market; it stopped in the mid-2000s, and the prices started to decrease. Zhou (2010) was looking for an answer whether this effect is merely random, or the fall of the house prices are determined by market powers, thereby leading the property market toward the long-term equilibrium. During his research, he tested the long-term joint movement of the economic fundamentals (income, employment ratio, interest rates, etc.) and house prices. In many cases, earlier empiric research has not found any evidence on the long-term relationship of these factors and house prices, and Zhou believes that the reason for this is that these assessments presumed a linear relationship between the fundamental variables and house prices. In his research, he investigated the relationship of these fundamen- tal macroeconomic variables and property prices in 10 major cities of the United States, and he could only prove a linear relationship only in one metropolis, while this relationship proved to be nonlinear in six other major cities. With his method, there were only three cities, where the relationship between house prices and the economic variables could not be proven.
Neng Lai and Van Order (2017) assessed the long- and short- term relationship of house prices, rent charge indices and interest rates in 45 regions of major American cities. Based on the analysis of quarterly data between 1980 and 2013, the authors concluded that these factors affect house prices on the long-term regardless of the locality. On the short term, however, the market prices of residential properties are also affected by local factors of the cities, so the short- term effects of the assessed variables are not significant.
Due to the financial crisis started in August 2007, it was also proven that missed mortgage payments had a negative effect on property prices (Ascheberg, Jarrow, Kraft, & Yildirim, 2014).
Having analysed the cyclic behaviour and the efficiency of the housing market of the United Kingdom, Meen (2000) highlighted the importance of the interactions among house prices, construction costs, and interest rates in the forma- tion of high amplitude cycles. The operation of the property market is not efficient, so the excess supply of houses is a common characteristic of the market.
Davidoff (2013) has also analysed the rapid price increase affecting the American housing market in the first half of the last decade. While the negative correlation between the expansion of the stock and the prices was treated fun- damental, which was also supported by empiric research at the time of the price increase in 1980, the time period subject to Davidoff’s (2010) research has proven a positive correlation between the stock of residential properties and their prices.
Amongst others, the Hungarian housing market was studied by Hegedüs (2006), Kiss and Vadas (2006), Mádi (2008), Farkas et al. (2010), and Békés et al. (2016).
In their studies, Hegedüs (2006) and Mádi (2008) analysed the state policy regarding residential properties and the property subsidy systems in Hungary between 1990 and the first half of the 2000s. A main element of the subsidy system introduced in 2000 was the interest subsidy provided for mortgages. Some households brought forward their inten- tion to purchase their property, which generated a dynamic increase in state-supported mortgages, so budgetary funding of the introduced property policy was not sustainable for the long term. In the years following the political transformation, the real prices on the housing market decreased by 35–45%.
However, house prices increased by 100–150% between 1998 and 2001, which was slightly before the increasing number of mortgages after the 2000s. Subsequently, house prices increased even further until 2005, which was due to the increased demand. Hegedüs (2006) explained the change of demand resulted partly by the wide stabilisation of house- hold income and partly by the reallocation of savings in the money market to the property sector.
Mádi (2008) primarily analysed the positive effect of resi- dential construction and the housing market on the economic growth, the structure of the economy, employment, the equi- librium of public finances, lending, and growth of imports.
As he established, the expansion of the housing market in the first half of the 2000s was mainly the result of the an- nounced state policy on housing.
Kiss and Vadas (2006) studied the effect of the Hungarian monetary policy on the housing market in the first half of the 2000s. The authors found that the changes in interest rates did not have a large effect on the available income of house- holds and thereby to the demand for residential properties.
The reason for this is, first, the interest subsidy provided by the state, meaning that the interest rate risks were actually born by the state; second, mortgages with long interest periods were predominant, so their interest rates reacted to the changes of the key interest rate with a relatively long delay. The effect of interest rate changes on the prices, in- vestment, and house sales is limited to the Hungarian market.
In their agent-based simulation model, Farkas et al. (2010) investigated the role of social and individual learning in the adaptability of the housing market. Market operators on the housing market conclude transactions only rarely. The market is monitored before each purchase or sale, but market operators also strongly consider their previous experience as well. Farkas et al. (2010) concluded that learning based on individual information results in unstable adaptability, so price bubbles and crashes occur on the housing market from time to time.
Using a hedonic regression method based on the Hungari- an tax authority database, Békés et al. (2016) assessed the relationship of each town-level factor affecting the demand for residential properties in Hungary (natural properties, availability, educational and healthcare services, official classification) with the housing prices. On average, natural properties (especially nearby natural waters), accessibility by road or public transport, distance from institutions, and the administrative classification of the town are responsible for approximately 15% of the house prices in total. The prop- erties of the residential property explain approximately 30%
of the price variation. The four factors analysed by Békés et al. (2016) have a strong correlation with the size of the town and the average income of people living there, which are cruical factors for the prices in the housing market.
The previous domestic research focused mainly on the period from the beginning of the 2000s until the crisis, which was exclusively about demand and price increase. In this study, the behaviour of the Hungarian housing market is evaluated in respect of time from 2007, which is the year directly before the beginning of the economic crisis. In ac- cordance with the international trends, the crisis also caused a significant decrease in demand in Hungary concerning durable consumer products, including residential proper- ties. However, housing prices started to increase from 2011, which significantly accelerated in the past three years. The volume of remitted mortgages and state support had been decreasing every year from the beginning of the crisis and only started to increase again from 2014, which corresponds
to the beginning of the housing market expansion in progress today. The period passed since the beginning of the crisis is therefore suitable for analysing the cyclic behaviour of the Hungarian housing market.
The Hungarian Housing Market from the Political Transformation until the Economic Crisis
The events of the housing policy and housing market after the political transformation can be divided into three sections. In the period between 1990–1994, construction by the state (which was the main form of construction in the previous decades, even though it was hardly operational in the 1980s already) has completely ceased, and the division channels of the socialist housing system have been termi- nated. Before 1990, the Hungarian state provided massive amounts of mortgages with minimal interest rates through the only consumer bank operating at that time. This credit volume became extremely large by 1990. As a result of the sudden increase in unemployment in the years following the political transformation, households were unable to pay their mortgages, so the resolution of this credit volume could no longer be delayed. This was the period when the large- scale privatisation of state and council-owned rental proper- ties started, and this has a significant effect on the housing structure even today. The number of constructed houses de- creased year after year. Less than half as many houses were built in 1994 than in 1990.
In the period from 1995 until the turn of the millennium, the privatisation of the construction industry has been completed, and the institutions of the housing market have been established. New institutions appeared in financing, e.g., housing associations and banks providing mortgages.
The state subsidy provided for construction and purchase of houses has been increased substantially from 1995. The number of constructed houses had a slight increase until 1997; then it decreased significantly from 1998 (Hegedüs, 2006; Mádi, 2008).
The turning point for the housing policy was the year 2000;
new programmes started for supporting mortgages and for supporting the construction of rentable council houses. The construction of houses increased by 50% in one year, and such increase continued. By 2003, the interest rate sub- sidies by the state have effectively become impossible to finance from the national budget, so the government had to implement a significant correction of the housing support system (Hegedüs, 2006). At this time, the growth in the number of house constructions became slightly slower, but the turnover of the housing market kept increasing during
the economic boom until the crisis. The financing role of state-supported mortgages was gradually overtaken by currency-based mortgages, but these had an inherent risk concerning exchange rates.
Once the recession started, the decrease in demand has occurred first in the case of durable consumer products, especially for real properties, including residential prop- erties. Due to the uncertainty of their income prospects, households delayed their intention to buy their properties.
The decrease of house prices only followed the lower demand with a delay because most sellers were waiting, the offer prices started to decrease only after the crisis deepened.
Amongst the years preceding the crisis, the year 2007 was chosen for the starting year of further analysis because, in the case of certain indicators used for the analysis, statistical data are only available from this year.
Behaviour of the Hungarian Housing Market in Respect of Time from the Beginning of the Crisis until Today
Similarly to other durable consumer products, the behaviour of the Hungarian housing market is primarily aligned with the macroeconomic cycles. There is a strong relationship in the positive direction between the constant-price GDP and the specific price of newly constructed residential properties, which is indicated by the value of the correlation coefficient (r = 0.8725) (Figure 2).
According to our calculations, the variations of the GDP have an approximately 76% effect on the variance of the square-meter price of new residential properties (the value of the determination coefficient is R2 = 0.7613). The average specific price of new residential properties was continuously decreasing, with a total decrease of around 9% from the beginning of the economic recession started in 2008 until the year 2011 constituting the lowest point in prices, even though the output of the national economy showed a slight increase from 2009. Due to the inflexi- bility of the property market, residential property prices primarily depend on the demand (DiPasquale & Wheaton, 1992); this behaviour can be explained by houses being durable consumer goods because, if households consider their future income to be unstable due to the stagnation or decrease of their salaries or because of the increasing unemployment, they decrease their consumption primar- ily in relation to such things. The demand in the housing market is significantly affected by the provision of mort- gages and state subsidies, as a strong positive correlation
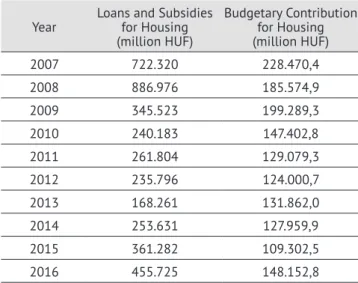
(r = 0.8166) is revealed between the remittance of mort- gages and subsidies and the specific price of new resi- dential properties. The amount of remitted mortgages and subsidies had a continuously decreasing trend from 2007 to 2013 (Table 2).
Table 2. Loans and Subsidies for Housing in Hungary (2007–2016)
Year Loans and Subsidies for Housing (million HUF)
Budgetary Contribution for Housing (million HUF)
2007 722.320 228.470,4
2008 886.976 185.574,9
2009 345.523 199.289,3
2010 240.183 147.402,8
2011 261.804 129.079,3
2012 235.796 124.000,7
2013 168.261 131.862,0
2014 253.631 127.959,9
2015 361.282 109.302,5
2016 455.725 148.152,8
Source: KSH (2017c)
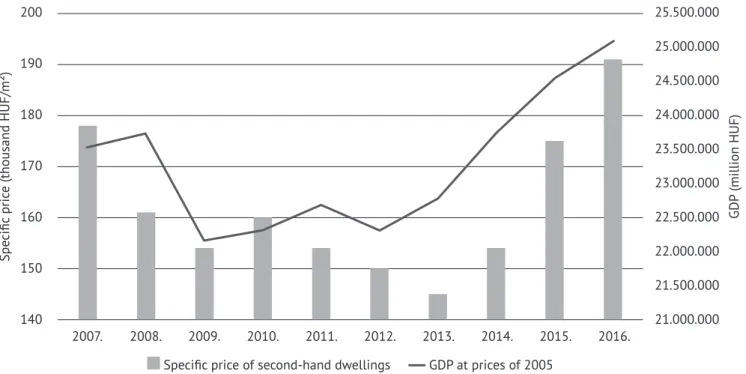
The correlation between the specific price of used res- idential properties and the gross domestic product (Figure 3) is slightly lower (r = 0.7963). Approximately
63% (r2 = 0.6341) of the price variance of used residen- tial properties is due to the GDP. The decrease of average square-meter price of used residential properties started a year earlier, and, even though it had a slight increase in 2010, it continued decreasing thereafter; this decrease lasted about two years longer compared with that of new residential properties. This market segment had over twice as much decrease (18.5%) in this period than in the case of new residential properties.
The change of specific prices of used residential properties had approximately one year of antecedence before the 2008 recession and about a 1–1.5-year delay at the end of the crisis.
The reason for the delay is that, due to the increasing demand from 2011, the stock of used residential properties gradually increased because a large proportion of people buying new properties changed their existing old house. The conclusion of this fact is that the demand on the market of used residential properties is far more flexible than in the case of the market of new residential properties. The inflexibility of demand means that, in the short term, the market can react to the increased demand only by raising the prices, as the change of quantity to be sold requires a longer period of time. In the case of new residential properties, this delay is primarily due to the time required for construction. In addition, as shown in the case of used residential properties during a crisis, sellers prefer to wait with the sale when house prices decrease, and, apart from forced sales, they try to restrict the demand. However, due to 2007.
Specific price (thousand HUF/m²)
2008. 2009. 2010. 2011. 2012. 2013. 2014. 2015. 2016.
330 320 310 300 290
280 270
260
25.500.000 25.000.000 24.500.000 24.000.000 23.500.000 23.000.000 22.500.000 22.000.000 21.500.000 21.000.000
Specific price of new dwellings GDP at prices of 2005 Source: KSH (2017b)
Figure 2. GDP and the Mean Price Per SQM of New Dwellings in Hungary (2007–2016)
GDP (million HUF)
the price increases in the recent years, the stock significantly increased on the secondary market as well.
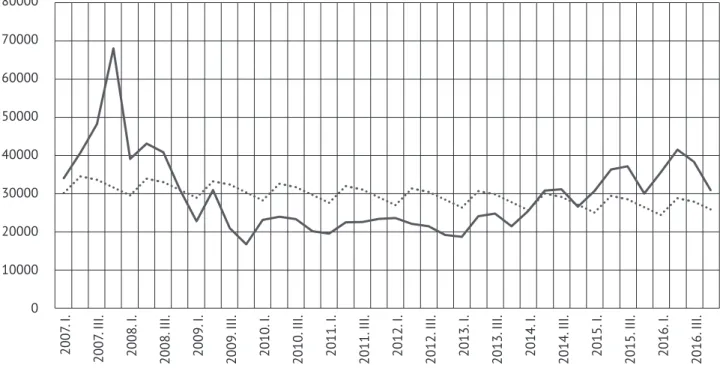
The housing market indices published by GKI Economic Research Co represent the expectations of estate agents and
the residents. Comparing the expectations of the housing market with the concluded sales transactions (Figure 4) supports the conclusion of Farkas et al. (2010) that the market operators form their future expectations based on recent events by monitoring the market.
2007.
Specific price (thousand HUF/m²)
2008. 2009. 2010. 2011. 2012. 2013. 2014. 2015. 2016.
200
190
180
170
160
150
140
25.500.000 25.000.000 24.500.000 24.000.000 23.500.000 23.000.000 22.500.000 22.000.000 21.500.000 21.000.000
Specific price of second-hand dwellings GDP at prices of 2005 Source: KSH (2017b)
Figure 3. GDP and the Mean Price Per SQM of Second-Hand Dwellings in Hungary (2007–2016)
GDP (million HUF)
2007. I. 2012. I.
Number of transactions 2007. III. 2012. III.
2008. I. 2013. I.
2008. III. 2013. III.
2009. I. 2014. I.
2009. III. 2014. III.
2010. I. 2015. I.
2010. III. 2015. III.
2011. I. 2016. I.
2011. III. 2016. III.
80000 70000
60000 50000 40000 30000 20000 10000 0
10 5 0 -5 -10 -15 -20 -25 -30 -35 -40 -45
Number of housing transactions Housing market index (Hungary) Source: Edited by the author, based on KSH (2017b) and data of GKI Economic Research Co.
Figure 4. Housing Market Expectations and Realized Transactions in Hungary
Housing market index
It is also revealed that expectations were much more realis- tic during the market downturn from the first quarter of 2008 to about the end of 2010 (the number of market transactions better confirm this) as in the case of expansion (from the fourth quarter of 2010), the expectations of market operators are rather over-optimistic.
It can be established by assessing the number of transactions in the housing market that the number of property sales depends on the season. The number of transactions decreases during the first and last quarters of the year, and the number of sales increases in the second and third quarters, which means that people much more likely to buy a residential property in spring or summer than in late autumn or winter. The corrected seasonal variation calculated from the number of completed transactions was –2,568 in the first quarter, 1,945 in the second quarter, 1,221 in the third quarter and –598 in the fourth quarter. Comparison of the seasonally corrected trend and the number of actual transactions (Figure 5) reveals that the number of house sales directly before the economic recession started in 2008 and, in the very beginning of the crisis, was especially high, which is mainly the result of the pro-cyclical behaviour of the inflexibility of the demand in the housing market. The number of transactions was below the trend during the crisis, but there was rapid growth from 2015.
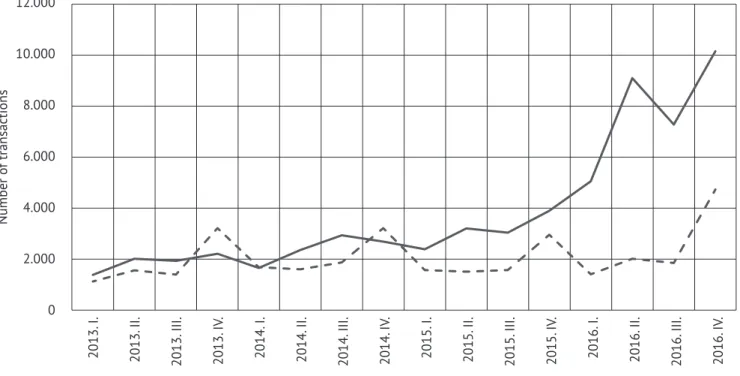
The expected behaviour of the market of new residential properties can also be assessed by the changes in the number
of construction permits and the number of new residen- tial properties built (Figure 61). The former has a slighter seasonal fluctuation, while this is more significant in the case of home construction. The corrected seasonal variation calculated from the number of constructed houses was –513 in the first quarter, –369 in the second quarter, –447 in the third quarter, and 1.329 in the fourth quarter.
Having compared the number of the issued construction permits and the number of completed and occupied houses, we show that length of construction is approximately one year, and it causes a delay with about the same length with regards to the cyclic behaviour of the market. The number of construction permits proliferated from the third quarter of 2015, while the same happened for the completion of houses only from the third quarter of 2016. This is presumably related to the family home creation support introduced in February 2016. Family home creation support is a state subsidy that can be used for the purchase or construction of new residential properties or for the purchase or extension of used houses.
The subsidy consists of non-reimbursable aid and interest rate subsidies provided for mortgages. The amount of the subsidy depends on the number of existing children and the contract- ed number of future children. The amount of family home creation support is significantly higher than the former state
1 Quarterly statistical data on construction permits and construc- tion of houses are only available from 2016.
2007. I. 2012. I.
Number of transactions 2007. III. 2012. III.
2008. I. 2013. I.
2008. III. 2013. III.
2009. I. 2014. I.
2009. III. 2014. III.
2010. I. 2015. I.
2010. III. 2015. III.
2011. I. 2016. I.
2011. III. 2016. III.
80000 70000
60000 50000
40000 30000 20000 10000 0
Seasonally adjusted trend Number of housing transactions Source: Edited by the author, based on KSH (2017b)
Figure 5. Seasonal Fluctuations in the Number of Housing Transactions in Hungary
subsidies. The amount of the nonreimbursable aid for new houses is between 600,000 and 10 million forints depending on the number of children, and it is between 600,000 and 2.75 million in the case of the purchase of used residential prop- erties. Families with three or more children may receive an interest rate subsidy. In the case of an interest rate subsidy, the state undertakes to pay part of the mortgage that is above 3%.
The ever-increasing number of constructed houses and the rapid increase of house prices raise the question whether there is a risk of an asset price bubble in the Hungarian housing market. A bubble is created regarding the price of an asset if it is significantly overvalued for a relatively long period of time. Property is deemed to be overvalued if its price exceeds the present value of the income expected in the future from its possession for a long period of time, which is called “intrinsic value” or “fundamental value.”
The amount of the bubble is the difference between the price of the property and its intrinsic value. The process of price bubble formation can be divided into several phases.
The first phase is the increase of the intrinsic value by an external factor. The subsequent phase is the boom phase, when demand for the undervalued asset increases due to the higher intrinsic value, so its market price starts to increase.
This phase is represented by increased lending and housing investments. The boom phase carries the highest risk that the price of the asset is not settled appropriately, and it becomes overvalued. If this overvaluation is only moderate,
a price bubble is not formed; in the professional literature this is called “price deflation.” However, if the market price becomes significantly higher than the intrinsic value for a long period of time, a price bubble is formed, and it also remains for longer. In order for the bubble to pop, an event needs to happen that leads the overall expectations of future prices toward a significant price decrease. As the amount of loans in the Hungarian market is significant, the correction of the market prices when the bubble pops carries the risk that the solvency of debtors deteriorates, as only a smaller income can be expected from the sale of the residential property (Lakos & Szendrei, 2017). The changes and the period of the boom during the housing market expansion from 2015 can be determined by the increasing prices and lending and by the expansion of construction of residential properties; however, the amount of overvaluation cannot yet be measured based on the available data. Although the risk of a housing market price bubble is present, only the next few years will tell whether it is actually generated.
Conclusion
The following key questions were mainly addressed by our research:
• How state grants and housing loans influence the general housing market cycles.
2013. I. 2015. III.
Number of transactions 2013. II. 2015. IV.
2013. III. 2016. I.
2013. IV. 2016. II.
2014. I. 2016. III.
2014. II. 2016. IV.
2014. III. 2014. IV. 2015. I. 2015. II.
12.000
10.000
8.000
6.000
4.000
2.000
0
Number of building permits issued Number of built residences Source: Edited by the author, based on KSH (2018)
Figure 6. Housing Construction in Hungary
• Whether the general expectations of market players have any meaningful effect, influencing the Hungarian housing market.
• Whether the time period required for new housing con- struction projects, and the seasonality factor alters the cycles seen on the housing market.
The cyclic behaviour of the Hungarian housing market may be explained primarily by business cycles. GDP affects the price variation of new residential properties approximately 76%, while in the case of price variations of used houses, this effect is 63%. A strong positive correlation can also be shown between the granted state subsidies and the price of newly constructed houses; thus, the expansion of mortgages and the massive amounts of easily accessible state subsidies can generate a so-called asset bubble on the market of residential properties. The expectations of market operators appeared more realistic at the beginning of the recession compared with the period of recovery from the crisis, when the market turnover was systematically below the expectations. This means that the expectations of market operators do not have a demonstrable effect on the Hungarian housing market.
The number of transactions on the housing market as well as the construction of houses significantly varies by the seasons of the year. There is a significant peak in the second and third quarters for property purchases and in the fourth quarter for completed houses.
Having compared the number of the issued construction permits and the number of completed and occupied houses, it shows that the length of construction is approximately one year, which causes a delay with about the same length with regards to the cyclic behaviour of the market. The significant expansion of the construction of houses seems to be related to the introduction of a new state subsidy, the family home creation support in February 2016. The Hun- garian property market has been expanding since 2015, which is present by the increasingly growing prices and also in the expansion of construction of residential proper- ties and mortgages.
The stock of second-hand residential properties in the Hun- garian property market looks more flexible compared with that of new properties. Because of the short-term inflexi- bility of stock, variations of market prices depend mainly on demand. Apart from those evaluated in our study, the demand for residential properties is affected by numerous other, mainly local, factors, including transport infrastruc- ture, various levels of service centres, availability of educa- tional and other institutions, public safety, and the condition of public spaces. For the majority of these factors, their effect on Hungarian property prices and the cyclic behaviour of the market is yet to be explored. The price increase of the past years carries a risk of developing a price bubble in the housing market, which may also be the basis for further research in the following years.
References
Ascheberg, M., Jarrow, R. A., Kraft, H., Yildirim, Y. (2014). Government policies, residential mortgage defaults and the boom and bust cycle of housing prices. Real Estate Economics, 42, 627-661. https://doi.org/10.1111/1540-6229.12041
Békés, G., Horváth, Á., & Sápi, Z. (2016). Residential real estate prices and settlement differences (In Hungarian: Lakóingatlanárak és települési különbségek). Economic Review, 63, 1289-1323.
Davidoff, T. (2013). Supply elasticity and the housing cycle of the 2000s. Real Estate Economics, 41, 793-813. https://doi.org/10.1111/1540- 6229.12019
DiPasquale, D., & Wheaton, W. C. (1992). The markets for real estate assets and space: A conceptual framework. Journal of the American Real Estate and Urban Economics Association, 20, 181-197. https://doi.org/10.1111/1540-6229.00579
Farkas M., Horváth Á., & Vincze J. (2010). Agent learning in the housing market’s Wheaton model (In Hungarian: Ágens alapú tanulás a lakáspiac Wheaton-féle modelljében). The 4th Annual Conference of the Hungarian Society of Economics, Working paper,1-16.
Gudell, S. (2018. január 3). Total value of all U.S. homes. Forbes. Retrieved from https://www.forbes.com/sites/zillow/2018/01/03/total- value-of-all-u-s-homes-31-8-trillion/#51afa7793ca8
Hegedüs, J. (2006). Housing policy and housing market – limitations of public policy (In Hungarian: Lakáspolitika és lakáspiac – a közpolitika korlátai). Esély: Social Policy Journal, 17(5), 65-100.
Horváth, Á., Révész, G., & Sápi, Z. (2016). Yields, take-up, vacancy, rents and new supply during office market cycles (In Hungarian: Irodapiaci ciklusok jellemzése a hozam, a bérleti forgalom, az üresedés, a bérleti díjak és az új átadás alapján). Economic Review, 63, 113-136.
Kiss, G., & Vadas, G. (2006). The role of the housing market in monetary transmisson (In Hungarian: A lakáspiac szerepe a monetáris transzmisszióban). Economic Review, 53, 408-427.
KSH (2017a). Yearbook of industrial and construction statistics, 2016 (In Hungarian: Ipari és építőipari statisztikai évkönyv, 2016). Budapest:
Hungarian Central Statistical Office.
KSH (2017b). Statistical mirror: Housing prices, housing price index, Quarter 3 2017 (In Hungarian: Statisztikai Tükör: Lakáspiaci árak, lakásár- index, 2017. III. negyedév). Budapest: Hungarian Central Statistical Office.
KSH (2017c). Statistical mirror: Housing credits, Half 1 2017 (In Hungarian: Lakossági lakáshitelezés, 2017. I. félév). Budapest: Hungarian Central Statistical Office.
KSH (2018). Built dwellings, ceased dwellings, built resorts (In Hungarian: Lakásépítés, lakásmegszűnés, üdülőépítés). Retrieved from http://www.ksh.hu/docs/hun/xstadat/xstadat_evkozi/e_zrs001.html
Lakos, G., & Szendrei, T. (2017). The explanation of asset price bubbles (In Hungarian: Az eszközárbuborékok magyarázatai). Financial and Economic Review, 16(4), 122-150.
Mádi, L. (2008). Housing policy – home building: Events and experiences from the recent past of Hungary (In Hungarian: Lakáspolitika – ot- thonteremtés: Történések és tapasztalatok a közelmúlt magyarországi időszakából) (Doctoral dissertation). Retrieved from http://www.
nyme.hu/fileadmin/dokumentumok/ktk/Kepzes_doktori/2008/2008_MadiLaszlo_d.pdf
Meen, G. (2000). Housing cycles and efficiency. Scottish Journal of Political Economy, 47(2), 114-140. https://doi.org/10.1111/1467- 9485.00156
Neng Lai, R., & Van Order, R. (2017). U.S. house prices over the last 30 years: Bubbles, regime schifts and market (in)efficiency. Real Estate Economics, 45, 259-300. https://doi.org/10.1111/1540-6229.12127
Smith, B. A., & Tesarek, W. P. (1991). House prices and regional real estate cycles: Market adjustments in Houston. AREUEA Journal, 19, 396-416. https://doi.org/10.1111/1540-6229.00559
U.S. Census Bureau. (2017). Monthly construction spending, December 2017. Letöltve: https://www.census.gov/construction/c30/pdf/
pr201712.pdfml
Wheaton, W. C. (1999). Real estate “cycles”: Some fundamentals. Real Estate Economics, 27, 209-230. https://doi.org/10.1111/1540- 6229.00772
Zhou, J. (2010). Testing for cointegration between house prices and economic fundamentals. Real Estate Economics, 38, 599-632.
https://doi.org/10.1111/j.1540-6229.2010.00273.x
Author
László Harnos is a PhD candidate of István Széchenyi Management and Organisation Sciences Doctoral School at Lámfalussy Sándor Department of Economics, University of Sopron, Hungary. He received his MSc in business and management in 2009 at the Faculty of Economic and Social Sciences, Budapest University of Technology and Economics, Hungary. He teaches finance and real estate valuation in vocational training. His research topics include real estate economics and regional and urban development.
Cikli stanovanjskega trga na Madžarskem od ekonomske krize do danes
Ključni cilj tega članka je prepoznati osnovne razloge za ciklični značaj madžarskega stanovanjskega trga, še posebej poslovnih ciklov, gradbenih projektov in pričakovanj tržnih udeležencev. Raziskava temelji na analizi statističnih podatkov in indeksov stanovanjskega trga. Izsledki raziskave kažejo, da je cikličnost stanovanjskega trga možno pojasniti pretežno s poslovnimi cikli, vendar državne subvencije in hipoteke prav tako vplivajo na variacije. Torej lahko naraščajoče posojanje in visok znesek subvencij ustvarjata cenovni balon. Ponudba rabljenih stanovanj izkazuje večjo prilagodljivost kot ponudba novih stanovanj. Kakorkoli, pričakovanja tržnih udeležencev nimajo jasnega učinka na stanovanjski trg.
Ključne besede: trg nepremičnin, cikli stanovanjskega trga, cenovni balon dobrin