D E V E L O P M E N T S I N N O N - D I S P E R S I V E I N F R A - R E D A N A L Y S E R S
D. G. A V E R Y and C. D. R E I D
United Kingdom Atomic Energy Authority (Development and Engineering Group), Research and Development Branch, Capenhurst, Chester, England
Non-dispersive infra-red analysers have long been used as plant instruments.
The best-known form is the " I R G A " instrument [4] based on the original detector developed by Luft. In recent years an alternative form has been developed [1, 2] in which the spectral discrimination is given by narrow
band interference filters rather than by the absorption characteristics of the detector. The instruments described in this paper, for which patent applications have been made [3], have important advantages over previous conventional analysers. In particular, while possessing the same freedom from source and electronic drifts as existing double-beam instruments, they are also insensitive to changes in sample-tube transmission. Dirty or corro
sive samples can therefore be accommodated by the instruments, whereas conventional analysers would not be free from error.
Interference-filter instruments are of greatest potential where the ab
sorption spectra are such that all the wanted information can be unambi
guously derived from a single absorption line at a relatively short wavelength, say less than 6 μ. In this case the high degree of spectral resolution offered by the filter can be combined with the high radiation sensitivity of a photo- conductive detector to give an arrangement capable of detecting very small quantities of trace impurities. The single optical path also results in a substantially simpler instrument with possibly greater reliability and reduced cost.
One such instrument for the analysis of hydrogen fluoride in process-gas streams has been described by Harrison and Reid [1]. This device, called for convenience the Mark la analyser, has been redesigned as the Mark l b to give greatly improved performance for analysis of hydrogen fluoride, and a further design (the Mark Ic) can clearly be the basis for instruments to deal with a variety of other problems.
T H E M A R K l a A N A L Y S E R
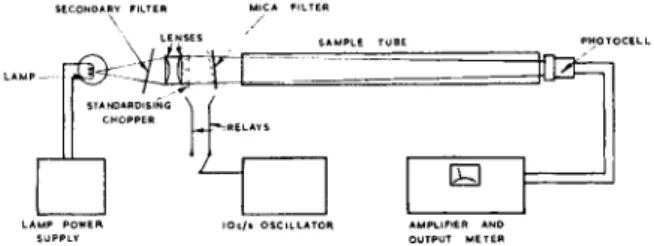
Details have already been published [1], but a brief description will demonstrate the principles of these interference-filter instruments. Fig. 1 shows the layout of the instrument.
30 - 60143045 I & Μ
LENSES SAMPLE TUBE
IOc/t OSCILLATOR
Fig. 1.—General arrangement of Mark la analyser.
The instrument works by comparing the intensity of light transmitted at a wavelength absorbed by the sample with that of an adjacent absorption- free wavelength (Fig. 2). The necessary wavelength discrimination is ob- tained by means of an appropriate interference filter; in the hydrogen fluoride detector this is a mica-spaced filter of comparatively high resolution.
The shift from the "sample" wavelength to the "reference" wavelength is achieved by tilting the filter through an angle sufficient to change the wavelength of its pass band by the required amount.
A secondary filter isolates the desired transmission bands of the high- resolution mica filter and also allows the "sample" and "reference" beams to be balanced in intensity with no sample in the absorption cell. The high- resolution filter is tilted back and forth at 10 c/s, so that a 10 c/s output signal, proportional to the difference in intensity between sample and refer- ence beams, is given by the lead sulphide detector. If the two beams are initially balanced, this signal is a direct measure of the absorption at the sample wavelength.
If the sample tube suffers a loss in transmission, both sample and refer- ence beams are equally affected, provided that the loss is uniform over the narrow wavelength band concerned; thus, an error is introduced propor- tional to the extent of the loss in transmission. T o correct for these changes and for any changes in photocell sensitivity and amplifier gain, a standard- izing chopper was used in the Mark la instrument. This introduced a fixed interruption of about 20 per cent in the light path, so that the gain of the amplifier can be adjusted to give a standard reading from the instrument.
The Mark la has no built-in compensation for relative changes in lamp 'reference'
Fig. 2.—Wavelength cha- racteristics of analyser.
Developments in non-dispersive infra-red analysers 461
PRIMARY FILTER
SAMPLE TUBE PHOTOCE
(F
-43-2c/» OSCILLATOR
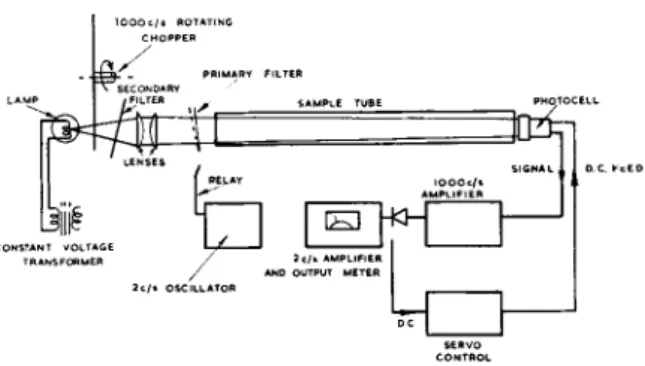
Fig. 3.—General arrangement of Mark lb analyser.
emission at the two wavelengths caused by changes in lamp temperature; it was obviated by using a photoelectrically controlled lamp power supply.
T w o instruments of this type have been in use for nearly a year, detecting hydrogen fluoride in the process-gas stream of the Diffusion Plant of the U . K . A . E . A . at Capenhurst. A t the end of its period of service one was found to have suffered a loss of 95 per cent of its sample-tube optical trans- mission. It could still be standardized and its calibration remained un- affected. A conventional form of analyser would have been heavily handi- capped in such circumstances, and it is doubtful whether any of the alter- native forms of instrument would have given satisfactory service.
T H E M A R K l b A N A L Y S E R The instrument
The layout of this instrument is shown in Fig. 3. The optical parts have been changed in some particulars: a shutter which interrupts the light beam at about 1000 c/s has been introduced and the standardizing chopper re- moved. The primary filter relay now operates at a lower frequency, about 2 c/s. The light falling on the detector is thus interrupted at 1000 c/s, with an extra modulation at 2 c/s imparted by the tilting primary filter.
The detector output signal is amplified by two amplifiers, in cascade.
The first amplifier is tubed at 1000 c/s; this signal is then rectified and the 2 c/s sample signal modulation extracted and fed forward to the second amplifier. Since the 2 c/s modulation is only a few percent of the total intensity, the D.C. component of the rectified 1000 c/s signal is a fairly accurate measure of the total intensity passing through the system. This D.C. signal is used in a servo arrangement to control the voltage applied to the lead sulphide cell, and hence to change its sensitivity so that a con- stant D.C. output is obtained regardless of changes in sampletube trans-
brings the 2 c/s signal up to a measurable level before it is phase-sensitively rectified to give the final output. This output is proportional to the absorp
tion in the sample.
Simple analysis of method of compensation
A simple analysis makes this clear. The quantities independent of wavelength may be defined as: G, 1000 c/s amplifier gain; g, 2 c/s amplifier gain;
T, sample-tube transmission; and R, response of photocell in volts per incident photon.
The quantities depending on wavelength are: Ql9 Q2 = the photons/
second entering the sample tube in the appropriate wavelength intervals;
and al 5 a2 = the corresponding absorption in the sample. Here suffix 1 indicates the reference wavelength, and suffix 2 the sample wavelength. By definition CL+ = 0.
If V1 and V2 are the 1000 c/s amplifier output voltages (see Fig. 3), then V1=GRTQ1 and V2 = GRTQ2 (1 - a2) .
The action of the servo-system is to arrange that (Vx + V2)/2 is a constant, K, so that we can write
GRT[Q1 + Q2(l-x2)]=2K.
The 2 c/s output signal, S ^ g ^ - V2) is then given by
The secondary filter is so arranged that Qx = Q2; hence g2Koc2
0 - α2) '
Since a2 is very small for low sample levels, S = g-2Koc2 to a good approxi
mation.
Thus the only instrumental parameter left uncompensated is the gain of the 2 c/s amplifier, g, which is low and practically constant.
If the lamp temperature changes so that Q1Φ Q2, then ο g- 2 ^ [ ( e i/ g2) - ( i - «8) ]
Κ β ι / β2) + 1 ]
and it is clear that, for small changes of source temperature, a degree of compensation is afforded, since Qi/Q2 will change less rapidly than either
Developments in non-dispersive infra-red analysers 469
INSTRUMENT READING
PARTIAL PRESSURE OF HYDROGEN FLUORIDE.
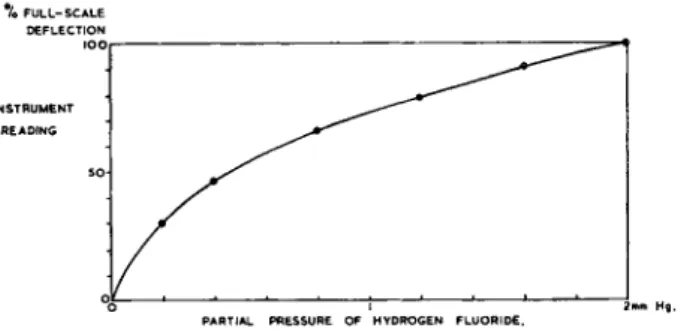
Fig. 4.—Typical calibration of hydrogen fluoride meter.
Qi or Q2- It is therefore possible to dispense with any special lamp power supply: a constant voltage transformer is all that is needed.
The chopping at 1000 c/s effects further improvement over the Mark la analyser, since the signal-to-noise ratio of the lead sulphide cell is much greater at this frequency than at 2 c/s.
Performance of the Mark lb analysers
Although obviously suitable for other applications, the Mark l b has been used primarily as a hydrogen fluoride detector.
The limit of performance for hydrogen fluoride could not be assessed directly. Hydrogen fluoride is a difficult gas to handle; at high pressure it polymerizes easily, and moreover it is highly reactive and adsorbs strongly.
In consequence, stable concentrations of known value appear practically impossible to achieve. The detection limit for the instrument had, therefore, to be estimated from signal-to-noise ratios. It appears that the instrument should detect a partial pressure of less than 2 μ of hydrogen fluoride in a total pressure of 1 atm. A full-scale deflection for 200 μ partial pressure at a noise level of + 1 per cent is therefore achievable. A typical calibration curve is given in Fig. 4; the law of the calibration is as previously described for the Mark la analyser [1].
T H E M A R K I c A N A L Y S E R
The instrument
Although the Mark lb analysers are satisfactory for the application for which they were designed, further improvements are possible. The main disad
vantages of the Mark lb are: firstly, because the high-resolution filter isolates a single rotational fine-structure line, a small part only of the available spectral information is used; and, secondly, because a high-resolution filter is used, the nominal aperture of the system must be kept low (f/8 to f/10).
*/o FULL-SCALE DEFLECTION
CHOPPER
- 4 - -
IMP
PRIMARY FILTER SECONOARY FILTER SLIT / PHOTOCELL SAMPLE TUBE
Lliil
OSCILLATOR AMPLIFIER ANO OUTPUT
METER
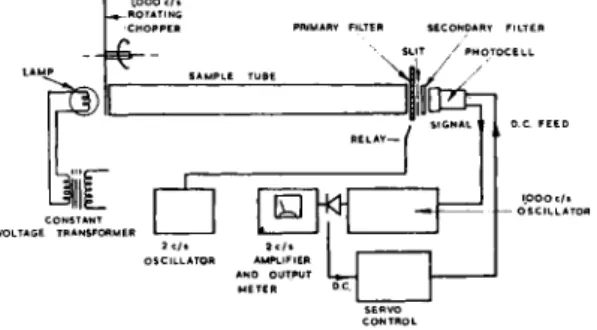
Fig. 5.—General arrangement of Mark Ic analyser.
The Mark Ic has been designed to avoid these defects. In this instrument, the primary filter is made with two areas of different transmission wave
lengths. This is moved by the relay so that the light beam passes alternately through each half of the filter, thus achieving the wavelength stepping action. This system allows a larger spectral signal to be obtained, since it is now possible to use a complete band or branch instead of a single line.
Because the filter is of comparatively low resolution, the restriction on nominal aperture can be relaxed, and apertures of f/4 are practicable. The increase in aperture can be achieved by using the sample tube as a colli
mator. In this form, the lamp is brought close to one window of the sample tube, and the primary filter is arranged close to the other window. A slit is placed immediately in front of the secondary filter, and the detector is as close as possible behind it, as shown in Fig. 5. The light path in free air is thus reduced to less than an inch, which is an advantage if atmospheric gases such as water vapour or carbon dioxide are to be detected.
With a fixed secondary filter, another method is required for balancing the instrument at zero sample. This is achieved by using another set of the relay contacts to switch the gain of the amplifier, so that balancing is now done electronically and not optically.
In other respects, i.e. the use of a 1000 c/s chopper, two-section amplifier and stabilizing feedback, the instrument is similar to the Mark lb.
Performance of the Mark Ic analyser
This instrument has been made as a water-vapour detector, operating at the water band at 2.7 μ. With a nominal aperture of f/4, and a sample tube 30 cm long, the ultimate sensitivity (signal-to-noise ratio of one) of the instru
ment is 1.5 μ water vapour in a total pressure of one atmosphere.
Developments in non-dispersive infra-red analysers 4 7 1
R E F E R E N C E S
1. HARRISON, J. A. and REID, C . D., /. Sei. Instr. 36, 240 (1959).
2. PARSONS, J. L., IRLAND, M. J. and B R Y A N , F . R . , /. Opt. Soc. Am., 46, 164 (1956).
3. REID, C . D. et al, British Provisional Patent Applications 28485/57, 35304/58, 5525/59 and 16570/59 ( 1 9 5 7 - 5 9 ) .
4. United Trade Press Ltd. The Instrument Manual, p. 133. United Trade Press Ltd., London, 1953.
F U R T H E R D E V E L O P M E N T S
These instruments are new and there appears to be no reason why they cannot be made to detect substances having absorption spectra within at least the wavelength range 0.4-7 μ, i.e. the range for which detectors of short response time are available. This range would allow carbon monoxide, carbon dioxide, nitrous oxide, ammonia, methane, hydrogen chloride, hydrogen bromide and other compounds to be detected. It also appears possible to construct liquid absorptiometers, working on the same prin
ciples.
This paper is published by permission of Sir William Cook, Managing Director, and Dr. H. Kronberger, Director of Research and Development, of the United Kingdom Atomic Energy Authority (Development and Engineering Group).