RHEOLOGY IN MOLDING C. E. Beyer and R. S. Spencer
I. Introduction 505 II. The Injection Molding Machine 506
1. Description of the Machine 506 2. Description of the Controls 508 3. The Injection Molding Process 509 III. The Injection Molding Cycle 510
1. The Function of the Injection Temperature and Pressure 510
2. The Mold Pressure Cycle 513
IV. Filling the Mold 514 1. Description of Flow into the Mold 514
2. Fill Time Equation 520 V. Packing in the Mold 524
1. Description 524 2. Pressure Losses in the Injection Molding Machine 525
3. Equation of Pressure Loss 529
4. Residual Strains 531 VI. Discharge and Sealing 535
1. Description 535 2. Seal Line 536 VII. Sealed Cooling 537
1. The Equation of State 537 2. Mold Opening Conditions 540 3. Conformity to Mold 541
VIII. Cycle Time 542 1. Limiting Cycle 543 2. Molding Diagram 544 3. Moldability 548 Nomenclature 550 General Bibliography 551
I. Introduction
Injection molding is one of the principal methods by which thermo- plastics are fabricated. The conditions that exist in the injection molding machine have presented many new and interesting rheological problems.
Most of the problems encountered in the process of injection molding are far too complex to attempt rigorous theoretical solutions. Consider for a
505
moment the difficulties involved in a mathematical treatment of a hot non-Newtonian compressible liquid flowing through a geometrically com- plex channel, the walls of which are much colder than the liquid. It is little wonder that in the past, injection molding has been left to develop, for the most part, as an empirical art. Even though obtaining exact theoretical solutions to many injection molding problems is not practical, considerable knowledge of the process can be obtained from various approximations and idealizations which result in only semiquantitative agreement with experience. Such an approach may be used to sketch in the broad forms of relationships, whose finer details can be filled in by suitable experiments.
An attempt will be made in this section to indicate the rheological prob- lems in injection molding and to show how the various flow conditions blend into the more complex situation that we call the Injection Molding Cycle. Most of this work has been done with polystyrene, but the same types of relationships may be expected for other noncrystalline thermo- plastics.
II. The Injection Molding Machine 1. DESCRIPTION OF THE MACHINE
In the fabrication of any thermoplastic resin, the basic process consists of (1) heating the polymer to a relatively fluid state, (2) forming the de- sired shape in the mold, (3) cooling this molding to a solid mass. An injec- tion molding machine is shown in Fig. 1. It can be described in terms of six basic components: (1) a feeding mechanism to meter out a constant
PRECISION FEEDING
3 0 0 ° F - 7 0 0 ° F TIME PRESS TEMR
COMPONENTS OF INJECTION . MOLDING MACHINE
FIG. 1. Schematic drawing of an injection molding machine comprising: (1) feeder, (2) plunger, (3) tunnel, (4) mold, (5) clamping device, and (6) controls.
amount of material for each molding; (2) a plunger or ram to move the polymer through the heating cylinder at an appropriate pressure; (3) a cylinder in which the polymer is heated to a molten condition; (4) a preci- sion-built mold comprising two or more sections which may be opened to remove final product; (5) a clamping mechanism to hold the sections of the mold together; and (6) a system of timers to control the sequence of operation of the injection molding cycle.
The feeding mechanism may be governed either volumetrically or gravi- metrically. A volumetric feeder usually consists of a simple sliding chute placed between the hopper of the feeding system and the heating chamber.
The polymer is placed into the hopper as pellets and a portion of it falls into a sliding chute. During the injection stroke the chute moves forward, carrying with it a specified volume of polymer which is then released on top of the ram. When the ram returns, the slide travels back into position below the hopper to receive more polymer and the polymer on the ram falls in front of the ram, ready to be pushed into the heating chamber on the next stroke. In weigh feeding the volumetric mechanism is replaced by a sensitive balance device which delivers an exact weight of polymer into the heating cylinder. Since there are some variations in the bulk density of the granular material, weigh feeding gives a more exact control of the amount of material introduced into the mold.
Once the mold is closed the plunger moves forward, pushing cold granules ahead of it into the heating chamber and simultaneously forcing the same amount of molten polymer through a nozzle connecting the front end of the heating chamber with the mold. After holding the pressure on the polymer in the mold for a specified length of time the ram will return to its rear position to await the next cycle.
The heating chamber usually consists of a hollow steel cylinder, jacketed on the outside by electrical heaters. Because of the low thermal conductivity of thermoplastics it is desirable to spread the polymer into a thin layer to obtain more rapid heating. A spreader, or "torpedo," is placed inside the heating chamber for this purpose. However, this torpedo may so restrict the flow of polymer that a large percentage of the pressure exerted by the ram is dissipated in the heating cylinder. To avoid this effect many of the larger molding machines are equipped with preplasticizers, which consist of two consecutive cylinders, each with its own ram. The first cylinder contains a conventional torpedo and is used for heating the polymer. The second cylinder contains no torpedo and leads through a nozzle to the mold.
The absence of a torpedo and unmolten polymer permits a greater per- centage of the ram pressure to be transmitted into the mold.
The molten polymer moves from the heating chamber through a system of passages into the mold cavity. A conventional mold consists of essentially
three parts: (1) a stationary (cavity) part; (2) a movable (core) part; and (3) an ejector plate with knockout pins in the movable portion of the mold to assist in removing the finished piece from the mold. The mold is clamped between the two platens of the molding press, one of which is stationary and holds the cavity portion of the mold in contact with the nozzle of the heating cylinder. The second platen is movable and allows the mold to be opened upon completion of the molding cycle. It is actuated by a clamping mechanism which also holds the mold halves together while the polymer is being forced into the mold. The clamping mechanism may consist of a hydraulic cylinder or a hydraulically activated toggle.
2. DESCRIPTION OF THE CONTROLS
The three primary variables which govern the operation of the injection molding machine are temperature, pressure, and time. The heating cylinder temperature is maintained at some constant value, usually between 400 and 700° F. At these conditions most polymers have a sufficiently low vis- cosity to fill the mold with the available ram pressure. The temperature of the heating chamber is maintained by pyrometers connected to the heaters.
These are activated by thermocouples imbedded in the cylinder body. The mold is usually held at a relatively constant temperature by means of water flowing through passages surrounding the mold cavity. Mold temperature is regulated either by the amount of water flowing through it, or by control- ling the temperature of the water. Ordinarily a range of 90 to 180° F. is used to give a desirable surface luster to the molding.
The injection pressure is set to fill the mold and to develop a hydrostatic pressure in the mold to compensate for the shrinkage of the polymer during cooling. Thus, the right combination of the heater temperature and injec- tion pressure will result in a molding that is an exact reproduction of the mold cavity. The two halves of the mold are clamped together either by a hydraulic cylinder or a hydraulically actuated toggle system. This pressure must be maintained high enough to prevent the mold halves from separat- ing under the injection pressure.
A set of timers on the injection molding machine control the sequence of operation. The first one activated in the cycle controls the length of time that the ram remains in its forward position. When this timer returns the ram to its initial position, another is activated which controls the cooling time and at the end of this time period the mold opens for removal of the molding. This ensures adequate cooling of the article before it is removed from the mold. There are usually two additional, less important timers.
One gives the injection ram an extra stroke, thereby obtaining a larger shot. The other regulates the time that the mold remains open for removal of the molding and thus provides a more uniform cycle.
3. T H E INJECTION MOLDING PROCESS
There are six major controls available to the operator of the molding machine: (1) temperature of the heating chamber; (2) pressure applied by the ram; (3) the "plunger forward" time; (4) the "mold closed" time; (5) the "mold open" time; and (6) the mold temperature.
The technique of adjustment of these controls and the nature of the polymer are the means by which the acceptability of the finished article is determined. Most of these controls are indirect and are interrelated in some complex manner in their effect on the quality of the finished molding.
Before discussing the relations between the controls and the molding let us first consider the flow of polymer through the molding machine.
In the injection molding process a specified volume shot of polymer is fed from the hopper and pushed into the heating chamber by the ram on its forward stroke. Ordinarily, the polymer will take several cycles to move through the heating chamber since the amount of polymer in the heating chamber is at least twice the maximum shot size of the machine. Hence, the amount of time the material will remain in the heating chamber will depend upon both the cycle time and the shot size. The molten polymer leaves the heating chamber through the nozzle and proceeds to the mold cavity via the sprue, runners, and gate. The latter is a restricted passage at the entrance to the mold cavity. After the mold is filled the ram pressure is maintained for a short time. This packs a little more polymer into the mold to compensate for contraction of the polymer during cooling. Some of the polymer is then discharged back out of the mold after the plunger has released its pressure. Following discharge, the polymer in the gate (which is usually the smallest restriction in the mold passages) will be solid enough to withstand the pressure in the mold and will seal the mold cavity from the rest of the system. When a weigh feeder is used the discharge step can be eliminated from the cycle. Here the exact weight of polymer required to make a full molding is forced into the mold. Therefore, the plunger can remain in its forward position until the gate has sealed. It will be shown later that the elimination of discharge greatly reduces the amount of strain in the molded article. The polymer will then cool under conditions of constant mass and constant volume unless the pressure reaches zero during cooling. When the article has cooled to a point where it can be removed from the mold, the rear half of the mold will open and separate from the rest of the mold. As the mold opens, the ejector plate with the ejector pins moves forward, pushing the molding off the core. After the piece is removed from the mold it closes again and the cycle is repeated.
The above discussion indicates that the injection molding cycle may be broken down into the following steps: (1) the dead time, comprising the period from when the plunger starts forward until the polymer begins
flowing into the mold; (2) filling; (3) packing; (4) discharge; (5) sealing;
and (6) sealed cooling.
III. The Injection Molding Cycle
1. T H E FUNCTION OF THE INJECTION TEMPERATURE AND PRESSURE
As mentioned previously, the six major controls in the molding machine operate interdependently to determine a set of variables which are more directly related to the acceptability of the molded article. The primary variables which determine the quality of the molded article are the pressure and temperature of the polymer, particularly at the time the gate seals and when the mold opens. To determine the relationship between the ma- chine controls and the primary variables it is desirable to know these quantities as a function of time after the mold is filled. Given the geometry of the mold, the temperature of the polymer as it enters the mold, and the mold temperature, the average temperature of the piece may be computed as a function of time from heat conduction theory. This calculation involves idealization of actual conditions, but results can be obtained which are sufficient in most cases to give a relatively accurate picture of what is happening in the mold during the various portions of the cycle. Equations that may be used as approximations for many cases are:
Τ - To θ ==
Slab
^ 8 f 1 / ~ ( 2 n - l)Vh2t\ m
Sphere
θ = -
2Σ -
2β χ
Ρ^ - ^ - ; (2)
Cylinder
where Τ = the average polymer temperature, 2\· = the original tempera- ture of the polymer, T0 = the surface temperature of the mold, t = time, L = the thickness of the slab, R = the radius of the cylinder or sphere, h2 = the thermal diffusivity of the material = (thermal conductivity)/
(specific heat)(density), an = the positive roots of the Bessel's equation J0(aR) = 0. The functions defined by these equations are shown in Fig. 2.
Most of the polymers ordinarily used in the injection molding machine are very poor conductors of heat and they normally do not remain in the heating chamber long enough to reach the temperature of the cylinder wall. Therefore the polymer temperature as it leaves the nozzle and enters the mold not only depends upon the heater settings but also upon the rate at which the plastic moves through the heating chamber. By the use of a specially designed thermocouple in the nozzle, the plastic temperature can be measured and related to the heater settings and output rate, so that the average temperature at which the plastic enters the mold is known.
Figure 3 shows the observed relationship between the heating efficiency and the output rate of a typical injection molding machine. The heating efficiency is defined as
Ε = (Average plastic temperature) — (Room temperature) (Cylinder wall temperature) — (Room temperature)
This relationship permits calculation of the average plastic temperature at any time during the molding cycle from the given machine conditions.
FIG. 2. Reduced average temperature from heat conduction theory
512 C. E. BEYER AND R. S. SPENCER
I.O
0.9
0.8
E
0.7
0 £k
J
1 1—
J
1 1 —— I Ι
1 Cham ier Rat I
—
\
—
1
! !
Manu
1 1
1
acturer' Rated
1
Capac t y - - ^
!
10 2 0 30 4 0 5 0 6 0 70 8 0 90 Pounds per Hour
Fig. 3. Heating curve of an injection molding machine
The hydraulic system of the molding machine operates to exert a prede- termined pressure on the injection ram. There is a large pressure drop through the granules which will vary with the amount of unmelted polymer ahead of the ram and the temperature of the cylinder wall around these granules. There will also be a pressure drop through all of the restrictions and channels between the ram and the mold, and even through the mold cavity itself. Thus, for any given injection pressure, the pressure in the mold cavity at any point will depend upon: (1) The position of the ram at the end of its stroke. (2) The temperature of the heating chamber wall at the end nearest the ram. (3) The surface lubrication on the granules. (4) The temperature of the polymer, and the relationship between the tem- perature and viscosity. (5) The size and length of the channels leading to the mold. (6) The geometry of the mold cavity.
As the plastic enters the mold, the outer portion that touches the mold surface will freeze almost instantaneously, and the molded article will consist of a molten core with a solid shell of polymer around it. This frozen layer will become thicker with time until finally the whole molding is frozen. The gate is usually the smallest opening in the system, and hence it is the first location which completely solidifies. The effective size of this orifice keeps decreasing and will depend upon the length of time the mate- rial cools. Maximum pressure that the gate can hold in the mold will de-
pend upon the size of the fluid core in the gate, and the fluidity of the polymer in the mold. The longer the material is allowed to cool the smaller will be the orifice size and polymer fluidity. Consequently, the pressure drop that can be maintained across the gate will be higher. When this pressure drop, effective diameter, fluidity and rate of cooling come to an equilibrium condition, so that there is no flow, the mold is then completely separated from the heating cylinder and the gate can be considered sealed.
Once the gate has sealed, the pressure will fall off with the temperature according to the equation of state for a system of constant mass and vol- ume. When (1) the pressure in the mold is lowered to a point where the molding will release from the mold as a result of contraction, and (2) the article has hardened enough to maintain its shape after removal from the mold, the mold may be opened.
A primary function of both the injection temperature and pressure is to fill the mold with the required amount of polymer in a fluid state so as to prevent weld lines or surface marks. If the pressure built up in the mold is below that required to offset shrinkage of the polymer during cooling, there will be excessive sink marks or bubbles. To make a good molding, therefore, the pressure in the mold and the plastic temperature when the mold has filled must be greater than the temperature and pressure at which the gate must seal for a given proper amount of material in the mold. In all practical cases, to fill the mold at a reasonable rate with the pressures available, the plastic temperature must be much higher than the temperature at which the gate seals. To maintain the mold pressure while the polymer is cooling down to the sealing temperature, the plunger must hold the pressure on the mold and force a small additional amount of material into the mold.
This packing period extends until the plunger forward timer returns the ram. Some of the polymer will then discharge out of the mold, reducing the pressure in the mold to the level that the solidified polymer in the gate will hold in the mold at that temperature.
2 . T H E MOLD PRESSURE CYCLE
One of the most useful tools in studying the injection molding cycle is the mold pressure gauge. With this gauge the pressure in the mold through- out the molding cycle can be measured as a function of time. A typical mold pressure cycle diagram is shown in Fig. 4 . In this diagram are shown the major subdivisions of the cycle, with mold closure denoting zero time.
The dead time ( 1 ) has little significance other than its contribution to the total cycle time. Filling the mold (2) constitutes the second stage of the process and extends until the pressure starts to rise in the mold. In the packing step (3) the pressure builds up to a maximum very quickly and then remains relatively constant during the remainder of the packing time.
-·—PLUNGER FOR TIME—4- MOLD CLOSED TIME ι MOLD OPEN TIME · -
IPRESSUREI ι 1
1 V»—15> 1
(1) !(2) (3) |(4)| (6) ^ |
I
! ! 1 ΡΠΜΕΊFIG. 4 . Pressure in the mold during a typical cycle. Sequence of events is: ( 1 ) dead time, ( 2 ) filling, ( 3 ) packing, (4) discharge, ( 5 ) sealing, and ( 6 ) sealed cooling.
At the end of the packing period the plunger is released and the excess polymer discharges out of the mold (4). At this point the mold pressure begins to drop rapidly. As the pressure decreases the flow from the mold decreases and eventually ceases at the sealing point (5). A further reduction in pressure results from cooling of the polymer (6). At a given point during cooling the mold is opened and the mold pressure drops to atmospheric pressure. If this residual pressure in the mold when it opens is too high, the product may be scored or broken on ejection.
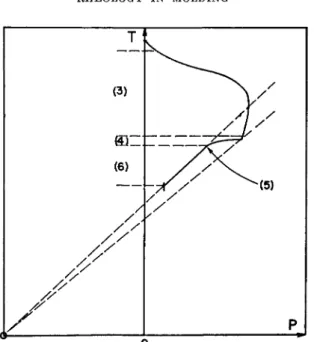
Since the temperature of the polymer in the mold is related to the time it has cooled in the mold, the time coordinate of the mold pressure diagram can be converted to plastic temperature. Thus, it is possible to draw a diagram representing the pressure-temperature relationships during the injection molding cycle (Fig. 5). The dashed lines on this figure are lines of constant density representing the conditions in the mold during the sealed cooling portion of the cycle where the polymer is cooling under constant density conditions.
IV. Filling the Mold 1. DESCRIPTION OF FLOW INTO THE MOLD
The problems involved in any attempt to treat quantitatively the filling of the mold are very complex. Most thermoplastics have non-Newtonian flow properties; i.e., the flow rate is very sensitive to changes in the pressure gradient which occur under typical filling conditions. The flow rate is also sensitive to temperature gradients arising from contact of the hot polymer with the cold mold walls during filling. Moreover the geometrical complexity
Fia. 5. Pressure-temperature relationships during the injection molding cycle of the flow channels in the mold, along with the factors noted above en- hance the difficulties involved in any theoretical approach.
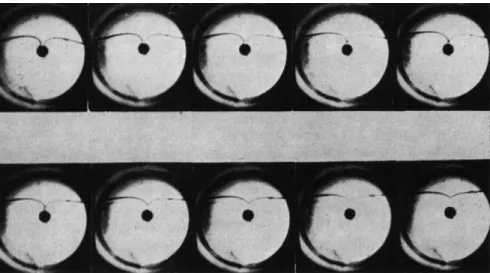
During filling, the front of the polymer moves across the mold as shown in Fig. 6. In this type of flow between parallel plates the polymer front can be considered as a circular segment of continuously increasing radius, with
FIG. 6. Successive positions of the polymer front during filling of a disc mold. The time interval between positions is 0.078 sec.
the gate at the center. This is probably an adequate model if one neglects the effect of the circumferential wall. In the early stages of filling, the wall exerts a retarding force, and the polymer front in the vicinity of the wall bends back toward the gate. If the wall were not present, the polymer would flow radially into the cavity from the gate. During the later stages of filling the curved wall deflects the material which would otherwise strike it in radial flow, and this deflected polymer bends the wall ends of the front away from the gate. As a result, the front eventually becomes linear and then curves away from the gate just before completion of the filling operation.
To gain a better insight into the process of filling, a special mold was constructed to fabricate a disc 2 in. in diameter and 0.1 in. thick. Carefully annealed glass plates 1}4 in. thick were set into the two sides of the mold and appropriate windows were cut out, making the entire mold cavity visible. Slow-motion movies then were taken of the pattern of flow within the mold during the filling process. During filling, the front of hot polymer advanced across the mold as shown in several of the frames taken from
FIG. 7. During filling of the cavity, the polymer front moves across the mold
1.0
0.8 H
0.6
0.4
0.2
0 0 2 3
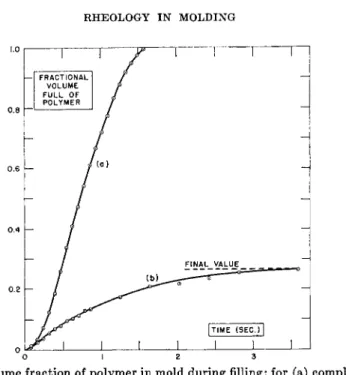
FIG. 8. Volume fraction of polymer in mold during filling; for (a) complete filling, (b) a short shot.
the movie (Fig. 7). The volume of polymer in the mold increases with time as indicated in curve (a) of Fig. 8.
Let us now consider what is going on in the portion of the mold which is already filled. Observation of the flow into the mold was facilitated by mixing a few dark granules with the clear polymer. In the fifth frame of Fig. 7 a streak of black polymer is shown entering the cavity, and in sub- sequent frames as it travels across the mold in a region centrally located between the parallel glass walls. Its velocity is greater than the velocity of the advancing front. The temperature of this bit of polymer does not drop appreciably in traversing the mold, unless flow is quite slow or the walls very close together. When our bit of polymer catches up with the advancing front it is forced outward against the mold wall. Here it is chilled quite rapidly and remains motionless, while the front traverses the rest of the mold. Thus, in the filled portion of the mold we find two regions; a cool motionless shell, and a relatively hot flow core. At the front the hot flowing polymer is being converted into a stationary shell. The subsequent phenom- ena of packing and discharge take place within the central core. As soon as the mold is full, the core begins to cool more rapidly and the shell in- creases in thickness.
Both packing and discharge have been observed in the glass window mold. T o get some idea as to the relative polymer flow rates during these processes, measurements of lineal velocities in the neighborhood of the gate
T A B L E I
APPROXIMATE POLYMER VELOCITIES AT ABOUT ONE CENTIMETER FROM THE GATE IN THE GLASS-WINDOW MOLD
Process Velocity, cm./sec.
Filling (about half full) Filling (almost full) Packing
Discharge Jetting
15-20 6 3 1 70*
* This is the observed lineal velocity of the jet. For comparison with the pre- ceding values this corresponds to 1.7 cm./sec. lineal velocity 1 cm. from the gate if the mold were full of polymer.
were made from the movies taken during filling, packing and discharge.
The velocities measured are listed in Table I. Comparison of lineal veloci- ties in the full part of the mold with the velocity of the front permits cal- culation of the thickness of the hot flowing core. In a typical case this is estimated to be 40% of the thickness of the disc.
With relatively small gates another phenomenon is sometimes observed, which has been termed "jetting" (Fig. 9). The first polymer entering the mold has sufficient kinetic energy to shoot into the cavity in the form of a jet. The jet continues until the resulting filament of polymer becomes rigid enough, through cooling, to deflect the flow of polymer from the gate.
Filling then proceeds in something like the normal pattern, slightly compli-
FIG. 9. "Jetting1
cated by the presence of the polymer filament. The appearance of the filament is very much like that of polystyrene filaments extruded at high shearing stresses. Jetting is believed to be responsible for a characteristic type of surface blemish in the molded article. When filling proceeds too slowly after jetting, the filament cools so much that it will not weld per- fectly with the incoming hot polymer, thereby blemishing the surface of the molding. This type of blemish may be minimized by keeping the fill time below some arbitrary desirable value.
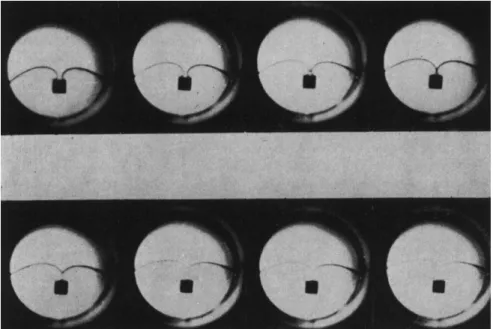
Another phenomenon which occurs during the filling of some cavities is the formation of weld lines. The presence of a weld line in injection mold- ings often poses a difficult problem from a standpoint of both strength and appearance. To produce a weld line and observe its formation in the photo mold, small inserts were placed in the center of the cavity between the glass plates. Figures 10 and 11 show two sequences of flow around a circu- lar insert 0.25 in. in diameter and a square insert 0.25 in. on a side. It is evident from these pictures that the flow of polymer adjacent to the insert is greatly retarded. As a result the two polymer streams produced by the insert first join at a distance from the insert. The weld line then forms in toward the insert as well as in the direction of polymer flow. Since a small pocket of air is easily trapped between the insert and the point where the polymer first forms the weld line, it will have little strength adjacent to the insert unless means are provided for allowing this air to escape. If the filling process is rapid enough, this entrapment of air may cause the polymer to burn.
FIG. 10. Sequence of flow around a circular insert
FIG. 11. Sequence of flow around a square insert 2 . FILL TIME EQUATION
It is fairly well recognized by now that molten polystyrene is a non- Newtonian fluid because its rate of flow is not proportional to the driving force. The flow of polystyrene through a channel may be described by the following empirical equation:
where Q = volume rate of flow, L = length of channel, Ρ = pressure drop, τ = shearing stess at channel wall, D = a characteristic dimension represen- tative of the cross-sectional size, and Ci + Ci = constants denoting the shape of the channel. Two constants characteristic of the polymer appear in this equation. Of these ηο is the Newtonian viscosity, and Κ is a constant proportional to the highly elastic compliance.
Actually, this approach is more detailed than is necessary to satisfac- torily discuss the flow characteristics of most commercial polystyrenes, since they fall within a rather limited range of average molecular weight.
Since Κ is directly proportional to molecular weight and independent of temperature, the dependence of flow rate on pressure is relatively invariant over the range of commercial polystyrenes unless they differ appreciably
in content of plasticizer, lubricant, or low molecular weight polymers.
However, the Newtonian viscosity is very sensitive to changes in molecular weight or temperature and thus strongly influences the magnitude of flow velocity Q.
A further simplification of equation (4) is possible. The pressure differ- entials of interest in injection molding are usually in the narrow range. In addition to this the shearing stresses, r, during flow in molding are relatively high, and a power law equation can be used to approximate the flow:
Λ Pa
Q = — (5) Vo
Here the constant A depends upon the geometry of the channel through which the polymer flows. For a given channel and pressure range one would not expect A and a to vary appreciably with temperature or choice of commercial polystyrene. Further equation (5) will probably be a reasonably good approximation for systems involving channels of noncircular cross sections.
The fill time, / , is defined as the length of time between the instant the polymer begins moving into the mold and the instant the mold becomes full. A detailed consideration of this problem should take into account the geometrical complexity of the channels of flow and the fact that the polymer is being cooled during filling. Needless to say, this makes the problem very difficult, if not completely impossible to solve. The geometrical complexity presents no problem if we are content with an approximate expression, for we can refer to equation (5) and write
/ = ΒηοΡηΤ" (6)
where Pm is the pressure applied to the polymer by the plunger and ηο is the Newtonian viscosity of the flowing polymer. This last quantity raises a further question. There can be no doubt that the polymer is cooled some- what while filling the mold, and that the viscosity is highly dependent upon temperature. It has been previously stated that the polymer flowing into the mold passes inside of a layer of frozen polymer. When it reaches the advancing front of flowing polymer it is forced out against the mold surface and cools rapidly. Because of the very low thermal conductivity of most polymers it seems reasonable to assume that in the flowing polymer the temperature will not change rapidly and that the actual cross-sectional area of the channel will be reduced. Hence we may merely compute 770 at the temperature of the polymer just before it enters the mold, realizing that variations in the surface temperature of the mold may show up in a change in the value of B.
T A B L E II
COMPARISON OF EQUATION (6) AND OBSERVED FILL TIMES
[Mold Temperature = 90° F. (32° C.)
*7o , / (calc), / (obs.),
k.p.s.i. poise sec. sec.
1 9 3 8 , 6 0 0 1 . 0 5 1 . 2
1 9 8 0 , 5 0 0 2 . 2 0 1 . 7
1 9 1 1 5 , 0 0 0 3 . 1 4 2 . 7
1 9 2 1 0 , 0 0 0 5 . 7 5 6 . 7
1 6 8 0 , 5 0 0 4 . 6 0 4 . 7
1 4 9 , 1 0 0 0 . 9 4 1 . 2
1 4 1 4 , 5 0 0 1 . 4 9 1 . 2
1 4 6 2 , 5 0 0 6 . 4 2 6 . 7
1 2 1 2 , 9 6 0 2 . 6 3 2 . 7
1 2 1 4 , 3 0 0 2 . 9 0 2 . 7
1 0 9 , 1 0 0 4 . 1 3 4 . 7
1 0 1 2 , 9 6 0 5 . 8 8 6 . 7
1 0 1 4 , 3 0 0 6 . 5 0 6 . 7
In the evaluation of Β and a the only a priori expectation from equation (4) would be that a should be somewhere between 4 and 5 for high shearing stresses. This turned out to be the case for a typical press and mold, where it was found that a = 4.4 and Β = 11.4, with/in seconds, 770 in poise, and Ρm in units of 1000 pounds per square inch (k.p.s.i.). Equation (6), with these values of the constants, was in good agreement with observed fill times when the mold temperature was 90° F. (32° C.j, as shown in Table II.
It was found that raising the mold temperature to 120° F. (49° C.) re- duced the fill times and this corresponded to a value of Β = 6.15.
There is a limitation on fill time for many molding presses which must be considered. The plunger forward motion is produced by pumping oil at a constant rate into a cylinder which drives the plunger. A pressure control by-passes the pumps when oil pressure reaches a maximum predetermined value, and subsequently maintains the pressure constant. This corresponds to the pressure Pm . If this maximum pressure is set high enough on the control it is not attained during filling. Instead, the mold fills at a constant rate under some lower pressure. This filling rate is determined by the oil pumping rate and the ratio of polymer displacement to oil displacement.
The minimum fill time is determined by this filling rate and the volume of the mold. The filling pressure can be calculated from equation (6) by setting / equal to the minimum fill time. The minimum fill time can be calculated, as just outlined, although it is readily determined experimen- tally.
Thus far it has been assumed that viscous flow is the mechanism by which polymer moves everywhere within the molding press. This assumption is valid only if that section, through which the incoming cold granules move during filling, is heated so as to soften the surface of the granules contacting it, so that the whole plug-like mass moves ahead by viscous flow of the softened polymer at the wall. In this case the filling time equation would apply as given. If, however, the cylinder wall in the granular zone ahead of the ram is too cool to soften the polymer appreciably, the friction be- tween the polymer and the cylinder wall must be considered. This friction force can be considered to reduce the pressure at the forward moving end of the granular plug to
Pd = Pme-(AiiLo'D) (7)
where μ is the coefficient of friction of the polymer on the cylinder wall, Lo is the uncompressed length of the granular zone, and D is the diameter of the cylinder. Substituting this in equation (6) gives
/ = Be^LQfDVoPm-a (8)
Thus only the apparent value of Β is altered; the form of the filling equation is preserved. Consider now the effect of adding a lubricant to the surface of the polymer granules. This would lower the coefficient of friction μ, and hence decrease the time required to fill the mold, according to equation (8). On the other hand if the cylinder section is heated, frictional effects become relatively unimportant and the fill time approaches the value given in equation (6).
Having now considered some of the factors influencing the value of Β in the fill time equation let us now turn our attention to the constant a.
The rate of flow, Q, through a molding machine during filling may be ex- pressed as
q = ^ Σ ^ (κβρτ Ο)
*7 n=o
η !
where Κ = geometrical constant, Ρ = pressure drop through the machine when frictional losses are neglected, η = some sort of average polymer viscosity, An = geometrical factors, k = polymer constant, proportional to the high elastic compliance, and β = geometrical factor converting pressure drop to average shearing stress at the channel wall. The value a is now defined as
^ AJn + 1)
It has been found that Αη = 1 for channels of circular or rectangular cross section, so that we are probably justified in writing
rflogQ n^o n\ \ n i
a
= — -
=1— ui;
d l o g P
t \ w r
Thus, a will increase as either the shearing stress or the constant k increase.
To calculate α, the value of kß must be known. This may be found by fit ting equation ( 9 ) to a set of fill-time or flow-rate data taken at constant temperature conditions but varying pressures. For example, the data of Table II, when reduced to a constant viscosity, give a value of kß = 4.3 X 10~4 (p.s.i.)"1. From this a = 4 . 2 5 at Ρ = 15,000 p.s.i., which is more or less the middle of the range covered. This may be compared with a value of α = 4.4, found by fitting the fill-time equation to these and many other data for this machine.
If k is known for the polymer used, the method just described also gives the constant β, which is of interest in some cases. Suppose, for example, that one had a series of polymers which one wished to compare as to their relative "fluidity" under injection molding conditions. This could be done by actually molding the materials, but a lot of time and polymer would be needed. In addition, there would be no assurance that the conclusions would apply if some other injection molding machine were to be used. If, however, values of β are known for a few typical molding machines, the properties η and Κ of each polymer may be measured and then translated into comparable rates of flow at shearing stresses actually encountered in injection molding. For a common 12 oz. press β was found to be 1.7 Χ 1 0- 3, and for a 16 oz. press of a different make β = 3.08 X 10~3.
V. Packing in the Mold
1. DESCRIPTION
The flow of polymer into the mold does not cease with the filling of the mold. The pressure in the mold is generally quite low at the moment the mold becomes full of polymer. The ram is still exerting pressure, and polymer continues to flow as long as the mold pressure is less than the ram pressure. This flow raises the pressure in the mold very rapidly. Opposed to this, however, is the tendency of the mold pressure to drop because of the cooling of the plastic. As a result, the pressure rises rapidly to some maximum value and then drops off slowly, as shown in Fig. 12. This maxi- mum represents the balancing of the opposing tendencies, and the pressure at this point is substantially less than the ram pressure. Thus, flow con-
A. Dead Time B. Filling Mold C. Pressure Build-Up D. Packing E. Discharge
F. Cooling With Gate Frozen
tinues all through the plunger forward time, unless the flow rate drops low enough to permit the plastic to solidify in the gate.
Packing has been observed directly in the photo mold, as illustrated in Fig. 13. Filling is completed after the first frame; packing is evidenced by the subsequent movement of the black streaks near the gate (at the bottom of each picture).
2 . PRESSURE LOSSES IN THE INJECTION MOLDING MACHINE
One of the important functions of the molding press is to fill the mold properly, and to transmit enough pressure into it so that the molded piece will be an exact reproduction of the mold cavity. The pressure in the mold after it is frozen off from the heating cylinder must be sufficient to com- pensate for the shrinkage of the polymer on cooling, or else the piece will shrink away from the surface of the mold, leaving unwanted depressions in the piece. The pressure loss between the injection ram and the mold is considerable. Measurements have been made comparing the maximum pressure in the mold to the ram pressure. These are shown in Fig. 14 for several different injection temperatures. One of the more recent methods of reducing the difference between the injection pressure and the mold pressure is the preplasticizer unit described previously. With this unit hot polymer is fed into a shooting cylinder, without torpedo, so that the près-
FIG. 13. A series of frames illustrating packing of the mold cavity
1 4 , 0 0 0
1 2 , 0 0 0
-a 6,000 Ö ε
4,000
σ α»
Q-
2,000
—
—
Injection /490°f/ / /
—temperature / /450°f/ /
/ / °%00-F
5241 i ! ! 1 1 ! I
0 4,000 8,000 12,000 16,000 20,000 Injection pressure P .S .I.
FIG. 14. Machine pressure efficiency determined at varying temperatures of plastic entering the mold, using a 6-oz. shot in a 12-oz. machine on a 60-sec. cycle.
sure loss in the granules and the small channel between the cylinder wall and the torpedo is eliminated.
In going through a conventional molding press the first pressure loss will be the result of the friction through the granular zone. Most thermo- plastics are marketed in granular form. In subsequent fabrication opera- tions, such as extrusion or injection molding, it is usually necessary to force the granular polymer through some sort of a channel. Under these circum- stances one wishes to know what force has to be applied in order to move the granular plug against a specific resisting force or, conversely, how much of the applied pressure is transmitted through the granular material. This problem has been studied rather thoroughly for the static case where the polymer is just on the verge of moving. The apparatus used for this study is shown schematically in Fig. 15. It consists of a heavy-walled cylinder with two closely fitting pistons. Strain gauges were mounted on the lower piston and the unit calibrated in terms of the force applied to the piston.
As the force is applied the granules first compact down to an almost solid slug. The resisting force, or the force transmitted through the granules, was related to the applied force by
in a cylinder, where Fd is the transmitted force, Fm is the applied force, μ is the coefficient of friction, LQ is the uncompacted length of granules, and D is the diameter of the cylinder.
With the apparatus shown it was convenient to use a number of differ- ent loadings and thus check the predicted constancy of Fm/Fd as the load- ing increased and compaction proceeded. Quite high loads were possible so that compaction down to as little as 60% of the original volume was
FIG. 15. Experimental arrangement used in the study of pressure transmission through granules.
= e-ißLQ/Dp m (12)
/////////PRESS P U A T E Ν / / / , / , / / , ,
^β"·-- PLUNGER
CYLINDER
T A B L E III
PRESSURE TRANSMISSION THROUGH GRANULAR POLYSTYRENE. FORCE RATIO Fm/Fd Poly-
mer No. LQ , in.
Fm, lb.
Poly-
mer No. LQ , in.
7600 14,700 22,000 29,500 37,000 44,000 51,000 59,000 Average 1 0.834
1.594 2.442 3.354
1.582 2.71 3.80 6.33
1.530 2.37 3.86 5.65
1.469 2.44 3.67 5.79
1.538 2.57 3.69 6.15
1.457 2.64 3.63 6.17
2.51 3.73 6.29
2.45 3.64 6.22
2.46 3.74 5.57
1.515 2.52 3.72 6.02 2 0.829
1.611 2.447 3.349
1.520 2.92 3.80 9.50
1.362 2.94 3.34 7.35
1.448 2.75 3.67 6.46
1.490 2.78 3.69 6.56
1.516 2.72 3.85 6.38
2.68 3.93 6.47
2.58 3.98 6.37
2.61 3.74 6.55
1.467 2.75.
3.75 (6.47) 3 0.794
2.042 2.417 3.314
1.226 3.17 4.22 3.46
1.362 2.83 3.68 3.68
1.266 2.75 4.07 3.66
1.461 2.74 3.28 3.99
1.423 2.72 3.43 4.63
2.78 3.60 4.89
2.96 3.64 5.31
2.98 3.83 5.27
1.348 2.87 3.72 (5.27)
achieved; yet
F
m/F
d remained relatively constant as shown in Table III.The effect of the original length is shown in Fig. 16 where the average
Fm/Fd
from Table III is plotted logarithmically against L0. Not only does a fair straight line result, but it may be seen that all three samples of polystyrene tested fall along the same line, which corresponds to a coeffi- cient of friction of μ = 0.262. The effect of external lubrication on the granules is to reduce the force ratioF
m/F
d . Different amounts of lubricant in powder form were mixed thoroughly with polystyrene and the pressure transmission through a fixed size of sample determined. The results are shown in Table IV. The ratio of the pressure at the forward moving end of the granules, Pd, to the pressure exerted by the ram, Pm, will be the same as the force ratioFm __ Pm _ MLQJD (Λθ\
T
D~T
D~
E {13)In the molding machine the material starts as a cold mass of granules and, as it passes through the heating chamber, it softens and finally becomes a viscous fluid. Once it leaves the nozzle and enters the mold, the polymer starts to cool, with a resultant increase in viscosity. The material solidify- ing on the surfaces of the mold and the passages leading to the mold cavity reduces the cross-sectional area of molten polymer capable of transmitting pressure. The pressure losses in the mold will depend upon the viscosity and the temperature of the plastic, and the mold temperature. These fac-
FI G. 16. Dependence of force ratio on length of sample of polystyrene. Circles represent polymer No. 1, crosses No. 2 , and squares, No. 3 .
T A B L E I V
EF F E C T O F SU R F A C E LU B R I C A T I O N O N PO L Y S T Y R E N E GR A N U L E S
p.p.m. of Lubricant Fm/Fd
0 4 . 3 8
150 3 . 0 8
300 2 . 6 6
500 2 . 2 3
750 1.82
tors, along with the complicated and varied shapes of the channels, make any detailed analysis of the pressure losses in the mold difficult.
3. EQUATION OF PRESSURE LOSS
An approximate equation has been derived to show the relationship between the ram pressure and the peak mold pressure attained during packing. This equation is derived by simultaneously applying the equation
of state to the polymer in the mold cavity and the filling equation to the polymer in the other channels.
Pi = Pm{l- [f(Ti - To)/C]m} (14)
where Pi = peak mold pressure, Pm = ram pressure, T{ = temperature of the polymer entering the mold, and T0 = mold wall temperature.
The magnitude of the constant C depends upon the cooling character- istics of the mold and a little upon the way in which the approximations are carried out. For the particular mold used in the machine, a, which is the same as in the filling equation, equaled 4.4 and C = 18,300 when / is expressed in seconds and the temperature in degrees Fahrenheit. In Table V data is presented on two polystyrene samples under a variety of molding conditions. Comparison of calculated and observed values of P; points out the wide range of application of equation (14).
T A B L E V
COMPAKISON OF EQUATION (14) AND OBSERVED MOLD PRESSURES FOR TWO POLYSTYRENES
Polymer To,
°F. Ti,
°F. /,
sec. Pm,
k.p.s.i. P i , k.p.s.i.
Pi (cole), k.p.s.i.
1 90 490 1.2 14.0 9.0 7.9
1 90 490 2.7 12.0
G.l
5.71 90 490 2.7 10.0 3.5 3.5
1 90 480 1.7 14.0 8.0 7.4
1 90 460 1.7 16.0 8.9 8.6
1 90 441 1.7 18.0 9.8 9.7
1 90 430 1.7 19.0 10.4 10.3
1 90 450 1.2 19.0 11.3 10.9
1 90 417 4.7 16.0 6.0 6.9
1 90 405 2.7 19.0 8.7 9.5
2 90 400 1.2 20.0 11.8 11.8
2 90 400 1.6 18.0 10.8 10.1
2 90 400 2.7 16.0 8.7 8.1
2 90 400 6.4 14.0 5.5 5.6
2 90 350 4.9 20.0 9.4 9 . 1
2 120 500 1.6 10.0 5.1 5.3
2 120 450 1.2 14.0 8.7 8.2
2 120 450 2.8 12.0 5.3 5.9
2 120 400 1.6 16.0 9.5 9 . 1
2 120 400 3 . 1 14.0 6.4 7.0
2 120 350 7.0 18.0 6.7 7.6
4 . RESIDUAL STRAINS
Another phenomenon associated with the flow of polymer into the mold is the formation of frozen orientation in the molded article. It is well known that the flow of hot polymer is accompanied by a partial uncoiling and orienting of the chainlike molecules in the direction of flow. If the polymer is cooled below the softening point while in this state, the orientation is frozen in. Simultaneous flow and cooling occur during three steps of the injection molding cycle: filling, packing, and discharge. Filling is usually a relatively rapid process during which cooling is not very extensive, being ordinarily enough to form a thin skin of cold plastic. Exception must be taken to this, of course, for those cases in which the molding contains very thin sections. For in a thin section this thin shell of molten plastic may be a large portion of the total volume of the molded article and may be respon- sible for the predominant strains. Packing proceeds during that portion of the plunger forward time that is subsequent to filling. There is a some- what slower flow of polymer during packing, but the time allowed for this portion of the cycle is usually long enough to permit considerable cooling.
Discharge, like filling, occurs during a relatively short time interval. This takes place during later stages of cooling than packing; hence, the cooling process is slower. Both of these factors diminish the contribution of dis- charge to frozen orientation.
The concentration of frozen orientation in a surface layer, associated with the filling step may be illustrated by cutting tabs from the molded article and relaxing the orientation in an air oven at 230° F. Typical sam- ples are shown in Fig. 17. Shrinkage of the oriented layer is quite evident in the upper tab. Machining off this orientated layer before heating greatly reduced the warpage as shown by the lower tab. The mold temperature also has a large effect on the orientation frozen into the molding. If the mold surface is hot the cooling is less severe, allowing the oriented molecule to relax somewhat before freezing in place. Tests were made where steam was run through the cored passages of the mold during filling; when the mold was full the steam was turned off and cold water run through the mold for cooling. By cycling the mold in this manner the strains in thin section pieces could be almost entirely eliminated. It was even found that on very thick sections where the cooling takes very long, the molding could be removed from the mold while it was still quite warm by cycling the mold in this man- ner. With this very thick section {% in.), even with the extra time taken to heat the mold before filling the over-all cycle could be reduced from 8 to 5J^ minutes.
The effect of packing on the residual strain is shown in Fig. 18. Moldings were prepared at different plunger forward times, other conditions being
FIG. 17. Pieces cut from box and relaxed at 230° F . Top: Shrinkage of oriented layer is evident in first tab. Bottom: Surface layer machined off before relaxing.
constant. The resultant pieces were examined between crossed polaroids with monochromatic light. It may be seen that the amount of frozen orientation increases markedly with increasing packing. Cross sections of pieces from the same mold were taken near the gate and at the weld line.
These were examined between crossed polaroids, as before, with the lines of observation being parallel to the surfaces of the piece and perpendicular to the direction of polymer flow. Typical examples are shown in Fig. 19.
Several distinctive features may be noted. As might be expected, some of the frozen strain is concentrated in a sort of surface skin, which is pres- ent in both cross sections and presumably elsewhere throughout the mold- ing. It seems likely that a sizable amount of orientation frozen into this skin may be associated with the filling step. Inside this skin we have a thicker layer in which the orientation was frozen during packing. This packing orientation is present in the gate cross section, but absent in the weld cross section. This is not too surprising when it is realized that the rate of polymer flow during packing is a maximum at the gate and drops off to zero at the weld line. As a further point of interest, the strain pat-
FIG. 18. Effect of packing on residual strain. Plunger forward time (P.F.) versus frozen stress pattern. Pieces viewed between crossed polaroids. Large gate 0.375 X 0.035 in. Pi - 13,000-13,500 p.s.i. Ti = 495° F . , T0 = 90° F . Cycle = 90 sec. As P.F.
rises, the amount of frozen orientation increases.
tern clearly shows the location of the weld and the conditions existing at that point. In Fig. 20 a similar cross section near the gate is shown for a case in which the packing time was appreciably shorter. The reduction in frozen strain in the central portion is apparent.
One very important phenomenon observed in molded articles, which is at least partially associated with frozen orientation, is crazing. By this term is meant the formation of numerous small cracks in the plastic, usually extending only part way into the material. Crazing may be brought about
FIG. 1 9 . Cross sections of boxes viewed between crossed polaroids: (α) near weld;
(b) at weld with line of sight parallel to box wall planes, perpendicular to polymer flow.
FIG. 20. Box cross sections viewed between crossed polaroids: (a) near gate; (6) at weld. Photo differs from Fig. 1 9 only in that pieces were made in shorter plunger forward time.
in many ways, but i t seems reasonable that in any event i t is always pro- duced by tensile stresses. The stresses which produce crazing in use may arise from various causes. Sudden chilling will result in tension in the surface of the article in all directions. This is illustrated in Fig. 21, which is a photograph of a polystyrene box that had seen household use for sev- eral months as a refrigerator dish. On all sides of the box the craze cracks follow the flow lines. The tendency of a molded article to craze can be re- duced greatly by reducing the frozen orientation.
FIG. 21. Crazing of a box which has been used for several months as a refrigerator dish. Cracks follow the lines of flow.
VI. Discharge and Sealing 1. DESCRIPTION
At the end of the packing period the plunger is returned to its starting position. Thus, there is a higher pressure in the cavity than ahead of the gate. If the gate has not frozen shut, the flow in the channel is reversed and the mold discharges. During discharge the pressure in the mold drops quite rapidly, and the rate of discharge decreases as the pressure differential across the gate becomes smaller. When this rate becomes low enough and the polymer temperature becomes cool enough the polymer ' 'freezes" in the gate, sealing the mold. The temperature and pressure in the mold at the instant of sealing are important quantities in considering mold shrink-
age, bubble formation, etc.; to determine the sealing characteristics it is necessary to go back to the polymer cycle, as determined by the pressure measurements, to find the pressure-temperature relations at the time of sealing.
2. SEAL LINE
All that is necessary is to convert time into temperature—from heat- conduction theory—and replot the mold pressure curve by a curve of temperature vs. pressure. The resulting plot is a straight line in the later stages of cooling and the sealing point is the point at which the curve deviates from this straight line. The temperature-pressure plot for a num- ber of plunger forward times is shown in Fig. 22. The relationship between the various sealing points is approximately a linear variation of tempera- ture with pressure. The position of this sealing line will depend largely upon the mold wall temperature, polymer setup temperature, and gate dimensions. For a typical molding situation the experimental sealing points are found to conform to the following equation:
Ρ (k.p.s.i.) = 2 2 . 5 - 0 . 0 6 6 Τ (° F.) ( 1 5 ) Two exceptions must be noted. If the pressure in the mold at the end of
the packing period is less than that given by this relationship, only very slight discharge will result, and essentially all of the pressure will be sealed into the mold. The other case may arise if the plunger forward motion is unduly prolonged. After considerable cooling has taken place the rate of
0 2 4 P R E S S U R E ( K P S I ) 12
FIG. 22. The relations between the sealing points for various plunger forward times.
flow into the mold during packing is greatly diminished. If this becomes low enough the gate will seal during the plunger forward motion and there will be no discharge at all.
It has been pointed out that frozen orientation may be substantially reduced by minimizing the packing time. With conventional molds and presses this procedure cannot be carried far enough to be of much benefit.
As the packing time is reduced, discharge becomes more extensive and less plastic is sealed into the mold. This leads to the formation of sink marks or bubbles. From this it is apparent that extensive reduction of the packing time will become feasible only if a means is provided to reduce or eliminate discharge.
There are several methods used for reducing or eliminating discharge.
One method is to use a restricted or pin-point gate. This speeds up sealing of the mold, cuts down on discharge, and hence seals more pressure in the mold. The use of the restricted gate is accompanied by certain disadvan- tages, in addition to which, it is only a partial solution to the frozen orien- tation problem.
Another method of reducing strains and also of having the correct amount of plastic in the mold is weigh feeding. In weigh feeding only the correct amount of plastic is placed in the mold during the injection stroke. The injection ram makes a complete stroke and is held in its forward position against a mechanical stop. Thus at the end of the injection stroke essen- tially all of the plastic is in the mold and there is very little flow through the gate. By holding the plunger in its full forward position the gate is effectively sealed at the end of the injection stroke, and there is very little packing in the mold after this time. The main disadvantage to weigh feed- ing is that the weight of plastic placed in the mold must be very accurately measured. To do this the accuracy of the weigh feeding apparatus must be very high and also the ram must come to its complete forward position.
Another method of reducing packing is the mechanical shutoff for sealing the mold at the end of the plunger forward time. In this way, discharge can be completely eliminated and the packing time cut back to the point where substantial reduction in frozen orientation is possible. Each of these three methods have their advantages and disadvantages and the particular molding situation will determine which method can be used to the best advantage.
VII. Sealed Cooling
1. T H E EQUATION OF STATE
Further cooling subsequent to sealing is usually necessary. The polymer must cool until its average temperature is lower than some effective hard-