High accuracy of color-generating nanoarchitectures is kept in lowland and mountainous populations of Polyommatus dorylas (Lepidoptera: Lycaenidae: Polyommatinae)
Zsolt B alint
a,*, Gergely P eter Katona
a, Zsolt Endre Horv ath
b, Kriszti an Kert esz
b, G abor Piszter
b, L aszl o P eter Bir o
baHungarian Natural History Museum, Baross utca 13, Budapest, H-1088, Hungary
bInstitute of Technical Physics and Materials Science, Centre for Energy Research, P.O. Box 49, Budapest, H-1525, Hungary
a r t i c l e i n f o
Article history:
Received 25 July 2019 Accepted 8 October 2019 Available online xxx
Keywords:
Wing scale size Polyommatina Sexual signal Spectral properties Voltinism Nanoarchitecture
a b s t r a c t
It is known that the size of the scales covering the surface of the Lepidoptera wings is in correlation with body size: larger species possess larger scales. However, butterfly individuals representing the various generations of the same species but differing in body size were not investigated in this respect. Similarly, the question whether different scale size may influence structural color generation based on nano- architectures in the scale lumen was never addressed. Populations of lowland (environment of Budapest, Hungary) and upland (Carpathian Mountains, Romania)Polyommatus dorylaswere compared in terms of voltinism, wing and scale size, and the structural origin of blue coloration. Data analysis showed that the univoltine upland population exhibits a larger wing and scale size. On the other hand, the nano- morphology of the blue color-generating scales was identical when compared between univoltine and bivoltine populations. Coloration was also identical when measured with a spectrophotometer under ultraviolet and visible light. This high accuracy present in the male structural coloration suggests that it is controlled genetically. Body size alteration for enhanced thermalfitness has no influence on thefine structure of the nanoarchitecture present in the scale lumen.
©2019 The Authors. Published by Elsevier Ltd. This is an open access article under the CC BY-NC-ND license (http://creativecommons.org/licenses/by-nc-nd/4.0/).
1. Introduction
The Blue butterflies, the tribe Polyommatini of the Lycaenidae, is one of the most typical day flying lepidopteran tribes in the northern hemisphere (Talavera et al., 2013; Vila et al., 2011). They are important members of habitats characterized by open land- scapes in the Carpathian Basin (Szabo, 1956). In the wind-swept meadows, polyommatine lycaenid females spend most of their time feeding and basking at ground level. Theyfind their mate(s) because of the special prezygotic strategy the tribe employs: fe- males detect species-specific optical signals present on the dorsal wing surfaces of males. Females prefer brightly colored males (Imafuku and Kitamura, 2018). The male sexual signaling colors are species-specific and precisely tuned spectrally (Balint et al., 2012).
The physical background of this signal is provided by photonic nanoarchitectures located in the lumen of the scales (Schmidt and
Paulus, 1970; Tilley and Eliot, 2002; Wilts et al., 2009; Biro and Vigneron, 2010). Due to the role this color generation mechanism plays in the mating strategy, the physical color of the lycaenids is subjected to strict selection (Piszter et al., 2016), and exhibits a stress stability which by far exceeds the stability of the pigment- based pattern found on the ventral side of the wings (Kertesz et al., 2017). Moreover, as our previous experiments revealed, the sexual signaling color of Polyommatus icarus(Rottemburg, 1775) exhibits an amazing spectral stability, both in space and in time (Kertesz et al., 2019).
An important strategy in the adaptation to the environment is the regulation of generation numbers. For example, the widely distributed typical grassland species,P. icarus, may have a single brood in northern latitudes (Henriksen and Kreutzer, 1982) but produces up to four broods in regions close to the Mediterranean Sea (Tshikolovtes, 2011). Therefore, the voltinism of this species is highly influenced by various local conditions. When the environ- ment turns less favorable, some of the populations are forced to reduce their brood number in order to adopt a more economical way to use the available recourses for breeding. Because of this, the
*Corresponding author.
E-mail address:balint.zsolt@nhmus.hu(Z. Balint).
Contents lists available atScienceDirect
Arthropod Structure & Development
j o u r n a l h o m e p a g e : w w w . e l s e v i e r . c o m / l o c a t e / a s d
https://doi.org/10.1016/j.asd.2019.100887
1467-8039/©2019 The Authors. Published by Elsevier Ltd. This is an open access article under the CC BY-NC-ND license (http://creativecommons.org/licenses/by-nc-nd/4.0/).
size of the imagines in populations with different number of gen- erations can also differ in body weight and wing surface size, as previously documented forP. icarus(Nygren et al., 2008).
On the other hand, according to recent investigations in Lepi- doptera, there is a strong correlation between the wing surface area, location and the size of the scales (Simonsen and Kristensen, 2003; Dhungel and Otaki, 2014). Here, one has to observe that in the case of photonic nanoarchitectures, a very close relationship exists between the geometric size of the wing scale nano- architectures at the nanometer level and the spectral properties, which provide the species-specific signals for polyommatine lycaenids (Balint et al., 2012). Therefore, it is very useful to inves- tigate species in which the switching from two generations to a single generation is associated with an easily measurable change in body and wing size (Balint, 1987; Nygren et al., 2008), and the consequences of the change in wing size, both in terms of the associated scale size and the eventual spectral modifications.
In this paper, we studied one polyommatine species that is typically found in calciferous open landscapes in the Western Palearctic region:Polyommatus dorylas(Denis and Schiffermüller, 1775). In general, this species is bivoltine across most of its range (Tolman and Levington, 1997; Tshikolovtes, 2011), but there are records of univoltine populations, some of which have been discriminated taxonomically (Balint, 1985, 1987). It appears that the univoltine populations of this species produce imagines with conspicuously larger wing surface areas as compared to bivoltine populations. We aimed to compare the wing surface and the color- generating scale sizes of populations with different voltinisms. We also investigated their spectral properties and, in particular, attempted to determine whether there is any correlation between the size of the scales and the number of generations and whether the spectral properties of the populations with different voltinisms are common or different.
2. Materials and methods
2.1. Species investigated
P. dorylas is distributed westwards from the Dnieper Plain throughout Central Europe to the Pyrenees, and southwards to the Balkans and Anatolia, and the Caucasus region (Tshikolovtes, 2011).
For Central Europe in general, this species is documented as being bivoltine (Szabo, 1956; Slamka, 2004). In mountainous areas, to- wards the edge of its range, populations of this species are uni- voltine (Geiger, 1987; Lafranchis et al., 2015).
2.2. Populations and specimens examined
We sampled and examined a univoltine population ofP. dorylas (Magna) living in the eastern Carpathians (Transylvania, Romania) and a bivoltine population ofP. dorylas(first generation:Dorylas I and second generation:Dorylas II) inhabiting the Budapest region (Pannonia, Hungary) (Fig. 1A). The specimens are deposited in the Lepidoptera collection of the Hungarian Natural History Museum (HNHM) (Budapest). Samples are also held in the Nanostructures Department, Institute of Technical Physics and Material Science, Centre for Energy Research, Hungarian Academy of Sciences (Budapest). For more details of the specimens, please refer to supplementary material,Table S1(Fig. 2).
2.3. Measurements of wing dimensions
In total, we examined 32 male specimens ofMagna,Dorylas I, andDorylas II(S¼96). In order to measure wing size, we acquired digital images in the laboratories of the HNHM, which documented
all specimens on a millimeter-scaled graph paper background.
Images were acquired with a Camedia C 7070 (Olympus, Tokyo, Japan) digital camera.
Using CorelDRAW X6 (Corel, Ottawa, Ontario, Canada) software, three measurements of the left forewing were taken: (1) the length of the forewing costa measured from the wing base (vein erection) to the apex (vein R2 terminus); (2) the length of the outer margin measured from the apex (vein R2 terminus) to the tornus (anal vein terminus) and (3) the length of the anal margin measured from the wing base (vein erection) to the tornus (anal vein terminus) (Fig. 1B). Using these three measurements we calculated the area between the white lines onFig. 1A.
Then, using optical microscope images of the right forewing (taken with a 2.5objective), we marked an area of 1.96 mm2 between the vein M3 and the Cubitus. We determined the number of blue cover scales in this area on wings offive randomly selected male exemplars ofMagna,Dorylas I, andDorylas II.
2.4. Optical microscopy
Optical imaging of the wing scales was carried out using an Axio Imager A1 microscope (Carl Zeiss AG, Jena, Germany) using re- flected light. The wing scales usually stand at an angle of approxi- mately 15relative to the wing membrane, so for better visibility, we used focus stacking (Adobe Photoshop, Adobe systems Inc., CA, USA) to compensate for the narrow depth of field of the high- resolution microscope objectives.
Single scales were removed using a sharp needle, and placed on a microscope glass slide. The scales were inspected in reflected light, and we measured their maximum width and length using CorelDRAW X6.
2.5. Scanning and transmission electron microscopy (SEM and TEM)
SEM images were taken using a LEO 1540 XB electron micro- scope (Carl Zeiss AG, Jena, Germany). Wing pieces were cut and mounted on a sample holder with double-sided conductive tape;
single scales were also placed on conductive tape. To ensure that the original structure of the wing scales was preserved, no other treatment was applied. For TEM, a standard sample preparation procedure was performed: after fixing and dehydration, a few millimeters of wing pieces were embedded in Spurr's resin (SPI Supplies, West Chester, PA, USA) and slices of 70 nm were cut with an ultramicrotome. For better contrast, the sections were stained with uranyl acetate and lead citrate, and then inspected using a CM20 TEM apparatus (Philips, Eindhoven, Netherlands) operating at an accelerating voltage of 200 keV.
2.6. Spectroscopic measurements
For optical reflectance spectral investigation, we used a modular fiber optic spectrophotometer (Avantes Avaspec-HS1024 TEC, Apeldoorn, Netherlands) and a halogen - deuterium (Avantes AvaLight-DH-S-BAL) light source. All spectra were recorded against a white standard reference WS-2 (Avantes). For the measurement of the reflected specular component, we used a normal incidence probe, which combined the incoming illuminatingfibers and out- going detectingfibers.
2.7. Modeling and statistical analysis
The photonic nanoarchitectures of wing scales were modeled as chitin multilayers using the transfer matrix method (Pendry and MacKinnon, 1992; Yeh, 2005). The thickness of each layer in the Z. Balint et al. / Arthropod Structure & Development 53 (2019) 100887
2
nanostructures was measured in cross-sectional TEM images using multiple points for both Dorylas and Magna specimens. These values were then averaged and used as an input in simulations where the reflectance spectra for normally incident light were calculated. The statistical analysis was carried out using Origin 2018 (Originlab, Radnor, PA, USA) software. The raw data of the wing size parameters were evaluated using One-way ANOVA supplemented with post hoc Tukey's test.
3. Results
3.1. Wing surface areas
According to our measurements, the wing surface area ofMagna andDorylas I-IIcould be readily discriminated using the methods
we applied herein. TheMagnaforewing surface area was charac- teristically 0.63e0.93 cm2with mean area of 0.78±0.013 cm2, the Dorylas Ihad a wing surface area of 0.46e0.70 cm2, with mean area of 0.61±0.011 cm2. The range of theDorylas IIwas 0.43e0.65 cm2, with a mean of 0.55 ±0.011 cm2(Fig. 1B). Neither Dorylas Inor Dorylas IIreached a wing surface area of 0.7 cm2; their typical range was 0.42e0.70 cm2. Therefore, in quantitative terms,Magnaand Dorylas I-IIwing surface areas differed characteristically: this was also evident when using the naked eye to examine typical imagines (seeFig. 1A, in which each cell of the table is similarly sized) and when were analyzed using One-way ANOVA followed by Tukey's test which showed significant differences between all three groups of samples (ntotal: 96, p<0.05). Consequently, it appears that there is also a small, but significant difference in wing size between the two generations, as thefirst generation (Dorylas I) was 1.11 times Fig. 1.Imagines ofP. dorylasand the results of wing size measurements. (A) The left column shows males while the right column shows females. Upper row¼univoltineP. dorylas (Magna) (Eastern Carpathians); middle row¼first generation of bivoltineP. dorylas(Dorylas I) (Pannonian region); lower row¼second generation ofP. dorylas(Dorylas II) (Pannonian region). On the left forewing of aMagnamale it is indicated in white how measurements were taken. (B) Area statistics for mountainousMagna, lowlandDorylas I, and Dorylas II. The boxes denote the standard error of the mean, while the bars show the standard deviation of the mean. Maximum and minimum values are shown as triangles. One- way ANOVA and post hoc Tukey's test evaluation showed significant differences between the three groups (p<0.05).
alint et al. / Arthropod Structure & Development 53 (2019) 100887 3
larger thanDorylas II, on average, although the ratio of the mean forewing area betweenMagnaandDorylas Iwas 1.3.
3.2. Scale sizes and numbers
According to our observations on wing surface areas, the sepa- rate wing scale sizes were analyzed (Fig. 2). The dimensions (length and width) of the color-generating cover scales on Magnawere found to be different from those in the two generations ofDorylas I- II. The average dimensions of Magnascales were 122 by 70mm (n¼24), whilst those ofDorylas I-IIwere 105 by 59mm (n¼29).
Using One-way ANOVA we obtained significant difference (p<0.001) between the scale size ofMagnaandDorylas I-IIgroups (Fig. 3B and C). According to our manual count, the number of color- generating scales in the examined area (1.96 mm2) forMagnawas 443±22, but was 519±12 forDorylas Iand 532±20 forDorylas II (n¼15, p <0.009). This shows that the same physical area was covered by a smaller number of larger-sized scales in Magna specimens (Fig. 3A).
3.3. Nanomorphology and spectral properties
SEM and TEM images demonstrated that the nanomorphology of the bivoltine Dorylas and the univoltine Magna cannot be distinguished qualitatively at the micron level (Fig. 4), which is probably a general phenomenon for the subtribe (Balint et al., 2007, 2012). Our measurements suggest that the nanoarchitectures occurring in the lumen of the scales were also identical in quanti- tative terms. The spectra ofMagna,Dorylas I, andDorylas IImales
were identical in terms of the maximal blue reflectance, when plotted normalized to this peak (Fig. 5). There were no notable differences observed, and individual variations fell within the normal range displayed by other closely related species (Piszter et al., 2016) and showed a typical polyommatine pattern (Balint et al., 2007). All specimens produced a conspicuous peak within the visible blue range with very strong reflectivity at a wavelength of 440 nm. As already reported forP. icarus, older museum speci- mens exhibit a certain degree of melanin decomposition, which is manifested by an increased reflectance (black curve) on the red side of the spectrum (Kertesz et al., 2019). It is worth emphasizing that for freshly captured individuals, the spectral curves ofMagnaand Dorylas IIoverlapped perfectly.
4. Discussion
4.1. Wing surface areas
The most characteristic difference that we could detect between Magna, Dorylas I, and Dorylas II was the wing surface area. On average, the ratio of wing area inMagnarelative to the wing area of Dorylas Iwas 1.3 and 1.44 with respect to the wing area ofDorylas II.
The ratio of wing surface areas inDorylas ItoDorylas IIwas 1.11.
Larger wing surface area can be beneficial in two aspects: (1) in males, a larger wing surface size provides a more intense, and therefore a more visible optical signal, and (2) in females, a larger wing surface of brown coloration can collect more energy for imaginal activity, what is supplemented by oviposition (Biro et al., 2003). These remarks are supported by the fact that theflight Fig. 2.Optical microscopic images ofP. dorylasmale forewing surfaces taken in the medial area below the cubital vein, along with individual scales from the same area. A and D¼Magna, B and E¼Dorylas I, C and F¼Dorylas II.
Z. Balint et al. / Arthropod Structure & Development 53 (2019) 100887 4
season (Fig. 6) ofMagnais often interrupted by long rainy and cold periods; therefore, there is considerably less time available for the activity of the butterflies in the Eastern Carpathians than in the Pannonian Lowlands (Fig. 7). The average of daily sunshine hours between 13 May - 30 September in the years 2006e2018 period is 9.51±0.68 in the Budapest region (Dorylas I-IIpopulation), while 8.26±0.73 in eastern Carpathians (Magnapopulation). This lower average of daily sunshine hours correlates with significantly (~25%) lower average temperature: in the Eastern Carpathians the aver- aged value for the periods 13 May - 30 September in the years 2006e2018 of the daily average temperature is 14.01C, whilst in the Budapest region it is 19.46C. Consequently, the activity of males in patrolling the habitat must be more intense; their signal therefore appears to be more obvious; also, females need to accu- mulate energy more efficiently during the short sunny hours as
their activity includes not only feeding and mating but also for searching suitable places for egg-laying.
Female Magna individuals are rarely observed, because they spend most of their time in the grass, close to the ground, collecting heat (Balint, pers. obs.). In the HNHM collection, there are only six female specimens, which is not a sufficient number to statistically prove/disprove whether the females are indeed larger than males.
However, on the basis of the available specimens, we are of the opinion thatMagnafemales are also larger than those of bivoltine Dorylas I-II(Fig. 1A).
4.2. Scale size and optical signals
Simonsen and Kristensen (2003) demonstrated that a larger wing surface area correlated well with longer scales. In order to Fig. 3.Wing scale number and size results. (A) Number of wing scales counted forMagna,Dorylas I, andDorylas IIon a 1.96 mm2area. (BeC) Single wing scale length and width (n¼29). (AeC) The boxes denote the standard error of the mean, while the bars show the standard deviation of the mean. Maximum and minimum values are shown as triangles.
One-way ANOVA and post hoc Tukey's test evaluation showed significant differences between theMagnaand the other two groups (p<0.001).
alint et al. / Arthropod Structure & Development 53 (2019) 100887 5
obtain this result, these previous authors assembled and analyzed a large amount of data from a variety of species. The intraspecific variability of scale and wing sizes was not addressed.
As we have shown in the present study,Magnascales exhibit different attributes compared to those ofDorylas I-II, thus sug- gesting that the result formulated bySimonsen and Kristensen (2003)was also valid in an intraspecific context. In spite of an increase in scale size inMagna, the internal architecture in the lumen of the scales has not changed. This resulted in identical spectral characteristics in all of the populations we investigated (Fig. 5).
Previous studies have shown that optical signals are important factors in prezygotic isolation activities, at least in day-flying Lepidoptera (Kemp and Rutowski, 2011; Imafuku and Kitamura, 2018). These signals are generated by species-specific nano- architectures located in the scale lumen; this feature is critical for sexual discrimination.
4.3. Nanomorphology and spectral properties
Accordingly, the difference in male wing size does not influence the nanoarchitectures that produce the optical signals in the wing surface. This was clearly evident in our spectral data and further supported by SEM and TEM images (Fig. 4). Therefore, one of the most important species-specific characteristics remains un- changed, despite the alteration of the scale dimensions. Here, it is worth emphasizing that each scale is the product of a single cell (Greenstein, 1972) and the photonic nanoarchitectures are pro- duced during the pupal stage by a complex process of self-assembly (Ghiradella and Butler, 2009; Iwata et al., 2014; Dinwiddie et al., 2014), which has yet to be fully elucidated. In our case, as shown by the length to width ratio of the scales, the scale morphology is affected to a certain extent, but the characteristic dimensions of the color-generating nanoarchitectures are strictly conserved.
As our simple optical model (supplementary material,Fig. S1) has shown, an alteration of the order of 10 nm in the typical dimension of the scale nanoarchitecture would shift the maximal reflectance by at least 50 nm; this also leads to a simultaneous alteration in morphology at the micron scale. This indicates that the control mechanisms for scale size and shape and for photonic nanoarchitecture size are very likely different.
The body size and tissue size of an animal depend on genetic and environmental factors; however, in the case ofMagna and Dorylas I-II, the same genetic information is expressed under particular environmental conditions. Due to the mountain climate, Magnaexhibited readily detectable size differences, both macro- scopically (wing size) and microscopically (scale size), but rigor- ously preserved the nanoscale dimension of the color-generating photonic nanoarchitectures.
As a matter of fact, thisfinding is less surprising if compared to the differences in the cold-stress resistance of sexual signaling colors and pigment-based cryptic patterns inP. icarusbutterflies.
We found that the sexual signaling colors of the males were only mildly, and randomly altered when pupae were subjected to a long duration (up to 60 days) of cooling at 5C, while the pigment-based patterns on the ventral wing surfaces were found to change dramatically with the duration of cold stress; the magnitude of the alteration also increased monotonically (Kertesz et al., 2017). In further support of this theory, when rearingP. icarusbutterflies under controlled conditions, we previously obtained individuals Fig. 4.Micrographs ofP. dorylasscales. A, B¼scanning electron micrographs, C, D¼cross-sectional transmission electron micrographs. A and C¼Magna, B and D¼Dorylas I.
Fig. 5.Mean wing reflectance of univoltineP. dorylas(Magna; n¼10), bivoltine P. dorylasfirst generation (Dorylas I; n¼9), and second generation (Dorylas II; n¼8) male specimens measured with an integrating sphere optical setup. The spectra were normalized to the maxima of the reflectance peaks in the blue wavelength region. One can observe that reflectance peaks of the structural blue colors are coincident. The portion of reflectance originating from melanin pigmentation (>600 nm) inDorylas I specimens was higher but there was no difference in the blue structural color.
Z. Balint et al. / Arthropod Structure & Development 53 (2019) 100887 6
much smaller than those in the wild, resulting in smaller wing surfaces with smaller scales (to be published).
5. Summary
Our experiments and observations demonstrate that size of wing surface area and the scales covering the wing membrane are subject to change in polyommatine lycaenids. This phenomenon can be attributed for gainingfitness via the control of environ- mental variables by body size and temperature (Kingsolver and Huey, 2008). In contrast, the color-generating nanoarchitectures producing the male species-specific color located in the scale lumen cannot be altered significantly using variables provided by the environment. Therefore, it can be concluded that the color used for sexual signaling in males is rigorously controlled by the genome of the species and this is crucial for keeping the identity if the or- ganism lives in a community of many closely related and similarly colored and patterned taxa (Balint et al., 2012).
Author contribution
ZsB, BLP conceptualization of the project and manuscript writing. GPK, KK, GP measurements. GP, KK data analysis, visuali- zation. ZsEH electron microscopy. BLP, KK funding acquisition. All authors revised the manuscript and read and approved thefinal version.
Funding
This work was supported by the National Research, Develop- ment and Innovation OfficeeNKFIH K 111741 and K 115724 grants.
Appendix A. Supplementary data
Supplementary data to this article can be found online at https://doi.org/10.1016/j.asd.2019.100887.
References
Balint, Z., 1985.Plebicula dorylas magnanov. ssp. (Lep.: Lycaenidae) from the eastern Carpathians, Roumania. Neue Entomol. Nachr. 14, 14e20.
Balint, Zs, 1987. Notes on Plebicula dorylas magna Balint, 1985 (Lepidoptera, Lycaenidae). Nota Lepidopterol. 10, 49e52.
Balint, Z., Horvath, Z.E., Kertesz, K., Vertesy, Z., Biro, L.P., 2007. Observations on scale structures and spectroscopic properties ofPolyommatuslycaenid butterflies (Lepidoptera, Lycaenidae). Ann. Hist.-Nat. Musei Natl. Hung. 99, 115e127.
Balint, Zs, Kertesz, K., Piszter, G., Vertesy, Z., Biro, L.P., 2012. The well-tuned blues:
the role of structural colours as optical signals in the species recognition of a local butterfly fauna (Lepidoptera: Lycaenidae: Polyommatinae). Interface 9, 1745e1756.
Biro, L.P., Vigneron, J.P., 2010. Photonic nanoarchitectures in butterflies and beetles:
valuable sources for bioinspiration. Laser Photonics Rev. 5, 27e51.
Biro, L.P., Balint, Zs, Kertesz, K., Vertesy, Z., Mark, G.I., Horvath, Z.E., Balazs, J., Mehn, D., Kiricsi, I., Lousse, V., Vigneron, J.P., 2003. Role of photonic-crystal-type structures in the thermal regulation of a lycaenid butterfly sister species pair.
Phys. Rev. E 67, 021907, 021907.
Dhungel, B., Otaki, J.M., 2014. Morphometric analysis of nymphalid butterfly wings:
number, size and arrangement of scales, and their implications for tissue-size determination. Entomol. Sci. 17, 207e218.
Dinwiddie, A., Null, R., Pizzano, M., Chuong, L., Leigh Krup, A., Ee Tan, H., Patel, N.H., 2014. Dynamics of F-actin prefigure the structure of butterfly wing scales. Dev.
Biol. 392 (2), 404e418.
Geiger, H. (Ed.), 1987. Schmetterlinge und ihre Lebensr€aume: Arten - Gef€ahrdung - Schutz, Band 1: Tagfalter und ihre Lebensr€aume. Schweizerischer Bund für Naturschutz, Egg, Zürich. XIþ516.
Ghiradella, H.T., Butler, M.W., 2009. Many variations on a few themes: a broader look at development of iridescent scales (and feathers). Interface 6, S243eS251.
Greenstein, M.E., 1972. The ultrastructure of developing wings in the giant silkmoth, Hyalophora cecropia. II. Scale-forming and socket-forming cells. J. Morphol. 136 (1), 23e51.
Henriksen, H.J., Kreutzer, I.B., 1982. The Butterflies of Scandinavia in Nature.
Skandinavisk Bogforlag, Odense.
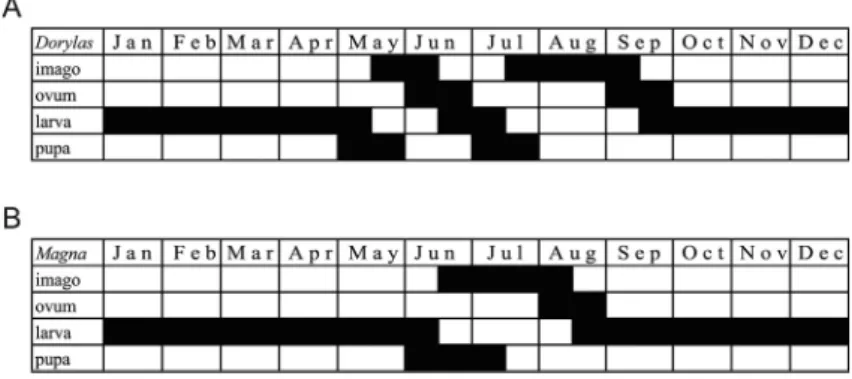
Fig. 6.Life history diagrams ofP. dorylascompiled on the basis of specimens preserved in the Hungarian Natural History Museum. A¼bivoltineDorylaspopulation from the Pannonian Lowlands; B¼univoltineMagnapopulation from the Eastern Carpathians. In the opening columns, the developmental stages are indicated, months are represented in thefirst rows. The lengthened time for larval development ofMagnais highly evident.
Fig. 7.Sunshine hours during the summer of 2018. Flight periods of the butterflies are indicated by gray blocks. A¼bivoltineDorylas I-IIin Pannonia (in vicinity of Budapest), B¼univoltineMagnain Transylvania (Eastern Carpathians). The far less number of hours with sunshine forMagnais highly evident (data source: weatheronline.co.uk).
alint et al. / Arthropod Structure & Development 53 (2019) 100887 7
Imafuku, M., Kitamura, T., 2018. Preference virgin females for male wing color in a sexually dichromatic butterfly,Pseudozizeeria maha(Lycaenidae). J. Lepid. Soc.
72 (3), 212e217.
Iwata, M., Ohno, Y., Otaki, J.M., 2014. Real-time in vivo imaging of butterfly wing development: revealing the cellular dynamics of the pupal wing tissue. PLoS One 9 (2), e89500.
Kemp, D.J., Rutowski, R.L., 2011. The role of coloration in mate choice and sexual interactions in butterflies. Adv. Stud. Behav. 43, 55e92.
Kertesz, K., Piszter, G., Balint, Z., Biro, L.P., 2019. Biogeographical patterns in the structural blue of malePolyommatus icarusbutterflies. Sci. Rep. 9, 2338.
Kertesz, K., Piszter, G., Horvath, Z.E., Balint, Z., Biro, L.P., 2017. Changes in structural and pigmentary colors in response to cold stress inPolyommatus icarusbut- terflies. Sci. Rep. 7, 1118.
Kingsolver, J.G., Huey, R.B., 2008. Size, temperature, andfitness: three rules. Evol.
Ecol. Res. 10, 251e268.
Lafranchis, T., Jutzeler, D., Guillosson, J.-Y., Kan, P., Kan, B., 2015. La Vie des Papillons.
Ecologie, Biologie et Comportement des Rhopaloceres de France. Diatheo.
Nygren, G.H., Bergstr€om, A., Nylin, S., 2008. Latitudinal body size clines in the butterfly Polyommatus icarus are shaped by gene-environment interactions.
Int. J. Insect Sci. 8 (47), 1e13.
Pendry, J.B., MacKinnon, A., 1992. Calculation of photon dispersion relations. Phys.
Rev. Lett. 69, 2772e2775.
Piszter, G., Kertesz, K., Balint, Z., Biro, L.P., 2016. Variability of the structural color- ation in two butterfly species with different prezygotic mating strategies. PLoS One 11 (11), e0165857.
Schmidt, K., Paulus, H., 1970. Die Feinstruktur der Flügelschuppen einiger Lycae- nidae (Insecta, Lepidoptera). Z. Morphol. Tiere 66, 224e241.
Simonsen, T.J., Kristensen, N.P., 2003. Scale length/wing length correlation in Lepidoptera (Insecta). J. Nat. Hist. 37, 673e679.
Slamka, F., 2004. Die Tagfalter Mitterleuropase€ostlicher Teil. Bestimmung. Biotope und Bionomie, Gef€ahrdung. Frantisek Slamka, Bratislava.
Szabo, R., 1956. Magyarorszag Lycaenidai (lycaenids of Hungary). Folia Entomol.
Hung. 9, 235e362 (in Hungarian).
Talavera, G., Lukthanov, V.A., Pierce, N.E., Vila, R., 2013. Establishing criteria for higher level taxonomic classification using molecular data: the systematics of Polyommatus blue butterflies (Lepidoptera, Lycaenidae). Cladistics 29, 166e192.
Tilley, R.J.D., Eliot, J.N., 2002. Scale microstructure and its phylogenetic implications in lycaenid butterflies (Lepidoptera, Lycaenidae). Trans. Lepidopterol. Soc. Jpn.
53 (3), 153e180.
Tolman, T., Lewington, R., 1997. Butterflies of Britain and Europe (Collins Field Guide). HarperCollins, London.
Tshikolovtes, V., 2011. Butterflies of Europe&the Mediterranean Area. Tshikolovets Publications, Pardubice.
Vila, R., Bell, C.D., Macniven, R., Goldman-Huertas, B., Ree, R.H., Marshall, C.R., Balint, Z., Johnson, K., Benyamini, D., Pierce, N.E., 2011. Phylogeny and palae- oecology ofPolyommatusblue butterflies show Beringia was a climate-regu- lated gateway to the New World. Proc. Biol. Sci. 278 (1719), 2737e2744.
Wilts, B.D., Leertouwer, H.L., Stavenga, D.G., 2009. Imaging scatterometry and microspectrophotometry of lycaenid butterfly wing scales with perforated multilayers. J. R. Soc. Interface 6, 185e192.
Yeh, P., 2005. Optical Waves in Layered Media. Wiley, New York, NY.
Z. Balint et al. / Arthropod Structure & Development 53 (2019) 100887 8