Distinct patterns of Internet and smartphone-related problems among adolescents by gender: Latent class analysis
SEUNG-YUP LEE1, DONGHWAN LEE2, CHO RONG NAM3, DA YEA KIM2, SERA PARK4, JUN-GUN KWON4, YONG-SIL KWEON1*, YOUNGJO LEE5, DAI JIN KIM6and JUNG-SEOK CHOI3,7*
1Department of Psychiatry, College of Medicine, Uijeongbu St. Mary’s Hospital, The Catholic University of Korea, Seoul, Republic of Korea
2Department of Statistics, Ewha Womans University, Seoul, Republic of Korea
3Department of Psychiatry, SMG-SNU Boramae Medical Center, Seoul, Republic of Korea
4I Will Center, Seoul Metropolitan Boramae Youth Center, Seoul, Republic of Korea
5Department of Statistics, Seoul National University, Seoul, Republic of Korea
6Department of Psychiatry, College of Medicine, Seoul St. Mary’s Hospital, The Catholic University of Korea, Seoul, Republic of Korea
7Department of Psychiatry and Behavioral Science, College of Medicine, Seoul National University, Seoul, Republic of Korea (Received: August 21, 2017; revised manuscript received: March 9, 2018; accepted: March 24, 2018)
Background and objectives:The ubiquitous Internet connections by smartphones weakened the traditional bound- aries between computers and mobile phones. We sought to explore whether smartphone-related problems differ from those of computer use according to gender using latent class analysis (LCA).Methods: After informed consents, 555 Korean middle-school students completed surveys on gaming, Internet use, and smartphone usage patterns. They also completed various psychosocial instruments. LCA was performed for the whole group and by gender. In addition to ANOVA andχ2tests, post-hoc tests were conducted to examine differences among the LCA subgroups.Results:In the whole group (n=555), four subtypes were identified: dual-problem users (49.5%), problematic Internet users (7.7%), problematic smartphone users (32.1%), and“healthy”users (10.6%). Dual-problem users scored highest for addictive behaviors and other psychopathologies. The gender-stratified LCA revealed three subtypes for each gender.
With dual-problem and healthy subgroup as common, problematic Internet subgroup was classified in the males, whereas problematic smartphone subgroup was classified in the females in the gender-stratified LCA. Thus, distinct patterns were observed according to gender with higher proportion of dual-problem present in males. While gaming was associated with problematic Internet use in males, aggression and impulsivity demonstrated associations with problematic smartphone use in females.Conclusions:An increase in the number of digital media-related problems was associated with worse outcomes in various psychosocial scales. Gaming may play a crucial role in males solely displaying Internet-related problems. The heightened impulsivity and aggression seen in our female problematic smartphone users requires further research.
Keywords:Internet, smartphone, addiction, latent class analysis, gender, game
INTRODUCTION
Information technologies and wireless communications have brought rapid changes in everyday life. Communica- tion, education, entertainment, and commercial transactions are increasingly taking place online. In Europe, household Internet access rose from 55% in 2007 to 85% in 2015, and Internet access through a mobile device also increased from 36% in 2012 to 59% in 2016 (Eurostat, 2017). Personal computers and smartphones have also become popular among children and adolescents. Indeed, even mentioning the increased use by adolescents appears as a cliché in the current climate.
Despite effecting many convenient and positive changes in education and recreation, excessive or inappropriate use of the new digital media by children and adolescents has heightened the concerns of parents and the wider
community, including schools, with respect to potential disruption of normal development and academic achieve- ment, and exposure to inappropriate content, such as por- nography. The negative consequences of the new digital media on physical health may range from obesity to even death by accident, with the greatest danger associated with smartphones posed by use while crossing the road, as
* Corresponding authors: Jung-Seok Choi, MD, PhD; Department of Psychiatry, SMG-SNU Boramae Medical Center, 20, Boramae-ro 5-gil, Dongjak-gu, Seoul 07061, Republic of Korea; Phone: +82 2870 3461; Fax: +82 2831 2826; E-mail: choijs73@gmail.com;
Yong‑Sil Kweon, MD, PhD; Department of Psychiatry, College of Medicine, Uijeongbu St. Mary’s Hospital, The Catholic University of Korea, 222 Banpo‑daero, Seocho‑gu, Seoul 06591, Republic of Korea; Phone: +82 31 820 3032; Fax: +82 31 847 3630; E‑mail:
yskwn@catholic.ac.kr
This is an open-access article distributed under the terms of theCreative Commons Attribution-NonCommercial 4.0 International License, which permits unrestricted use, distribution, and reproduction in any medium for non-commercial purposes, provided the original author and source are credited, a link to the CC License is provided, and changes–if any–are indicated.
DOI: 10.1556/2006.7.2018.28 First published online May 15, 2018
reported for younger age groups (Ayers et al., 2016;Hull, Draghici, & Sargent, 2012; Lennon, Oviedo-Trespalacios,
& Matthews, 2017;Vandewater, Shim, & Caplovitz, 2004).
Prior research has indicated that such misuse may also negatively impact mental health, by increasing sleep distur- bance, depression, anxiety, impulsivity, and even suicidality (Achab et al., 2011;Gentile et al., 2011;Kim et al., 2006;
Messias, Castro, Saini, Usman, & Peeples, 2011; Wei, Chen, Huang, & Bai, 2012; Weinstein & Weizman, 2012; Wu, Tao, Zhang, Zhang, & Tao, 2015).
During their youth, today’s parents may have used computers or conventional mobile phones, but were not exposed to the high-speed Internet connections and smart- phones that their offspring use. Thus, they may experience difficulties in recognizing a problematic use or features associated with it. Although concerned, parents and the wider community could be confused by these new electronic media phenomena and may also experience difficulties in guiding their children in their use.
As per the famous old saying of “time will tell,” longitudinal studies and the passage of time will provide clarity regarding the consequences of new media usage, especially for highly excessive patterns of use. To achieve this, adequate classification of the problem is essential.
However, it is also uncertain whether the problems related to smartphones are distinct from the Internet-related problems associated with the computer use. Most previous studies were concerned either with smartphones or computers but not both, despite this uncertainty. In addi- tion to the device-related factors, individual characteristics may also influence the usage patterns. Thus, any explora- tion of these relatively new phenomena faces many challenges.
Latent class analysis (LCA) may represent a valuable tool, because it requires no structural modeling. Rather than relying on fixed assignments, LCA derives a set of latent variables from a series of observed variables and allocates them to a latent class. Thus, this analytical method may be particularly useful in revealing patterns of use of new digital media and, in turn, for adequate classification by usage pattern. A few studies used LCA as a statistical method to explore potential gaming (Borsari et al., 2013;Carras et al., 2017;Kiraly et al., 2017;Lemmens, Valkenburg, & Gentile, 2015), Internet addiction (Rumpf et al., 2014), and social network service-using subgroups (Dantlgraber, Wetzel, Schutzenberger, Stieger, & Reips, 2016). However, only one study, which was conducted by some of the present authors, simultaneously analyzed both Internet- and smartphone-related problems (Mok et al., 2014).
In the previous study, Internet and smartphone usage patterns were found to differ by gender among university students. Three distinct Internet and smartphone user groups were identified for each gender. Males were classi- fied into similar low, moderate, and high addiction groups for both Internet and smartphone use. However, females showed different usage patterns. While two female sub- groups displayed low and high levels of addiction to both Internet and smartphone usage, the remaining subgroup demonstrated low addiction to the Internet but high addic- tion to smartphones, rather than simply a moderate level of addiction to both.
Thus, the previous studyfirst revealed a different pattern of addictive use of the Internet and/or smartphones by gender according to LCA (Mok et al., 2014). Although the demonstration of such a gender difference made a meaning- ful contribution to the literature, there was also a major limitation; specifically, no plausible explanation was pro- vided for the gender difference.
To overcome the shortcomings of prior studies, we explored Internet and smartphone usage patterns in a larger sample, and captured more detailed information on digital media use and a broader range of psychosocial variables that are known to be associated with problematic use, such as depression, anxiety, attention-deficit hyperactivity disorder (ADHD), aggression, and impulsivity. Considering the fact that the fronto-striatal mismatch in neurodevelopment of the juvenile brains renders the adolescents to increased impul- sivity (Galvan, Hare, Voss, Glover, & Casey, 2007), this study employed a range of instruments that measure various aspects of dysregulated cognitive control or reward-seeking.
It was postulated that such comprehensive assessment of multiple domains may better reveal of which psychosocial characteristics are more related to excessive use pattern of the Internet or smartphones. Moreover, no study has exam- ined patterns of addictive use of the Internet and/or smart- phones by gender in adolescents using LCA. Thus, the primary objective of this study was to examine, in a relatively large sample, whether the previously demonstrat- ed gender differences in electronic media usage also applied to adolescents. Second, we sought to identify psychosocial and media-related factors contributing to such gender dif- ferences in adolescents.
METHODS
Participants
In total, 714 students from five public middle schools in Seoul, Republic of Korea participated in this study. Differ- ent school years may act as confounders due to differences in developmental stage or culture. Therefore, we recruited all the participants from same school year of year 9 to ensure the homogeneity of our sample. The participating students completed the questionnaires at their own school and gift vouchers were provided as a reward for participation. We excluded 159 samples due to missing values on either the Internet or Smartphone Addiction Scales (SASs). Conse- quently, 555 students (295 males and 260 females) were included in thefinal analysis.
Measures
Internet Addiction Test (IAT).The IAT is a 20-item scale, developed by Young to assess the severity of addiction to the Internet. Each item is rated on a 5-point scale from ranging 1 (very rarely) to 5 (very frequently). Total scores on the instrument can range from 20 to 100, with a higher total scores indicating more severe Internet addiction (Young, 1999). The overall Cronbach’s α coefficient was .889 in a meta-analysis (Frangos, Frangos,
& Sotiropoulos, 2012).
Smartphone Addiction Scale (SAS).The SAS consists of 33 items that evaluate problematic smartphone use across six domains: daily-life disturbance, positive anticipation, withdrawal, cyberspace-oriented relationship, overuse, and tolerance. Each item is rated on a 6-point scale ranging from 1 (strongly disagree) to 6 (strongly agree). A higher total SAS score indicates more severe smartphone addiction (Kwon et al., 2013). It previously demonstrated a good internal consistency with the Cronbach’s α coefficient of .967 (Kwon et al., 2013).
Behavioral Inhibition System/Behavioral Activation System Scales (BIS/BAS). The BIS and BAS Scales were developed based on Gray’s biopsychological theory of personality to assess sensitivity to punishment and rewards, respectively (Carver & White, 1994; Gray, 1990). Altogether, they consist of 20 items, which are rated on 4-point scales ranging from 1 (very true for me) to 4 (very false for me). The BIS contains seven items that measure attitudes toward potentially unpleasant stimuli/anticipated punishments. The BAS consists of 13 items that measure the degree of motivation for rewards/goals/pleasure, which can further be subdivided into three subscales: reward respon- siveness (BAS-R), drive to pursue goals (BAS-D), and fun- seeking (BAS-F;Carver & White, 1994). The Cronbach’sα coefficient for BIS was .74, while the coefficient values for BAS-R, BAS-D, and BAS-F were .73, .76, and .66, respec- tively (Carver & White, 1994).
Beck Depression Inventory (BDI).The BDI is a 21-item self-rated questionnaire assessing the severity of depressive symptoms experienced in the past week on a 4-point scale (Beck, Ward, Mendelson, Mock, & Erbaugh, 1961). The validated Korean version was used, which showed the Cronbach’sα coefficient of .85 (Rhee et al., 1995).
Beck Anxiety Inventory (BAI).The BAI is a 21-item self- rated questionnaire assessing the severity of anxiety symp- toms experienced during the past week on a 4-point scale (Beck, Epstein, Brown, & Steer, 1988). In Korean valida- tion, it displayed a good internal consistency with the Cronbach’sα coefficient of .93 (Kim et al., 2016).
Conners-Wells’ Adolescent Self-Report Scale – short version (CASS-S).The CASS-S consists of 27 items that assess ADHD symptoms, focusing on cognitive, hyperactivity- related, and conduct problems in adolescents based on a 4-point scale ranging from 0 (not true) to 3 (very often) (Conners, 1997). The CASS-S demonstrated good internal consistency with the Cronbach’s αcoefficient of .88 (Bahn, Shin, Cho, & Hong, 2001).
Barratt Impulsiveness Scale (BIS-11). The BIS-11 is a 30-item self-report questionnaire that assesses impulsivity.
Originally developed in 1959, it is currently in its 11th iteration. It assesses three facets of impulsivity–attentional, motor, and non-planning–which are also measured by the Korean version (Lee et al., 2012; Patton, Stanford, &
Barratt, 1995). The BIS-11 displayed a fair internal consis- tency with the Cronbach’sα coefficient ranging from .79 to .83 (Patton et al., 1995).
Aggression Questionnaires (AQs). The AQ consists of 29 items that assess physical aggression, verbal aggression, hostile aggression, and anger. Each item is rated on a 5-point scale ranging from 1 (uncharacteristic of me) to 5 (very characteristic of me) (Buss & Perry, 1992). The AQ showed
a good internal consistency with the Cronbach’sα coeffi- cient of .889 (Buss & Perry, 1992).
Anger Expression Scale (AX).The AX is a 24-item scale with eight questions each on anger-in, anger-out, and anger- control (Spielberger et al., 1985). It measures the frequency of anger experience and expression, and has been validated for use in Korean populations with Cronbach’sαcoefficient ranging from .73 to .81 (Hahn, Lee, & Chon, 1998).
Internet/smartphone usage patterns survey. We also in- vestigated specific patterns of Internet usage. First, the ado- lescents indicated the age at which they started using the Internet, the nature of their Internet use, including games and other activities (e.g., social networking sites, messenger, and web surfing), and daily amount of Internet use on weekdays and weekends. They also indicated their reasons for using the Internet. We also determined the daily amount of time spent using smartphones on weekdays and weekends.
Data analyses
Data analyses were performed according to the following four steps: (a) descriptive statistics were generated to exam- ine the overall distributions of the variables; (b) independent t-tests were performed to identify gender differences with regard to Internet and smartphone addiction; (c) LCA was used for classifying the subgroups (i.e., latent classes) based on the extent of Internet and smartphone addiction, for both males and females; and (d) analysis of variance (ANOVA) and χ2 tests were carried out to examine difference in variables, such as personality, clinical features, and usage patterns among the subgroups.
LCA is a statistical method to identify homogeneous classes, where the homogeneity may not be observed directly, but instead through latent variables derived from a series of observed variables (Hagenaars & McCutcheon, 2002). Be- cause LCA assesses the probability of a given case belonging to a particular latent class, instead of making a prior assign- ment to a model, the method could be particularly useful for classifying new phenomena without potentially subjective biases from modeling, and may overcome the shortcomings associated with cluster analysis. In this study, we used log- transformed data in LCA for the normal approximation.
To determine the best-fitting LCA model, the following objectives of statistical indices were considered: the Bayesian information criterion (BIC), Akaike information criterion (AIC), and the Bootstrap Likelihood Ratio Test (BLRT).
The BIC and AIC are descriptive indices of thefitness of the LCA model, with lower values indicating a better fit. The BLRT statistically tests whether the current model (nclasses) is better than the former model (n−1 classes). When the cur- rent model significantlyfits better than the former model, the BLRT also yields a significantpvalue (Nylund, Asparouhov,
& Muthén, 2007).
After determining the best-fitting model with the optimal number of classes, according to these reliable and widely used indices, cross-class comparisons were performed. Psy- chosocial and digital media-related variables, such as IAT and SAS scores, and electronic media usage survey data were compared among the latent classes. These interclass comparisons were carried out using ANOVA and χ2tests for continuous and categorical values, respectively. When
significant differences were found, post-hoc tests were performed using Tukey’s honest significant difference tests.
The R software package was used for all statistical proce- dures (R Development Core Team, 2011). All analyses were conducted takingp<.05 as the level of significance.
Ethics
All subjects received an explanation about the research and provided written informed consent prior to participation.
The study was approved by the Institutional Review Board of Seoul St. Mary’s Hospital, Seoul, Republic of Korea (KC15EISI0103) and was conducted in accordance with the Declaration of Helsinki.
RESULTS
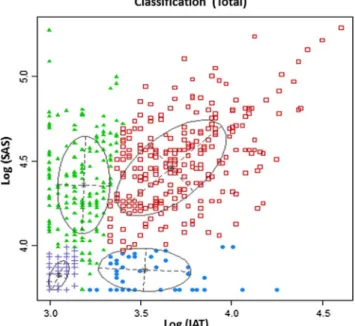
For the LCA of all students (N=555), a four-class model was determined as the best-fitting model according to the estimated BIC (Table1).
The four classes were as follows: (a) dual-problem group, demonstrating high severity for both Internet- and smart- phone-related problems; (b) problematic Internet group, displaying high severity for Internet-related problems but low severity for smartphone-related problems; (c) problem- atic smartphone group, showing low severity for Internet- related problems but high severity for smartphone-related problems; and (d) a “healthy”group scoring low for both Internet- and smartphone-related problems (Figure1).
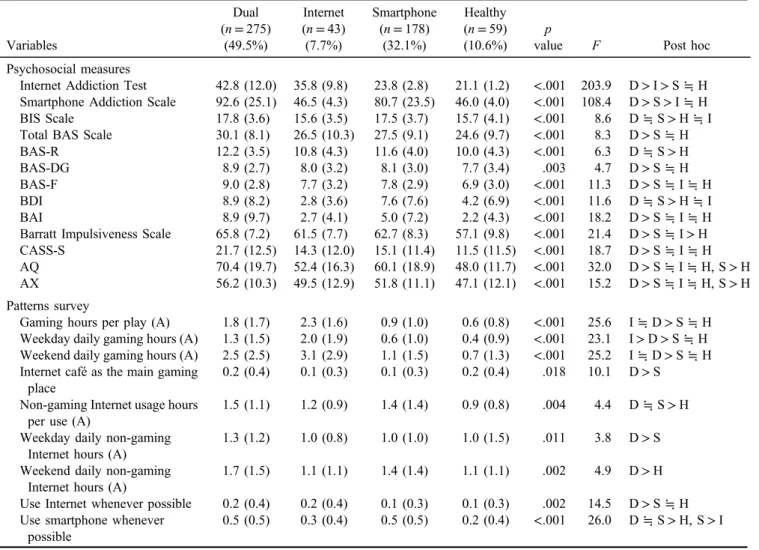
Post-hoc interclass comparisons revealed that the dual- problematic group was more likely to score higher on the Internet and smartphone problem questionnaires, as well as worse psychosocial outcomes in general (Table2).
The dual-problem group significantly demonstrated higher scores than the problematic Internet user group on the IAT (42.8 vs. 35.8, p<.001), SAS (92.6 vs. 46.5, p<.001), BIS (17.8 vs. 15.6, p=.002), BAS-F (9.0 vs.
7.7,p=.041), BDI (8.9 vs. 2.8,p<.001), BAI (8.9 vs. 2.7, p<.001), BIS-11 (65.8 vs. 61.5, p=.005), CASS-S (21.7 vs. 14.3,p=.002), AQ (70.4 vs. 52.4,p<.001), and AX (56.2 vs. 49.5, p=.002). However, there was no significant difference in the average number of hours spent gaming in one session, or the average number of hours spent gaming at the weekend, between the dual-problem group and the problematic Internet group.
The dual-problem group also significantly showed higher scores than the problematic smartphone group on the IAT
(42.8 vs. 23.8, p<.001), SAS (92.6 vs. 80.7, p<.001), BAS (30.1 vs. 27.5, p=.013), BAS-D (8.9 vs. 8.1, p=.019), BAS-F (9.0 vs. 7.8, p<.001), BAI (8.9 vs.
5.0, p<.001), BIS-11 (65.8 vs. 62.7, p<.001), CASS-S (21.7 vs. 15.1,p<.001), AQ (70.4 vs. 60.1,p<.001), and AX (56.2 vs. 51.8,p<.001). In addition, the average hours spent gaming (1.8 vs. 0.9 hr, p<.001), average daily gaming hours on weekday (1.3 vs. 0.6 hr, p<.001) and weekend (2.5 vs. 1.1 hr, p<.001), hours of daily non-gaming Internet usage on weekdays (1.3 vs. 1.0 hr, p=.017), preference for Internet cafés as a gaming venue (0.2 vs. 0.1,p=.013), and positive response rate to the use of the Internet whenever possible (0.2 vs. 0.1, p=.010) were significantly greater in the dual group than the prob- lematic smartphone group. However, the dual-problem and the problematic smartphone groups showed no statistical difference in BIS, BAS-R, or BDI scores, or in the number of hours of non-gaming Internet use or use of smartphone whenever possible in the post-hoc analysis.
The problematic Internet group played games for signifi- cantly longer time than the dual-problem group on average on weekdays (2.0 vs. 1.3 hr,p=.010). When compared with the problematic smartphone user group, the problematic Internet user group had significantly higher IAT scores (35.8 vs. 23.8, p<.001), a higher average number of hours spent gaming in one session (2.3 vs. 0.9 hr, p<.001), and a higher average number of hours spent gaming on weekdays (2.0 vs. 0.6 hr, p<.001) and at the weekends (3.1 vs. 1.1 hr,p<.001).
On the contrary, the problematic smartphone group scored significantly higher on the SAS (80.7 vs. 46.5, p<.001), BIS (17.5 vs. 15.6,p=.013), and BDI (7.6 vs. 2.8,p=.002), and were more likely to use smartphone whenever possible (0.5 vs. 0.3, p=.027) than the problematic Internet user group. No significant differences existed between the two groups for BAS-F, BAI, CASS-S, AQ, or AX scores.
As shown in Table 3, the male (n=295) and female (n=260) students differed significantly with respect to Table 1. Indicators offit for models in the whole subjects (N=555)
Model BIC AIC BLRTpvalue
Two classes 614.6392 571.4495 .001
Three classes 583.8394 519.0549 .001
Four classes 583.1744 496.7950 .001
Five classes 607.9873 500.0131 .390
Note.Bold value represents the lowest BIC value and signifies that the model composed by four class is most fit. AIC: Akaike information criterion; BIC: Bayesian information criterion; BLRT:
Bootstrap Likelihood Ratio Test.
Figure 1. Latent class analysis of the whole subjects. SAS:
Smartphone Addiction Scale; IAT: Internet Addiction Test
numerous variables related to gaming, and in terms of Internet and smartphone usage. However, the demographic variables of age and household income did not demonstrate significant differences between the genders. The males displayed higher alcohol consumption experience than the females (0.2% vs. 0.1%,p=.05), but smoking or psychiat- ric treatment histories did not differ by the gender. The females demonstrated more severe addiction than the males according to the SAS (85.9 vs. 74.9, respectively,p<.001), whereas males showed higher IAT scores than females (36.4 vs. 31.0, respectively,p<.001). The average daily number of hours of use, of the non-gaming Internet and smartphones on weekdays and at the weekend, was higher in females. On the contrary, the males on average spent more time gaming on weekdays and at weekends. While the duration of Internet use per session was significantly longer in females, individual gaming sessions were significantly longer in males. Significant differences in psychosocial variables were also observed between genders. Scores on the psycho- metric instruments were generally higher in females, except for the CASS-S, BIS-11, and AQ (Table3).
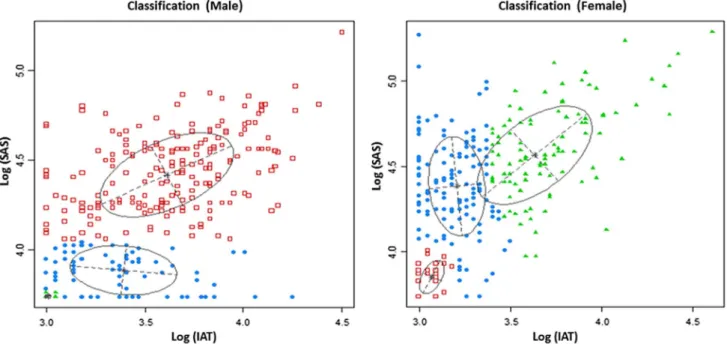
Reflecting the large gender differences, separate LCAs were performed for each gender. Unlike the four-class model for the whole group, a three-class model showed the bestfit, according to the estimated BIC, for both the male and female students (Table 4).
However, the classification of the three subtypes differed by gender. The males were classified as (a) dual-problem users, (b) problematic Internet users, and (c) healthy users.
For the females, however, a problematic smartphone group was identified instead of a problematic Internet group (Figure2).
Interclass comparisons of the male subgroups showed similar results to those of the whole-group model. The dual-problem group displayed more severe psychopathology and addictive behaviors than the problematic Internet and the healthy groups (Table 5). The problematic Internet group showed significantly higher IAT scores (30.6 vs. 20.2, p=.013), more hours of gaming per session (2.1 vs. 0.8 hr, p=.004), and more hours of gaming on weekdays (1.7 vs.
0.5 hr,p=.026) and at the weekends (2.7 vs. 1.0 hr,p=.025), on average, than the healthy group in post-hoc analyses.
Table 2. Interclass comparison of the whole subjects (N=555)
Variables
Dual (n=275)
(49.5%)
Internet (n=43) (7.7%)
Smartphone (n=178)
(32.1%)
Healthy (n=59) (10.6%)
p
value F Post hoc
Psychosocial measures
Internet Addiction Test 42.8 (12.0) 35.8 (9.8) 23.8 (2.8) 21.1 (1.2) <.001 203.9 D>I>S≒H Smartphone Addiction Scale 92.6 (25.1) 46.5 (4.3) 80.7 (23.5) 46.0 (4.0) <.001 108.4 D>S>I≒H BIS Scale 17.8 (3.6) 15.6 (3.5) 17.5 (3.7) 15.7 (4.1) <.001 8.6 D≒S>H≒I Total BAS Scale 30.1 (8.1) 26.5 (10.3) 27.5 (9.1) 24.6 (9.7) <.001 8.3 D>S ≒H
BAS-R 12.2 (3.5) 10.8 (4.3) 11.6 (4.0) 10.0 (4.3) <.001 6.3 D≒S>H
BAS-DG 8.9 (2.7) 8.0 (3.2) 8.1 (3.0) 7.7 (3.4) .003 4.7 D>S ≒H
BAS-F 9.0 (2.8) 7.7 (3.2) 7.8 (2.9) 6.9 (3.0) <.001 11.3 D>S ≒I≒H
BDI 8.9 (8.2) 2.8 (3.6) 7.6 (7.6) 4.2 (6.9) <.001 11.6 D≒S>H≒I
BAI 8.9 (9.7) 2.7 (4.1) 5.0 (7.2) 2.2 (4.3) <.001 18.2 D>S ≒I≒H
Barratt Impulsiveness Scale 65.8 (7.2) 61.5 (7.7) 62.7 (8.3) 57.1 (9.8) <.001 21.4 D>S ≒I>H CASS-S 21.7 (12.5) 14.3 (12.0) 15.1 (11.4) 11.5 (11.5) <.001 18.7 D>S ≒I≒H AQ 70.4 (19.7) 52.4 (16.3) 60.1 (18.9) 48.0 (11.7) <.001 32.0 D>S≒I≒H, S>H AX 56.2 (10.3) 49.5 (12.9) 51.8 (11.1) 47.1 (12.1) <.001 15.2 D>S≒I≒H, S>H Patterns survey
Gaming hours per play (A) 1.8 (1.7) 2.3 (1.6) 0.9 (1.0) 0.6 (0.8) <.001 25.6 I≒D>S ≒H Weekday daily gaming hours (A) 1.3 (1.5) 2.0 (1.9) 0.6 (1.0) 0.4 (0.9) <.001 23.1 I>D>S≒H Weekend daily gaming hours (A) 2.5 (2.5) 3.1 (2.9) 1.1 (1.5) 0.7 (1.3) <.001 25.2 I≒D>S ≒H Internet café as the main gaming
place
0.2 (0.4) 0.1 (0.3) 0.1 (0.3) 0.2 (0.4) .018 10.1 D>S Non-gaming Internet usage hours
per use (A)
1.5 (1.1) 1.2 (0.9) 1.4 (1.4) 0.9 (0.8) .004 4.4 D≒S>H Weekday daily non-gaming
Internet hours (A)
1.3 (1.2) 1.0 (0.8) 1.0 (1.0) 1.0 (1.5) .011 3.8 D>S Weekend daily non-gaming
Internet hours (A)
1.7 (1.5) 1.1 (1.1) 1.4 (1.4) 1.1 (1.1) .002 4.9 D>H Use Internet whenever possible 0.2 (0.4) 0.2 (0.4) 0.1 (0.3) 0.1 (0.3) .002 14.5 D>S ≒H Use smartphone whenever
possible
0.5 (0.5) 0.3 (0.4) 0.5 (0.5) 0.2 (0.4) <.001 26.0 D≒S>H, S>I
Note.A: average; AQ: Aggression Questionnaire; AX: Anger Expression Scale; BDI: Beck Depression Inventory; BAI: Beck Anxiety Inventory; BIS: Behavioral Inhibition System; BAS: Behavioral Activation System (R: reward responsiveness; DG: drive to pursuit goals;
F: fun-seeking); CASS-S: Conners-Wells’ Adolescent Self-Report Scale–short version; D: dual-problematic group; H: healthy group;
I: Internet problem group; S: smartphone problem group.
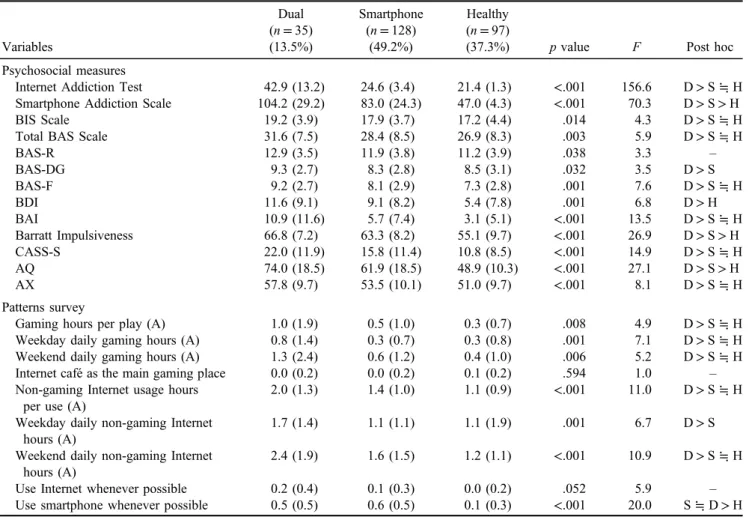
In the female LCA model, the dual-problem group demon- strated higher scores on psychosocial measurements and
addictive behaviors than the problematic smartphone and the healthy groups (Table 6). The problematic smart- phone group scored significantly higher on the SAS (83.0 vs. 47.0,p<.001), BIS-11 (63.3 vs. 55.1,p<.001), and AQ (61.9 vs. 48.9, p<.001) than the healthy group.
Subjects in the problematic smartphone group were also more likely to respond positively to the question regard- ing the use of a smartphone whenever possible than the healthy group in the post-hoc analysis (0.6 vs. 0.1, p<.001).
DISCUSSION
In this study, we empirically showed that a four-class model most effectively categorized adolescents presenting with different degrees of problematic Internet and/or smartphone usage. The four classes generated by the LCA were as follows: (a) dual-problematic users, (b) problematic Internet Table 3. Psychosocial and digital media-related variables of the participants
Mean (SD)
Characteristics Total Male Female pvalue
Demographic variables
Age 13.9 (0.3) 13.9 (0.3) 13.9 (0.4) .214
Monthly household income .107
<$940 22 (5.7) 11 (5.0) 11 (6.8)
$940–1,880 32 (8.4) 17 (7.7) 15 (9.2)
$1,880–2,820 57 (14.9) 37 (16.8) 20 (12.3)
$2,820–3,760 84 (21.9) 47 (21.4) 37 (22.7)
$3,760–4,700 53 (13.8) 24 (10.9) 29 (17.8)
$4,700–5,640 46 (12.0) 30 (13.6) 16 (9.8)
$5,640–6,580 33 (8.6) 15 (6.8) 18 (11.0)
≥$6,580 56 (14.6) 39 (17.7) 17 (10.4)
Alcohol (+)a 0.04 (0.2) 0.06 (0.2) 0.02 (0.1) .050
Smoking (+)a 0.02 (0.1) 0.02 (0.1) 0.01 (0.1) .614
Psychiatric treatment history (+)a 0.02 (0.1) 0.03 (0.2) 0.01 (0.1) .154
Psychosocial variables
Behavioral Inhibition System 17.3 (3.7) 16.5 (3.3) 18.3 (3.9) <.001
Behavioral Activation System Scales 28.4 (9.0) 27.5 (9.5) 29.4 (8.3) .017
Beck Depression Inventory 7.5 (7.8) 5.7 (6.5) 9.5 (8.7) <.001
Beck Anxiety Inventory 6.5 (8.6) 5.7 (7.6) 7.3 (9.5) .034
CASS-S 17.9 (12.6) 18.3 (13.2) 17.4 (11.9) .422
Barratt Impulsiveness Scale 63.6 (8.3) 63.6 (7.9) 63.5 (8.8) .910
Aggression Questionnaires 59.0 (20.0) 57.5 (21.0) 60.6 (18.6) .070
State–Trait Anger Expression Inventory 53.3 (11.4) 51.9 (12.3) 54.8 (10.2) .003
Digital media-related variables
Internet Addiction Test 33.9 (13.1) 36.4 (13.1) 31.0 (12.5) <.001
Smartphone Addiction Scale 80.1 (28.0) 74.9 (24.2) 85.9 (30.7) <.001
Weekday non-gaming Internet hours per day (A) 1.1 (1.1) 1.0 (0.9) 1.3 (1.4) <.001 Weekend non-gaming Internet hours per day (A) 1.5 (1.4) 1.2 (1.1) 1.9 (1.7) <.001
Non-gaming Internet usage hours per use 1.4 (1.2) 1.2 (1.2) 1.6 (1.2) <.001
Weekday smartphone usage hours per day (A) 2.9 (2.5) 2.5 (2.0) 3.4 (2.8) <.001
Weekend smartphone usage hours per day (A) 3.8 (3.0) 3.1 (2.5) 4.6 (3.3) <.001
Weekday gaming hours per day (A) 1.0 (1.4) 1.5 (1.5) 0.5 (1.0) <.001
Weekend gaming hours per day (A) 1.9 (2.3) 2.8 (2.2) 0.8 (1.8) <.001
Gaming hours per play 1.4 (1.5) 2.0 (1.4) 0.7 (1.4) <.001
Note.A: average; CASS-S: Conners-Wells’ Adolescent Self-Report Scale–short version;SD: standard deviation.
aFrequency (%).
Table 4. Indicators offit for models in the males and the females
Model BIC AIC BLRTpvalue
Males (N=295)
Two classes 330.7431 293.8733 .009
Three classes 261.9221 206.6174 .001 Four classes 268.2498 194.5103 .004 Females (N=260)
Two classes 250.5642 214.9573 .001
Three classes 230.1625 176.7522 .001 Four classes 240.8185 169.6049 .030 Note.Bold values represent the lowest BIC values and signify that the models composed by three class are most fit. AIC: Akaike information criterion; BIC: Bayesian information criterion; BLRT:
Bootstrap Likelihood Ratio Test.
Figure 2. Latent class analysis of the males and the females. SAS: Smartphone Addiction Scale; IAT: Internet Addiction Test
Table 5. Interclass comparison of the males (n=295)
Variables
Dual (n=211) (71.5%)
Internet (n=71) (24.1%)
Healthy
(n=13) (4.4%) pvalue F Post hoc Psychosocial measures
Internet Addiction Test 39.4 (13.0) 30.6 (10.0) 20.2 (0.4) <.001 26.3 D>I>H Smartphone Addiction Scale 86.2 (19.4) 48.4 (5.1) 42.2 (0.4) <.001 163.8 D>I≒H
BIS Scale 17.0 (3.2) 15.3 (3.4) 15.8 (3.4) .001 6.9 D>I
Total BAS Scale 28.6 (9.0) 25.0 (9.5) 23.9 (12.6) .008 4.9 D>I
BAS-R 11.6 (3.7) 10.4 (4.3) 9.1 (4.7) .011 4.5 D>H
BAS-DG 8.5 (2.9) 7.5 (3.2) 7.6 (4.3) .042 3.2 D>I
BAS-F 8.5 (3.0) 7.2 (2.9) 7.2 (3.8) .002 6.2 D>I
BDI 6.9 (6.9) 2.9 (4.0) 2.5 (6.1) <.001 12.1 D>I≒H
BAI 7.1 (8.2) 2.7 (4.8) 0.9 (2.3) <.001 12.2 D>I≒H
Barratt Impulsiveness Scale 64.9 (7.3) 60.0 (8.3) 62.7 (10.0) <.001 10.8 D>I
CASS-S 20.7 (13.1) 11.5 (9.8) 16.8 (18.6) <.001 13.7 D>I
AQ 66.2 (21.1) 52.3 (14.8) 48.9 (15.3) <.001 16.3 D>I≒H
AX 53.3 (11.6) 48.7 (12.6) 46.9 (15.8) .008 5.0 D>I
Patterns survey
Gaming hours per play (A) 2.1 (1.4) 2.1 (1.4) 0.8 (1.0) .003 5.9 D≒I>H
Weekday daily gaming hours (A) 1.5 (1.4) 1.7 (1.9) 0.5 (0.9) .034 3.4 I>H
Weekend daily gaming hours (A) 3.0 (2.1) 2.7 (2.5) 1.0 (1.5) .007 5.0 D≒I>H
Internet café as the main gaming place 0.3 (0.5) 0.2 (0.4) 0.2 (0.4) .029 7.1 D>I Non-gaming Internet usage hours per
use (A)
1.2 (1.3) 1.0 (0.9) 0.7 (0.6) .158 1.9 –
Weekday daily non-gaming Internet hours (A)
1.0 (0.9) 0.8 (0.8) 1.0 (0.9) .268 1.3 –
Weekend daily non-gaming Internet hours (A)
1.3 (1.2) 0.9 (1.0) 1.4 (1.2) .032 3.5 D>I
Use Internet whenever possible 0.2 (0.4) 0.2 (0.4) 0.2 (0.4) .466 1.5 –
Use smartphone whenever possible 0.4 (0.5) 0.3 (0.5) 0.2 (0.4) .017 8.1 D>I Note.A: average; AQ: Aggression Questionnaire; AX: Anger Expression Scale; BDI: Beck Depression Inventory; BAI: Beck Anxiety Inventory; BIS: Behavioral Inhibition System; BAS: Behavioral Activation System (R: reward responsiveness; DG: drive to pursuit goals;
F: fun-seeking); CASS-S: Conners-Wells’ Adolescent Self-Report Scale–short version; D: dual-problematic group; H: healthy group;
I: Internet problem group.
users, (c) problematic smartphone users, and (d) “healthy” users. When compared with the healthy group, the dual- problem group demonstrated the most severe Internet- and smartphone-related problems. They also showed a poorer psychosocial profile in terms of anxiety, impulsivity, atten- tion difficulties, and aggression.
The subclasses with problematic use in a single domain (Internet or smartphone) were generally intermediate be- tween the dual-problem users and the healthy users in the psychosocial measures. However, despite their significantly lower IAT scores, the problematic Internet users showed a higher average number of hours spent gaming on weekdays than the dual-problem group.
When compared with the problematic smartphone group, the dual-problem group demonstrated significantly higher BAS-D and BAS-F scores, as well as anxiety, impulsivity, attention difficulty, and aggression. However, the sensitivity to punishment, such as BIS, BAS-R, and depression scores of the problematic smartphone group did not significantly differ from those of the dual-problem group.
Considering the gender differences in many psychoso- cial and digital media-related variables, LCA was sepa- rately performed for each gender. In contrast to the
four-class model that showed the best fit for the whole group, three-class models provided the best fit for the male and female students. The males were categorized as (a) dual-problem users, (b) problematic Internet users, and (c) healthy users. The females were categorized as (a) dual-problem users, (b) problematic smartphone users, and (c) healthy users. Although both genders were best described by three-class models, the males included a subclass comprising only problematic Internet users, where- as the females included a subclass with only problematic smartphone use. Thesefindings are consistent with a previ- ous study that demonstrated similar variation in problematic digital media usage by gender (Mok et al., 2014).
A secondary objective of this study was to identify the underlying factors contributing to the gender differences.
The females were more depressed, anxious, and sensitive to punishment and reward than the males. They also scored higher on the SAS and spent more time on smartphones than the males (Table 3). These findings are in line with the literature results. Mood and anxiety disorders, as well as problematic mobile phone use, have been reported to be higher among the females (Choi et al., 2015;Jiang & Zhao, 2016; Kessler et al., 2012; Steel et al., 2014; Takao, Takahashi, & Kitamura, 2009).
Table 6. Interclass comparison of the females (n=260)
Variables
Dual (n=35) (13.5%)
Smartphone (n=128)
(49.2%)
Healthy (n=97)
(37.3%) pvalue F Post hoc
Psychosocial measures
Internet Addiction Test 42.9 (13.2) 24.6 (3.4) 21.4 (1.3) <.001 156.6 D>S≒H Smartphone Addiction Scale 104.2 (29.2) 83.0 (24.3) 47.0 (4.3) <.001 70.3 D>S>H
BIS Scale 19.2 (3.9) 17.9 (3.7) 17.2 (4.4) .014 4.3 D>S≒H
Total BAS Scale 31.6 (7.5) 28.4 (8.5) 26.9 (8.3) .003 5.9 D>S≒H
BAS-R 12.9 (3.5) 11.9 (3.8) 11.2 (3.9) .038 3.3 –
BAS-DG 9.3 (2.7) 8.3 (2.8) 8.5 (3.1) .032 3.5 D>S
BAS-F 9.2 (2.7) 8.1 (2.9) 7.3 (2.8) .001 7.6 D>S≒H
BDI 11.6 (9.1) 9.1 (8.2) 5.4 (7.8) .001 6.8 D>H
BAI 10.9 (11.6) 5.7 (7.4) 3.1 (5.1) <.001 13.5 D>S≒H
Barratt Impulsiveness 66.8 (7.2) 63.3 (8.2) 55.1 (9.7) <.001 26.9 D>S>H
CASS-S 22.0 (11.9) 15.8 (11.4) 10.8 (8.5) <.001 14.9 D>S≒H
AQ 74.0 (18.5) 61.9 (18.5) 48.9 (10.3) <.001 27.1 D>S>H
AX 57.8 (9.7) 53.5 (10.1) 51.0 (9.7) <.001 8.1 D>S≒H
Patterns survey
Gaming hours per play (A) 1.0 (1.9) 0.5 (1.0) 0.3 (0.7) .008 4.9 D>S≒H
Weekday daily gaming hours (A) 0.8 (1.4) 0.3 (0.7) 0.3 (0.8) .001 7.1 D>S≒H
Weekend daily gaming hours (A) 1.3 (2.4) 0.6 (1.2) 0.4 (1.0) .006 5.2 D>S≒H
Internet café as the main gaming place 0.0 (0.2) 0.0 (0.2) 0.1 (0.2) .594 1.0 –
Non-gaming Internet usage hours per use (A)
2.0 (1.3) 1.4 (1.0) 1.1 (0.9) <.001 11.0 D>S≒H Weekday daily non-gaming Internet
hours (A)
1.7 (1.4) 1.1 (1.1) 1.1 (1.9) .001 6.7 D>S
Weekend daily non-gaming Internet hours (A)
2.4 (1.9) 1.6 (1.5) 1.2 (1.1) <.001 10.9 D>S≒H
Use Internet whenever possible 0.2 (0.4) 0.1 (0.3) 0.0 (0.2) .052 5.9 –
Use smartphone whenever possible 0.5 (0.5) 0.6 (0.5) 0.1 (0.3) <.001 20.0 S≒D>H Note.A: average; AQ: Aggression Questionnaire; AX: Anger Expression Scale; BDI: Beck Depression Inventory; BAI: Beck Anxiety Inventory; BIS: Behavioral Inhibition System; BAS: Behavioral Activation System (R: reward responsiveness; DG: drive to pursuit goals;
F: fun-seeking); CASS-S: Conners-Wells’ Adolescent Self-Report Scale–short version; D: dual-problematic group; H: healthy group;
S: smartphone problem group.
In the female LCA model, the dual-problem group showed more severe psychopathology and digital media-related pro- blems. Furthermore, the problematic smartphone group had significantly higher levels of impulsivity, aggression, and smartphone addiction, and used smartphones more frequently than the healthy users. Although it was previously reported that females are more likely to utilize mobile phones for socializing purposes (Bianchi & Phillips, 2005), impulsivity and aggression, rather than sociability, may drive females to use their smartphones to a problematic degree. This is in line with a previous report, in which low self-control predicted problematic mobile phone use (Jiang & Zhao, 2016).
However, the males in this study scored higher on the IAT and played games for longer periods. Although the males demonstrated a lower level of psychopathology, in general, they did not show significant differences from the females in terms of attention difficulty, impulsivity, or aggression (Table 3).
Closer inspection of the three male LCA clusters revealed that the dual-problem group had a higher degree of psycho- pathology, and more severe digital media-related problems, including Internet addiction, than the problematic Internet group. However, the two groups did not significantly differ in terms of the average number of hours of gaming per session, or the average number of hours spent gaming at the weekend.
Thus, gaming appeared as the most important factor contrib- uting to the relative preponderance of problematic Internet usage in the males. This view is in line with the literature, in which gaming has been reported as a major risk factor for Internet addiction (Kormas, Critselis, Janikian, Kafetzis, &
Tsitsika, 2011;Wu, Lee, Liao, & Chang, 2015).
This study indicated that individuals with both problem- atic Internet and smartphone usage may experience higher difficulties from excessive use of new digital media plat- forms and more psychosocial distress. Considering that depression and anxiety have been related to problematic Internet use, gaming, and smartphone use (Elhai, Dvorak, Levine, & Hall, 2017;Wei et al., 2012;Yen, Ko, Yen, Wu,
& Yang, 2007), a higher level of depression and anxiety among our subjects was not a surprise. However, such a dose-dependent relationship between more severe psycho- social problems and a greater number of digital media- related problems warrants additional clinical attention to people experiencing a greater number of digital-media use problems. In addition, further research should reveal wheth- er more severe psychosocial problems lead to greater numbers of problematic digital media use, or the synergistic effect of ‘dual-addictions’ exert greater negative conse- quences on mental health.
This study demonstrated gender differences in the prob- lematic use of digital media. Although these gender differences were partially explained by differences in digital media use patterns and psychosocial burden by gender, further studies should investigate whether such differences stem from bio- logical or sociocultural differences, such as expected gender roles or neurodevelopment.
One of this study’s interestingfindings is the dispropor- tionately overpresented dual-problem group in the males (71.5%) compared with the female students (13.5%). With increasing age, brain activity responsible for response inhi- bition was also reported to increase but with different pattern
by gender (Rubia et al., 2013). Females displayed signifi- cantly higher activation in left superior and inferior frontal and striatal regions compared with males (Rubia et al., 2013).
Thisfinding hints that the females could have higher cogni- tive control than the males in the same age. Since higher impulsivity was observed for the dual problem group, the gender difference in brain maturation provides a plausible explanation for the relatively lower proportion of dual problems in the females than males (Ko, Yen, Chen, Chen,
& Yen, 2005;Mihara & Higuchi, 2017).
The study results highlight that gaming is an important factor in males with Internet usage problems. It is also noteworthy that aggression and impulsivity were associated with problematic smartphone use among the females.
Although aggression and impulsivity have been found to be associated with Internet addiction (Cao, Su, Liu, & Gao, 2007;Ko, Yen, Liu, Huang, & Yen, 2009; Koo & Kwon, 2014; Yen et al., 2007), our findings contradict a report stating that females use mobile phones to socialize (Bianchi
& Phillips, 2005). Considering the higher level of fear among females (Tulviste, Kiive, Akkermann, & Harro, 2015), smartphone use may allow them to express their anger or hostility in a way that they regard as being socially more acceptable. If this hypothesis is valid, a longitudinal study should examine whether such use would ultimately represent an adaptive or maladaptive coping strategy. How- ever, reverse causality is also possible, with aggression being the result of excessive media usage. Nevertheless, aggression is an important factor to address in clinical assessments, because it may affect the persistence of prob- lematic use (Ko, Yen, Yen, Lin, & Yang, 2007).
This study had some limitations. First, the cross-sectional design allowed us to investigate only the current pattern of use and psychosocial variables of users, and their precise causal relationships could not be confirmed. For example, a problematic Internet user with high impulsivity could have become a pathological user due to his/her impulsivity, or vice versa. However, we cannot make inference on causality in this study; therefore, a longitudinal study is required. There were also limitations in terms of the lack of detailed infor- mation on the external environment of the subjects, such as parent–child and peer relationships. Furthermore, the psycho- social measurements relied on self-report measures with no objective assessments. However, because extensive psycho- social and digital media-related questionnaires were admin- istered to the students, collecting too many details beyond the capacity that an adolescent could tolerate may actually undermine the overall study accuracy. Even though statisti- cally higher scores in psychosocial measurements were dis- played by the dual-problematic users, caution is required to interpret clinical significance. For instance, the mean values of BDI and BAI of this group were both 8.9 in the whole sample. Since the scores of 0–9 are regarded as normal, those average scores are situated in subclinical level (Beck, Steer, &
Carbin, 1988;Julian, 2011). Sill, such subclinical distress by the dual excessive media usage may act as a background predisposing vulnerability and grant a clinical significance when the individual encounters other stressors in life. Con- sidering that the study participants were not clinical sample, further studies in clinical populations are also required to ascertain the full clinical value of these findings.
In conclusion, this study revealed different patterns of problematic use of new digital media platforms among adolescents by gender. Four user subgroups were identified among the whole population. Although having dual-problem and healthy groups in common, distinct classes of problem- atic use, i.e., problematic Internet users versus problematic smartphone users, were identified in the males and the females, respectively, in the gender-stratified LCA. Gaming was associated with problematic Internet usage in males. On the contrary, higher levels of impulsivity and aggression were observed in the female problematic smartphone users;
this group may use their smartphones as a means of releasing their impulsivity or frustration. Future research is required to confirm this hypothesis and to test whether such actions are useful for alleviating psychosocial burden or worsens it.
Regardless of gender, in general, the dual-problem group demonstrated the most severe psychosocial and digital media-related problems. Thus, evaluating whether there are multiple types of addictive behavior in the context of digital media use could help us acquire a clearer clinical picture, similar to evaluating additional substance misuse behaviors among patients with a substance-use disorder.
Funding sources:This study was supported by a grant of the Korean Mental Health Technology R&D Project, Ministry of Health and Welfare, Republic of Korea (HM14C2603), and the National Research Foundation of Korea (2014M3C7A1062894).
Authors’ contribution:S-YL led the drafting of the manu- script and DL, CRN, SP, and J-GK also took part in drafting.
DL, DYK, and YL conducted the analyses. Y-SK and J-SC developed the concept and supervised. DJK reviewed the scientific and further developed the concept. All authors contributed to the editorial comments.
Conflict of interest:None.
REFERENCES
Achab, S., Nicolier, M., Mauny, F., Monnin, J., Trojak, B., Vandel, P., Sechter, D., Gorwood, P., & Haffen, E. (2011).
Massively multiplayer online role-playing games: Comparing characteristics of addict vs non-addict online recruited gamers in a French adult population. BMC Psychiatry, 11(1), 144.
doi:10.1186/1471-244X-11-144
Ayers, J. W., Leas, E. C., Dredze, M., Allem, J., Grabowski, J. G., & Hill, L. (2016). Pokémon go – A new distraction for drivers and pedestrians.JAMA Internal Medicine, 176(12), 1865–1866. doi:10.1001/jamainternmed.2016.6274
Bahn, G. H., Shin, M. S., Cho, S. C., & Hong, K. E. (2001). A preliminary study for the development of the assessment scale for ADHD in adolescents: Reliability and validity for CASS(S).Korean Journal of Child & Adolescent Psychiatry, 12(2), 218–224.
Beck, A. T., Epstein, N., Brown, G., & Steer, R. A. (1988). An inventory for measuring clinical anxiety: Psychometric
properties. Journal of Consulting and Clinical Psychology, 56(6), 893–897. doi:10.1037//0022-006X.56.6.893
Beck, A. T., Steer, R. A., & Carbin, M. G. (1988). Psychometric properties of the Beck Depression Inventory: Twenty-five years of evaluation. Clinical Psychology Review, 8(1), 77–100.
doi:10.1016/0272-7358(88)90050-5
Beck, A. T., Ward, C. H., Mendelson, M., Mock, J., & Erbaugh, J.
(1961). An inventory for measuring depression. Archives of General Psychiatry, 4,561–571. doi:10.1001/archpsyc.1961.
01710120031004
Bianchi, A., & Phillips, J. G. (2005). Psychological predictors of problem mobile phone use. CyberPsychology & Behavior, 8(1), 39–51. doi:10.1089/cpb.2005.8.39
Borsari, B., Zamboanga, B. L., Correia, C., Olthuis, J. V., Van Tyne, K., Zadworny, Z., Grossbard, J. R., & Horton, N. J.
(2013). Characterizing high school students who play drinking games using latent class analysis. Addictive Behaviors, 38(10), 2532–2540. doi:10.1016/j.addbeh.
2013.04.009
Buss, A. H., & Perry, M. (1992). The Aggression Questionnaire.
Journal of Personality and Social Psychology, 63(3), 452–459.
doi:10.1037/0022-3514.63.3.452
Cao, F., Su, L., Liu, T., & Gao, X. (2007). The relationship between impulsivity and Internet addiction in a sample of Chinese adolescents. European Psychiatry, 22(7), 466–471.
doi:10.1016/j.eurpsy.2007.05.004
Carras, M. C., Van Rooij, A. J., Van de Mheen, D., Musci, R., Xue, Q. L., & Mendelson, T. (2017). Video gaming in a hyperconnected world: A cross-sectional study of heavy gaming, problematic gaming symptoms, and online socializing in adolescents.Computers in Human Behavior, 68,472–479.
doi:10.1016/j.chb.2016.11.060
Carver, C. S., & White, T. L. (1994). Behavioral inhibition, behavioral activation, and affective responses to impending reward and punishment: The BIS/BAS Scales. Journal of Personality and Social Psychology, 67(2), 319–333.
doi:10.1037/0022-3514.67.2.319
Choi, S. W., Kim, D. J., Choi, J. S., Ahn, H., Choi, E. J., Song, W. Y., Kim, S., & Youn, H. (2015). Comparison of risk and protective factors associated with smartphone addiction and Internet addiction. Journal of Behavioral Addictions, 4(4), 308–314. doi:10.1556/2006.4.2015.043
Conners, C. (1997). Conners’ Rating Scales–Revised technical manual. Toronto, ON: Multi-Health Systems.
Dantlgraber, M., Wetzel, E., Schutzenberger, P., Stieger, S., &
Reips, U. D. (2016). Simple construct evaluation with latent class analysis: An investigation of Facebook addiction and the development of a short form of the Facebook Addiction Test (F-AT). Behavior Research Methods, 48(3), 869–879.
doi:10.3758/s13428-016-0716-2
Elhai, J. D., Dvorak, R. D., Levine, J. C., & Hall, B. J. (2017).
Problematic smartphone use: A conceptual overview and systematic review of relations with anxiety and depression psychopathology. Journal of Affective Disorders, 207,251–259. doi:10.1016/j.jad.2016.08.030
Eurostat. (2017). Digital economy and society statistics – Households and individuals. Retrieved fromhttp://ec.europa.
eu/eurostat/statistics-explained/index.php/Digital_economy_
and_society_statistics_-_households_and_individuals Frangos, K., Frangos, C., & Sotiropoulos, I. (2012). A
meta-analysis of the reliabilty of Young’s Internet Addiction Test