Contents lists available atScienceDirect
Children and Youth Services Review
journal homepage:www.elsevier.com/locate/childyouth
The digital divide: Risk and protective factors and the di ff erences in problematic use of digital devices among Hungarian youth
Hedvig Kiss
a, Kevin M. Fitzpatrick
b, Bettina F. Piko
c,⁎aDoctoral School of Education, University of Szeged, Hungary
bDepartment of Sociology & Criminology, University of Arkansas, Fayetteville, AR, USA
cDepartment of Behavioral Sciences, University of Szeged, Szeged, Hungary
A R T I C L E I N F O
Keywords:
Digital device use Risk and protective factors Cluster analysis
A B S T R A C T
A number of psychological factors have been found to be relevant in terms of problematic use of digital devices.
Some of them may serve as risk factors, while others mean protection. The main goal of present study was to determine user profiles and to examine differences among them based on several psychological variables using cluster analysis. Data were collected from high school and university students via an online questionnaire from November 2017 to January 2018 (N = 249; females: 62.2%, Mean age = 22.5 years, SD = 3.5). Based on bivariate correlations, sensation seeking,flow and boredom proneness acted as risk factors for developing problematic technological use. However, self-esteem, self-regulation and resilience were significant protective factors against problematic technological use. In an effort to develop a set of profiles that would capture this student population and their usage relative to risk, we identified four distinct user profiles through the use of cluster analysis. Thefirst cluster was labeled as strongly protected sensation-seekers who were more prone to problematic use (18.5%) with moderately high levels of protection, but with the highest scores on the boredom proneness and sensation seeking scales. The second cluster consisted of more balanced and non-vulnerable users (26.1%), who achieved average scores on both risk and protective factors scales. The third cluster was labeled protected, conscious users who were slightly prone to problematic use (39.8%) with lower levels of problematic use and risk factors, and with higher levels of protective factors. The fourth cluster was labeled as strongly problematic, unprotected users (15.7%), who achieved the highest scores of problematic use, and were the less protected having the lowest levels of protective factors scores. We conclude that cluster analysis was suitable for detecting differences in vulnerability to problematic Internet and smartphone use. Psychological factors, such as sensation seeking,flow and boredom, self-esteem, self-regulation and resilience serve as useful tools for pro- viding information to better understanding the role of risk and protective factors in the prevention of youth’s problematic use of digital devices.
1. Introduction
Tools of modern technology, especially the Internet and smart- phones, have become indispensable in modern life. Beyond the original purpose of mobile phones, they offer a number of important applica- tions that go well beyond the simple telephone call (Aboujaoude, 2010). However, in addition to these benefits, we must recognize the unfavorable side effects and consequences that these devices have had on interpersonal relationships, daily activities, routine of work, and our overall physical and mental health (Choi et al., 2015; Jenaro, Flores, Gómez-Vela, González-Gil, & Caballo, 2007; Kormas, Critselis, Janikian, Kafetzis, & Tsitsika, 2011; Thomée, 2018). The most vulnerable age groups for developing problematic Internet and smartphone use
typically are adolescents and young adults, especially those born be- tween 1995 and 2012, often referred to as‘generation Z’(Geck, 2006;
Lemola, Perkinson-Gloor, Brand, Dewald-Kaufmann, & Grob, 2015).
More recently, younger children also appear to suffer from the same problems that their older counterparts have been reporting (Yadav &
Chakraborty, 2017). Despite an ever increasing number of studies fo- cusing on problematic digital device use, there continues to be a lack of specific ones highlighting the most and least vulnerable groups of young people.
1.1. Problematic Internet and smartphone use
Studies apply the terms ‘addiction’ and ‘problematic use’
https://doi.org/10.1016/j.childyouth.2019.104612
Received 22 July 2019; Received in revised form 10 November 2019; Accepted 12 November 2019
⁎Corresponding author at: Department of Behavioral Sciences, University of Szeged, 5 Szentháromság str. 5, Szeged 6722, Hungary.
E-mail address:fuzne.piko.bettina@med.u-szeged.hu(B.F. Piko).
Available online 23 November 2019
0190-7409/ © 2019 Elsevier Ltd. All rights reserved.
T
alternatively; we use‘problematic Internet use’(PIU) and‘problematic smartphone use’ (PSU) as suggested by Shapira, Goldsmith, Keck, Khosla, and McElroy (2000); Demetrovics, Szeredi, and Nyikos (2004);
Wolniewicz, Tiamiyu, Weeks, and Elhai (2018). Problematic use can be defined as a maladaptive preoccupation with the Internet or smart- phone, which causes distress or a wide range of impairments without a psychiatric disorder (Chang & Hung, 2012; Shapira et al., 2000). In this study, the term ‘problematic use’ is introduced because it draws at- tention to the negative consequences of overuse without pathologizing the phenomenon.
These types of problematic use have six core symptoms: salience, mood modification, tolerance, withdrawal, conflict and relapse (Griffiths, 2005; Kim & Hodgins, 2018). Although there is a close as- sociation between Internet and smartphone use and addictions (Mok et al., 2014), there are a number of differences as well in both the types of applications and their influencing factors (Choi et al., 2015; Lin, Chang, Lee, Tseng, & Kuo, 2014).
Due to differences in measurements, there is a lack of reliable data on global prevalence of these behavioral addictions and estimates vary considerably across both researchers and countries. Worldwide, the prevalence of PIU and PSU among youth has been observed to range between 1 and 38 percent (Chang & Hung, 2012; Chen et al., 2017). As expected, the biggest challenge is prevention, particularly since some people can avoid the dangers of a digital environment, while others are prone to exaggerated and problematic use. As such, we argue that the key to prevention is to detect which factors may contribute to an ele- vated risk and while at the same time, identifying factors that would provide some protection against the harm in usage.
1.2. Risk and protective factors of problematic use
In order to understand problematic use and the tools needed to develop effective prevention and treatment, a comprehensive knowl- edge of possible risk and protective factors and their relationship to usage is essential. The risk and protective factors framework provides a mechanism for investigating the variations in problematic behaviors among youth and vulnerable groups (Jessor, 1991). Using this ex- planatory schema, special emphasis can be placed on protection in practice; even when risk factors are found to be resistant to change, protective factors can be introduced to help neutralize or minimize the negative effects of risk. Besides earlier studies on substance use and mental health problems (e.g.,Cairns, Yap, Pilkington, & Jorm, 2014;
Stone, Becker, Huber, & Catalano, 2012); currently, there are a number of research studies that describe the identification of risk and protective factors for problematic Internet and smartphone use (e.g.,Choi et al., 2015; Koo & Kwon, 2014). AsJessor (1991)suggested, this conceptual framework can facilitate action in the arena of youth risk when research involves recent developments in behavioral epidemiology and social- developmental psychology related to the specific behavioral problem.
Therefore, we have applied in our research those psychological risk and protective factors previously justified as relevant variables in terms of problematic Internet and smartphone use among this age group.
Besides genetic predisposition to addictions, there are several psy- chological factors that may be relevant in terms of problematic use of digital devices. In terms of risk factors, boredom has been found to be a significant trigger for intensive Internet use, which may lead to pro- blematic Internet using behavior (Wang, 2018). When the level of ac- tivities do not reach the optimal arousal, the likelihood of boredom proneness is elevated and this is particularly true for those who ori- ginally report higher arousal levels (Chou, Chang, & Yen, 2018). Not surprisingly, boredom is closely related to sensation seeking as another risk factor, which is an important correlate of problematic use of digital devices for youth (Kara, 2019). Both boredom and sensation seeking have been found to be important correlates of mobile phone addiction in a study of teenagers and young adults ranging in age from 14 to 28 (Leung, 2008). Sensation seeking was found to be one of the early key
factors of Internet addiction–similar to other addictions–primarily due to its direct link to the system of immediate reward (Lavin, Marvin, McLarney, Nola, & Scott, 1999). This may lead to youth’s tendency toward novelty and sensation seeking, and in turn, producing elevated risk taking.
Besides boredom and sensation,flow experiences may also be linked to Internet and smartphone activities. Although experiencingflow has many psychological benefits, Internet flow experiences elevate the likelihood of prolonged website use which may contribute to proble- matic use (Rettie, 2001). In a study series focused on a number of psychological factors, researchers found thatflow directly contributed to problematic Internet use. In addition, both flow and sensation seeking were indirectly related to problematic use through important activities on preferred websites (Kim & Davis, 2009).
Beyond these psychological risk factors, due to neurodevelopmental changes (namely, a discrepancy between the development of neocortex and the limbic system), young people sometimes tend to be low in self- regulation; not surprisingly, self-control and emotional regulation may also be associated with increased Internet use. Using a sample of Chinese adolescents, researchers found that lower levels of self-esteem and self-regulation were related to problematic Internet use (Mei, Yau, Chai, Guo, & Potenza, 2016). In another study, self-regulation was found to be a significant negative correlate of problematic mobile phone use (Coyne, Stockdale, & Summers, 2019). Thus, these psycho- logical variables may serve as protection, similar to resilience which was also found to be negatively related to smartphone addiction (Kim et al., 2014). In another study, resilience dampened the positive re- lationship between stress and problematic social networking site usage, the most addictive Internet tool (Hou et al., 2017).
These psychological factors not only have special relevance for youth, but also are closely interrelated due to the neurodevelopmental processes during adolescence and young adulthood; therefore, it seems likely that we could cluster them into groups based on a set of inter- relationships. For practical purposes, we propose the use of cluster analysis which can provide useful categories of groups in terms of vulnerability based on risk and protective factors.
1.3. Youth clusters by problematic use
Research on different user profiles and their characteristics related to problematic Internet and smartphone use is difficult to find. At present, we were only able tofind a few studies reporting information about clustering users. Using the short version of Young's Internet Addiction Test (Pawlikowski, Altstötter-Gleich, & Brand, 2013),Gamito et al. (2016) identified two groups among Portuguese youth (N = 2617) based on their usage pattern: A minority of‘high-frequency users’with higher scores on Young’s scale, and a majority of‘low-fre- quency users’with lower scores on Young’s scale. The two clusters differed in specific activities which suggested that previous findings regarding problematic use was associated with specific online activities rather than with the Internet as the digital environment.
In a recent Turkish study (Kayri & Günüç, 2016) researchers dis- cussed the possible impact of different socioeconomic levels on pro- blematic use. Youth (N = 453) were divided into two groups according to their reported socioeconomic level. Both samples were divided into three clusters based on their similarities of addiction levels: not ad- dicted, at risk, and addicted. Prevalence of problematic use was highest among students with high socioeconomic level (26.7%), while this number was much lower (9.1%) in the group of youth with lower so- cioeconomic status.
In a longitudinal study conducted by Taushanov and Berchtold (2018), Swiss youth (N = 185) were clustered along their level of emotional well-being, body mass index, gender, and education track.
The Markovian-based hidden mixture transition distribution (HMTD) model yielded four groups:‘group 1′with average volatility and PIU level,‘group 2′with relatively low scores and variability,‘group 3′with
very low variability and a constantly diminishing PIU score, and‘group 4′ with more complex trajectories and variability. They were no in correlation with age.
Using hierarchical and K-means cluster analysis techniquesVaghefi and Lapointe (2016) investigated users’ liability to IT (Information Technology) addiction and developed a typology of smartphone users.
They analyzed the data of 182 students from North America. Their work found five distinct types of users defined according to individual characteristics and those user profiles included: addict, fanatic, highly engaged, regular, and thoughtful.
1.4. Study goals
To the best of our knowledge no previous studies have applied cluster analysis using risk and protective variables which are especially relevant for youth. The literature above suggests that several factors may contribute to problematic use; however, not all of them have been tested yet in a risk and protection model. Knowing the most common user profiles and their features can help with early prevention, inter- vention, and later treatment as well. Therefore, a central research aim of the present study was to address the following question: How can we describe the different cluster profiles of technological users along the lines of psychological variables such as boredom proneness, sensation seeking,flow, self-esteem, self-regulation, and resilience? In addition, a second research aim of our study was designed to address the following question: How can we detect whether there are differences in the cluster profiles across different demographic factors?
2. Material and methods 2.1. Participants and procedure
The study was based on a convenience sample using an online self- reported questionnaire. Participants were recruited via an online questionnaire package hosted ontypeform.combetween the months of November 2017 to January 2018. We used the free online version of this survey creator website to collect our data. The public link was shared on websites and on special Internet communication platforms that are popular among those who represent our targeted population (e.g., Facebook, Instagram, and others). Respondents were informed about the details of the study and their consent was obtained.
Participation was voluntary and confidential. The study protocol was approved by the Institutional Review Board of the Doctoral School of Education, University of Szeged, in accordance with the Helsinki Declaration. Our sample consisted of 249 Hungarian youth (age ranging from 14 to 28; mean age: 22.5 years). WHO defines 'Adolescents' as individuals in the 10–19 years age group and 'Youth' as the 15–24 year age group, while 'Young People' covers the age range 10–24 years.
However, several UN entities, instruments and regional organizations have somewhat different definitions of youth, up to 32 or 35 years1. Therefore, we decided to use this term for this sample of wide age range. Of the sampled youth, 94 were males (37.8%) and 155 were females (62.2%). Estimated time to complete the questionnaire was approximately 20–25 min. Since we required that all questions needed to be answered in completion and the completed survey could not be submitted without everything completed, there were no missing data in the study.
2.2. Measures
The self-administered online questionnaire package included de- mographic data, questions about online usage and length of time, and
eight scales assessing problematic Internet use (PIU), problematic smartphone use (PSU), sensation seeking, self-esteem, self-regulation, flow, resilience and boredom proneness. Social and demographic data were collected including: respondent’s age (in years), gender (males = 1), schooling (high school; college/university), self-assessed SES (lower class; lower-middle class; middle class; upper-middle class;
upper class) and family structure (two-parent family; one-parent fa- mily).
2.2.1. Smartphone addiction Inventory (SPAI)
We measured the level of problematic smartphone use by the Hungarian version (Csibi, Demetrovics, & Szabó, 2017) of Smartphone Addiction Inventory (SPAI,Lin et al., 2014). It contains 26 items (e.g.,
“I try to spend less time on smartphone, but the efforts were in vain.”) with response options on a six-point Likert-scale ranging from 1 (strongly disagree) to 6 (strongly agree). The scale was reliable with a Cronbach’s alpha coefficient = 0.91.
2.2.2. Problematic Internet use questionnaire (PIU-Q)
Problematic Internet use was assessed using the Hungarian version of the 18-item Problematic Internet Use Questionnaire (PIU-Q) devel- oped byDemetrovics et al. (2004), Demetrovics, Szeredi, and Rózsa (2008). In this case, participants had to rate all items on afive-point Likert-scale ranging from 1 (never) to 5 (always), for example:“How often do you spend time online when you’d rather sleep?”The scale was reliable with a Cronbach’s alpha coefficient = 0.88.
2.2.3. Brief sensation seeking scale (BSSS-8)
Sensation seeking was measured by using the Hungarian version (Mayer, Lukács, & Pauer, 2012) of the 8-item Brief Sensation Seeking Scale (BSSS-8, Hoyle, Stephenson, Palmgreen, Lorch, & Donohew, 2002). Respondents could answer on a five-point Likert-type scale ranging from 1 (strongly disagree) to 5 (strongly agree). It contains statements like“I would love to have new and exciting experiences, even if they are illegal.” The scale was reliable with a Cronbach’s alpha = 0.78.
2.2.4. Rosenberg Self-esteem scale
Rosenberg’s Self-esteem Scale is a 10-item scale that measures global self-worth by measuring both positive and negative feelings about the self (Rosenberg, 1965). We applied the Hungarian version in our study (Sallay, Martos, Földvári, Szabó, & Ittzés, 2014). All items had to be answered on a four-point Likert scale ranging from 1 (strongly disagree) to 4 (strongly agree) (e.g.,“I am able to do things as well as most other people.”) The scale was reliable with a Cronbach’s alpha = 0.90.
2.2.5. Self-regulation scale
We explored respondents’ self-regulation level by applying the Hungarian version of the 7-item Self-Regulation Scale (Luszczynska, Diehl, Gutiérrez-Dona, Kuusinen, & Schwarzer, 2004). Items like“If an activity requires a problem-oriented attitude, I can control my feelings” had to be rated on a four-point Likert scale ranging from 1 (strongly disagree) to 4 (strongly agree). The scale was reliable with a Cronbach’s alpha = 0.84.
2.2.6. Flow State questionnaire
Flow was measured by the Hungarian validated version of the 20- item Flow State Questionnaire (Magyaródi, Nagy, Soltész, Mózes, &
Oláh, 2013a, 2013b). Participants were asked to think about an online activity they like and rate all items on afive-point Likert-scale ranging from 1 (absolutely false) to 5 (absolutely true), for example:“Time passed faster than I thought it did.” The scale was reliable with a Cronbach’s alpha = 0.89.
1https://www.un.org/esa/socdev/documents/youth/fact-sheets/youth- definition.pdf.
2.2.7. 10-item Connor-Davidson resilience scale (CD-RISC)
The shortened Hungarian version (Járai et al., 2015) of the original 25-item Connor-Davidson Resilience Scale (CD-RISC) (Connor &
Davidson, 2003) contains 10 items (Campbell-Sills & Stein, 2007) such as“Coping with stress can strengthen me.”Each item was rated on a five-point Likert scale from 0 (not true at all) to 4 (true nearly all the time). The scale was reliable with a Cronbach’s alpha = 0.84.
2.2.8. Boredom proneness scale (BPS)
Boredom proneness was measured by the Hungarian version of Boredom Proneness Scale (Farmer & Sundberg, 1986) which consists of 28 items like“Time always seems to be passing slowly.”All items had to be answered on a seven-point Likert-scale ranging from 1 (strongly disagree) to 4 (strongly agree). The scale was reliable with a Cronbach’s alpha = 0.71.
2.3. Analytical strategy
After data collection, IBM SPSS version 24 for Windows software was used for analyzing the data. Besides descriptive statistics (such as means, standard deviations, z-scores) and bivariate correlations, a K- means (nonhierarchical) cluster analysis was performed in order help in identifying user profiles based on the level of problematic technological use and the selected psychological variables. First, we performed this analysis on a random selection of half the sample and then on the other half of the sample, and the number of clusters was confirmed using a series of ANOVA tests. This type of cluster method has a distance-based clustering algorithm, in which the distance is used as a measure of si- milarity. The significant level of acceptance was 0.05.
2.4. Ethics in publishing
Every participant was informed about the study’s background and that participation was voluntary. As noted earlier, our work was ap- proved and is in accordance with the Declaration of Helsinki and the local ethical commission which approved the study.
3. Results
3.1. Characteristics of the selected scales: descriptive statistics and bivariate relationships
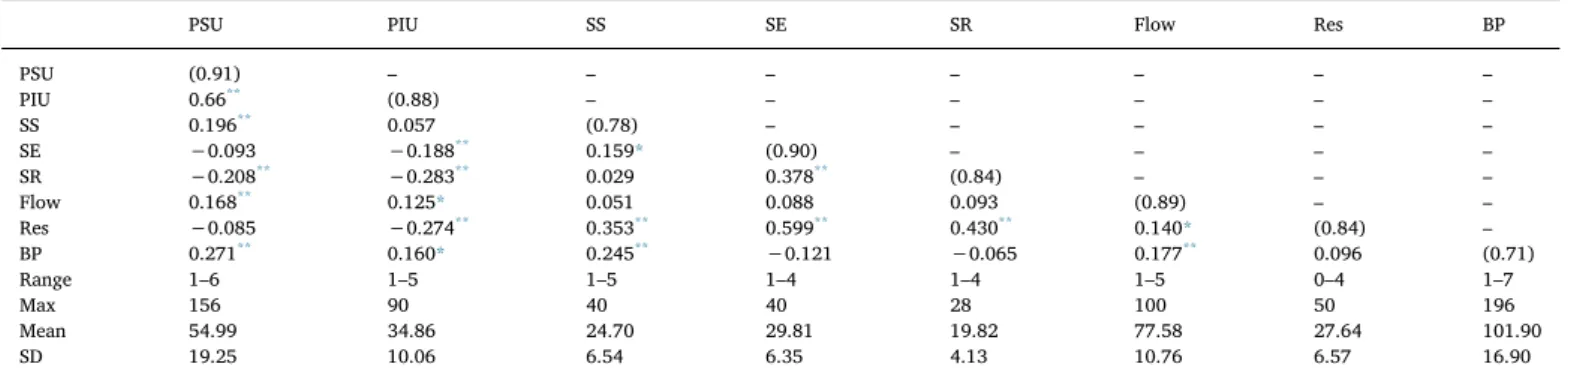
Table 1 displays alpha reliabilities (along with the diagonal), bi- variate correlations, ranges, maximum possible scores, means and standard deviations of problematic use and all psychological scales.
Cronbach’s alpha coefficients varied from 0.71 to 0.91, therefore we
can conclude that our instruments were all found to be in an acceptable range of reliability.
Directions of the bivariate correlations were consistent with pre- vious studies (Elhai et al., 2017; Geng, Han, Gao, Jou, & Huang, 2018;
Robertson, Yan, & Rapoza, 2018; Wang et al., 2018). As we expected, sensation seeking (rPSU = 0.196, p < .01), flow (rPSU = 0.168, p < .01) and boredom proneness (rPSU= 0.271, p < .01) had sig- nificant and positive correlations with problematic Internet and smartphone use. Thus, these psychological variables may act as risk factors in developing problematic smartphone and Internet use. Based on their significant and negative relations, self-esteem (rPIU= -0.188, p < .01), self-regulation (rPIU=−0.283, p < .01) and resilience (rPIU=−0.274, p < .01) could be considered protective factors.
Participants in the present study reported moderate levels of pro- blematic smartphone (M = 54.99; SD = 19.25) and Internet usage (M = 34.86; SD = 10.06), sensation seeking (M = 24.70; SD = 6.54), resilience (M = 27.64; SD = 6.57) and boredom proneness (M = 101.90; SD = 16.90). Additionally, participants reported rela- tively high levels of self-esteem (M = 29.81; SD = 6.35), self-regula- tion (M = 19.82; SD = 4.13) andflow (M = 77.58; SD = 10.76).
3.2. K-means clustering
In order to determine user profiles according to the level of pro- blematic use and the selected psychological variables, we conducted a K-means cluster analysis. First, hierarchical cluster analysis was used to check for outliers and to help determine what would be the optimal number of clusters (based on the agglomeration schedule and dendo- gram). Then we conducted K-means cluster analysis for categorization of the students since our sample size was suitable to this method (Kassambara, 2017).Table 2includes means, standard deviations, z- scores and F-values of the four clusters, whileFig. 1represents cluster profiles based on z-scores. F-values suggest that all clusters are well- separated along all variables, especially along risk factors such as sen- sation seeking,flow and boredom proneness.
Thefirst group (CLUSTER 1) was labeled asstrongly protected, pro- blematic sensation seekers(18.48%, n = 46) who were prone to pro- blematic use. Their protection is based on the moderately high level of self-esteem, resilience and self-regulation. We found the highest scores of boredom proneness and sensation seeking in this group compared to any of the other groups. These characteristics partly determine the re- spondents’proneness to problematic use.
CLUSTER 2 was the group ofnot vulnerable, balanced users(26.10%, n = 65). Participants in this group achieved average scores on scales of both risk (like sensation seeking and boredom proneness) and protec- tive factors (like self-regulation and resilience).
Table 1
Correlations, alpha coefficients and descriptive statistics for study variables (N = 249).
PSU PIU SS SE SR Flow Res BP
PSU (0.91) – – – – – – –
PIU 0.66** (0.88) – – – – – –
SS 0.196** 0.057 (0.78) – – – – –
SE −0.093 −0.188** 0.159* (0.90) – – – –
SR −0.208** −0.283** 0.029 0.378** (0.84) – – –
Flow 0.168** 0.125* 0.051 0.088 0.093 (0.89) – –
Res −0.085 −0.274** 0.353** 0.599** 0.430** 0.140* (0.84) –
BP 0.271** 0.160* 0.245** −0.121 −0.065 0.177** 0.096 (0.71)
Range 1–6 1–5 1–5 1–4 1–4 1–5 0–4 1–7
Max 156 90 40 40 28 100 50 196
Mean 54.99 34.86 24.70 29.81 19.82 77.58 27.64 101.90
SD 19.25 10.06 6.54 6.35 4.13 10.76 6.57 16.90
Note. PSU = problematic smartphone use; PIU = problematic Internet use; SS = sensation seeking; SE = self-esteem; SR = self-regulation; Res = resilience;
BP = boredom proneness; Alpha values on the diagonal and correlation coefficients below diagonal.
* p < .05.
** p < .01.
The third group (CLUSTER 3) was labeled as the group ofprotected, conscious users(39.76%, n = 99). These youths were slightly prone to problematic use. This cluster contained the largest proportion of our sample. Low levels of problematic use, sensation seeking and boredom proneness were contributing to protection and consciousness. In par- allel, higher scores of protective factors like self-esteem, self-regulation and resilience may also play some role in the overall behavior of group members.
CLUSTER 4 was the group ofstrongly problematic, unprotected users (15.66%, n = 39). Participants in this cluster had the highest scores of problematic Internet and smartphone use, while they seem less
protected according to reporting the lowest levels of protective factors such as self-esteem, self-regulation and resilience.
3.3. Sociodemographic differences in cluster profiles
Using Chi-square tests (Table 3) and ANOVA (Table 4) we did not find any significant relationships among the clusters with most socio- demographic variables (gender, self-assessed socioeconomic status, fa- mily structure, type of school), except for age where we found that the cluster of problematic users was typically characterized as younger users [F(3,245) = 3,747, p < 0,05].
Table 2
Means, SD, z-scores and F-test for the user clusters (N = 249).
CLUSTER 1 mean (SD) z-score
CLUSTER 2 mean (SD) z-score
CLUSTER 3 Mean (SD) z-score
CLUSTER 4 mean (SD) z-score
F-value
Problematic smartphone use 69.80 (11.31) 0.76
38.71 (7.95)
−0.84
47.79 (10.49)
−0.37
82.95 (14.84) 0.45
177.5***
Problematic Internet use 38.63 (7.78) 0.37
28.66 (6.60)
−0.62
32.22 (8.51)
−0.26
47.46 (8.03) 1.25
54.4***
Sensation seeking 28.24
(6.22) 0.54
24.77 (7.42) 0.10
22.96 (6.07)
−0.27
24.85 (4.78) 0.02
7.35***
Self-esteem 29.33
(6.36)
−0.08
29.9 (6.28) 0.02
30.92 (5.83) 0.17
27.36 (7.13)
−0.38
3.12*
Self-regulation 19.22
(3.85)
−0.15
20.18 (3.96) 0.09
20.45 (3.87) 0.15
18.33 (5.00)
−0.36
3.02*
Flow 82.74
(9.14) 0.48
73.18 (12.25)
−0.41
78.34 (9.99) 0.07
76.87 (8.89)
−0.06
7.98***
Resilience 29.09
(6.44) 0.22
28.88 (7.07) 0.19
27.42 (5.96)
−0.03
24.41 (6.44)
−0.49
4.9**
Boredom proneness 123.59
(12.63) 1.28
108.60 (11.70) 0.40
88.40 (8.43)
−0.80
99.41 (11.60)
−0.15
124.9***
Name of clusters Strongly protected problematic sensation seekers
Not vulnerable, balanced users
Protected, conscious users
Strongly problematic, unprotected users
Percentage (n) 18.48% (46) 26.10% (65) 39.76% (99) 15.66% (39)
* p < .05.
** p < .01.
*** p < .001.
Fig. 1.User cluster profiles based on z- scores Note. PSU = problematic smart- phone use; PIU = problematic Internet use;
SS = sensation seeking; SE = self-esteem;
SR = self-regulation; Res = resilience;
BP = boredom proneness. Cluster 1 = strongly protected, problematic sensa- tion seekers; Cluster 2 = not vulnerable, balanced users; Cluster 3 = protected, conscious users; Cluster 4 = strongly pro- blematic, unprotected users.
4. Discussion
This study was interested in investigating user profiles to examine differences among different user groups by means of psychological variables such as boredom proneness,flow, resilience, self-esteem, self- regulation and sensation seeking. These psychological variables pre- viously seemed to have a special relevance to youth in relation to digital behavior (e.g.,Kara, 2019; Mei et al., 2016; Wang, 2018). As far as we know, this is thefirst study examining these types of problematic use of digital devices together with psychological risk and protective factors variables among youth to understand different user profiles.
In our research, four user profiles emerged using K-means cluster analysis. Applying the conceptual framework of risk and protective factors (Jessor, 1991), we have identified a number of specific re- lationships between groups of young Internet users and varying levels of vulnerability and protection. These levels of vulnerability, together with the availability of protection, would make it possible to con- centrate not only on problems associated with use, but also on possible solutions. Therefore, we believe the description of these user profiles could be instrumental in establishing and developing prevention and intervention programs that target problematic Internet and smartphone users across similar age groups.
The biggest portion of the sample (approximately 40%) belonged to the cluster which consisted of users who were moderately at risk for problematic use; however, they do not use the online world for sensa- tion-seeking but for other reasons like studying, searching information, and instant messaging. There are several studies which discuss the harms and benefits of different contexts of Internet and smartphone use, and it is clear that people using the online space for educational and work-related purposes have lower risks to engage in addictive behavior compared to those who visited the Internet for entertainment and social activities (Akar, 2015; Karacic & Oreskovic, 2017). In addition, these youths also seemed to have the highest level of self-esteem and self-
regulation that likely are acting as protective factors in the case of problematic use (Coyne et al., 2019; Mei et al., 2016). Therefore, we named this group as protected, conscious users who were slightly prone to problematic use. As previous studies suggest, increased self-esteem and self-regulation enable users to control their online time effectively, thus, they can avoid the addictive potential of the digital environment (Koo & Kwon, 2014). In this regard, strengthening the level of these psychological factors might be considered an essential part of any prevention and intervention efforts as well.
It was promising that the balanced, not vulnerable users belonged to the second largest group (approximately 26%). The participants in this cluster had the lowest scores on the scales of problematic use for both Internet and smartphone, and moderated levels of boredom proneness and sensation seeking. However, they could balance these features by higher levels of self-esteem and self-regulation. These results are in accordance with other researchers’findings regarding the role of pro- tective factors and their impact on user behavior (Kim & Davis, 2009;
Mei et al., 2016).
Another cluster (approximately 18%) included those sensation seekers who were strongly protected but prone to problematic use.
These users were highly motivated by getting new experiences and excitements in order to use specific online platforms. As we assumed based on previous research (Kara, 2019; Lavin et al., 1999; Shi, Chen, &
Tian, 2011), sensation seeking had a major role in developing excessive and problematic use. Furthermore, members of this cluster scored the highest level on the scales offlow and boredom proneness. Together with the concept of sensation seeking, these risk factors were strongly interrelated with one other (Elhai et al., 2017; Rettie, 2001). Protection was also present in the form of higher level of resilience, and seemed to play a protective role exclusively among users reporting greater vul- nerability. Previous researchers reported resilience as protective factor (Kim et al., 2014; Robertson et al., 2018), but we found that self-esteem and self-regulation had a more decisive role than resilience.
Table 3
Cluster categorization relative to certain sociodemographic variables (N = 249).
Strongly protected problematic sensation seekers (%)
Not vulnerable, balanced users (%)
Protected, conscious users (%)
Strongly problematic, unprotected users (%)
Gender
Males 20.2 27.7 36.2 16.0
Females 17.4 25.2 41.9 15.5
Pearson Chi-square = 0.83 (N.S.) SES self-assessment
Lower/lower-middle class 27.8 24.1 31.5 16.7
Middle class 15.3 27.3 41.3 16.0
Upper/upper-middle class 17.8 24.4 44.4 13.3
Pearson Chi-square = 5.04 (N.S.) Family structure
Two parents 18.0 26.2 40.1 15.7
One parent 18.9 25.7 39.2 16.2
Pearson Chi-square = 0.99 (N.S.) Type of school
High school 19.3 28.1 31.6 21.1
College/university 18.4 25.8 41.2 13.7
Pearson Chi-square = 0.41 (N.S.)
Note. Chi-square test. No significant differences were justified.
Table 4
Cluster categorization relative to students’age (N = 249).
Strongly protected problematic sensation seekers Mean (S.D.)
Not vulnerable, balanced users Mean (S.D.)
Protected, conscious users Mean (S.D.)
Strongly problematic, unprotected users Mean (S.D.)
Age
F-value = 3.24*
22.15 (3.42) 23.05 (3.86) 22.93 (3.32) 20.95 (3.55)
Note. ANOVA.
* p < .05.
Finally, the last cluster (approximately 16%) was the group of strongly problematic, unprotected users who had the highest scores of problematic use, while they scored very low on the scales of self-es- teem, self-regulation and resilience. These users were not merely vul- nerable, but at risk for higher levels of problematic use due to the lack of protection. In addition, younger peers were more likely to found in this unprotected group; indicating the tendency that recently proble- matic usage can start at an earlier age due to premature digital socia- lization among young children (Yadav & Chakraborty, 2017).
The limited statistical significance among sociodemographic vari- ables may highlight the universality of digital device use: the Internet has become so widespread and certainly one of the most rapidly adopted technologies in the history of humanity, particularly among youth (see e.g., Firth et al., 2019). Youth tend to be present in the online world regardless of gender or socioeconomic background (Mitchell & Hussain, 2018). Similar to otherfindings (e.g.,Mitchell &
Hussain, 2018), our results also suggest that age seems to be a sig- nificant negative predictor of problematic use, namely, younger people are more likely to display symptoms of problematic use in digital de- vices. These results underline the risk that younger groups may ex- perience with higher levels vulnerability to problematic digital device use (Yadav & Chakraborty, 2017).
Overall,findings from the present research suggest the following:
(1) among the psychological variables, there were positive correlations between problematic Internet and smartphone use and the risk factors, and negative correlations with protective ones in this sample of Hungarian youth; (2) sensation seeking plays a major role in developing problematic behavior; (3) boredom proneness and flow experience during connection to the Internet contribute to youth’s elevated levels of vulnerability; and (4) higher levels of self-esteem and self-regulation were important protective factors among users, while resilience played a lesser role in relationship to problematic use.
In summary, our work provides clear evidence of the protective role of self-esteem, self-regulation and resilience, and the fact that sensation seeking, boredom proneness and flow are significant risk factors for developing problematic Internet and smartphone use. These results also support the applicability of cluster analysis in detecting levels of vul- nerability for the most potential problematic users of youth compared to those who seem protected.
Beyond the importance of thesefindings and the underlying work on technological usage and its risks for youth, our work has some im- portant limitations are worth noting. Because of the small sample size and the cross-sectional design, our results cannot provide any cause- and-effect relationships. More studies are needed with longitudinal design and well-defined study populations in order to draw valid con- clusions about the mechanisms and causal effects of risk and protective factors and their impact on problematic use. We recognize the ongoing debate about online sampling and whether it is suitable for some stu- dies (e.g., reliable prevalence rate). In the case of problematic use, it has been noted to be a valid and reliable platform since youth prefer this form when it comes to responding to surveys compared to the paper and pencil method (Ward, Clark, Zabriskie, & Morris, 2012). Likewise, using an online convenience sample, respondents are usually motivated tofind andfill out the questionnaire completely (Bornstein, Jager, &
Putnick, 2013).
We also recognize that another limitation of this study is the use of self-reported data to determine problematic use and psychological cir- cumstances and behavior. Therefore, results could be impacted by re- call bias and response-style bias as it is typically found in similar sur- veys, while self-reported data collection among young people was found to be valid and useful (Knäuper et al., 2016). Due to the online convenience sampling in a specific cultural context, generalizability of our study may be limited.
Finally, we examined a rather limited number of risk and protective factors in the current research and additional studies are needed to explore other potential factors and their role in better understanding
problematic technological use among youth. Future studies may also be focused more on youth’s mental well-being as a broader context to understanding Internet and smartphone use as well. Despite these limitations, the results of our study have important implications for future research in helping to develop a clearer picture regarding risk and protective status of youth.
As to the practical implications of this work, prevention and treat- ment of problematic use should consider including strengthening and developing a range of psychological skills including self-esteem, self- regulation and resilience, andfinding other tools to prevent boredom.
Our cluster model suggests that for those who were identified as pro- blematic users without the necessary protection, there is a need for special skills training. For example, Lim, Bae, and Kim (2004) in- troduced a training model that aimed to address problematic Internet use in schools by increasing awareness about its negative consequences, and to help students with developing proper self-regulation skills. This model is composed of three modules: learning activities about proble- matic use, prevention-related educational materials and preventive activities. In another example,Neverkovich et al. (2018)established a prevention program with three main objectives, of which formation of young students’personal life attitudes and values like self-esteem that were needed to determine their social and professional development outside the digital environment. Shubnikova, Khuziakhmetov, and Khanolainen (2017)developed a program of youth’s personality resi- lience formation that consists of training sessions aimed at creating an adaptive coping model and increased personal resources such as resi- lience. According to the work ofZhou, Zhang, Liu, and Wang (2017), developing problem solving skills, emotional control and toughness may be the part of such intervention. Recognizing any underlying issues that may negatively impact the level of the abovementioned psycho- logical skills, could also support the prevention of becoming proble- matic user. Among the available prevention and intervention tools, we might also recommend cognitive-behavioral methods to modify the attitudes of young people towards their digital devices not only for those who are problematic users but for everyone to maintain a con- scious use; this way of intervention is supported by a number of re- searchers (e.g.,Czincz & Hechanova, 2009; Malak, 2018).
Moreover, we believe that it is important to encourage young people to engage in alternative leisure activities and strategies related to en- tertainment, especially those with high level of sensation seeking and boredom. Recreation forms such as music, art and exercise may also provide appropriate strategies for professional intervention among those youth experiencing leisure time problems, thus helping to de- crease problematic digital device use (Kim, 2013). As an example of this intervention,Liao (2011)showed that sports and outdoor recreation can be a useful intervention in preventing and treating problematic Internet and smartphone use: students who did some kind of sport or recreation tend to report fewer problematic use behaviors compared to those students who did not engage in sport or outdoor recreation. While the Internet and smartphone often consume the Z generation, there are important alternatives to help mitigate and reduce this overwhelming influence that continues to be highlighted as a problem. Technology is not the problem, rather it seems to be more about how we choose to introduce, regulate, and provide access to our youth that needs closer examination.
Formatting of funding sources
This research did not receive any specific grants from and funding agencies in the public, commercial or nonprofit sectors.
Declaration of Competing Interest
The authors declared that there is no conflict of interest.
Appendix A. Supplementary material
Supplementary data to this article can be found online athttps://
doi.org/10.1016/j.childyouth.2019.104612.
References
Aboujaoude, E. (2010). Problematic Internet use: An overview.World Psychiatry, 9(2), 85–90.https://doi.org/10.1002/j.2051-5545.2010.tb00278.x.
Akar, F. (2015). Purposes, causes and consequences of excessive Internet use among Turkish adolescents.Eurasian Journal of Educational Research, 60, 35–56.https://doi.
org/10.14689/ejer.2015.60.3.
Bornstein, M. H., Jager, J., & Putnick, D. L. (2013). Sampling in developmental science:
Situations, shortcomings, solutions, and standards.Developmental Review, 33(4), 357–370.https://doi.org/10.1016/j.dr.2013.08.003.
Cairns, K. E., Yap, M. B. H., Pilkington, P. D., & Jorm, A. F. (2014). Risk and protective factors for depression that adolescents can modify: A systematic review and meta- analysis of longitudinal studies.Journal of Affective Disorders, 169(1), 61–75.https://
doi.org/10.1016/j.jad.2014.08.006.
Campbell-Sills, L., & Stein, M. B. (2007). Psychometric analysis and refinement of the Connor-Davidson Resilience Scale (CD-RISC): Validation of a 10-item measure of resilience.Journal of Traumatic Stress, 20(6), 1019–1028.https://doi.org/10.1002/
jts.20271.
Chang, J. P.-C., & Hung, C.-C. (2012). Problematic Internet Use. In J. M. Rey (Ed.).
IACAPAP e-Textbook of Child and Adolescent Mental Health. Geneva: International Association for Child and Adolescent Psychiatry and Allied Professions.
Chen, B., Liu, F., Ding, S., Ying, X., Wang, L., & Wen, Y. (2017). Gender differences in factors associated with smartphone addiction: A cross-sectional study among medical college students.BioMed Central Psychiatry, 17, 341.https://doi.org/10.1186/
s12888-017-1503-z.
Choi, S.-W., Kim, D.-J., Choi, J.-S., Ahn, H., Choi, E.-J., Song, W.-Y., ... Youn, H. (2015).
Comparison of risk and protective factors associated with smartphone addiction and Interner addiction.Journal of Behavioral Addictions, 4(4), 308–314.https://doi.org/
10.1556/2006.4.2015.043.
Chou, W.-J., Chang, Y.-P., & Yen, C.-F. (2018). Boredom proneness and its correlation with Internet addiction and Internet activities in adolescents with attention-deficit/
hyperactivity disorder.The Kaohsiung Journal of Medical Sciences, 34(8), 467–474.
https://doi.org/10.1016/j.kjms.2018.01.016.
Connor, K. M., & Davidson, J. R. T. (2003). Development of a new resilience scale: The Connor-Davidson Resilience Scale (CD-RISC).Depression & Anxiety, 18(2), 76–82.
https://doi.org/10.1002/da.10113.
Coyne, S. M., Stockdale, L., & Summers, K. (2019). Problematic cell phone use, depres- sion, anxiety, and self-regulation: Evidence from a three-year longitudinal study from adolescence to emerging adulthood.Computers in Human Behavior, 96, 78–84.
https://doi.org/10.1016/j.chb.2019.02.014.
Csibi, S., Demetrovics, Z., & Szabó, A. (2017). Validation of Hungarian Smartphone Deprivation Inventory (HSDI) with school children.Psychiatria Hungarica, 32(3), 307–312 (in Hungarian).
Czincz, J., & Hechanova, R. (2009). Internet addiction: Debating the diagnosis.Journal of Technology in Human Services, 27, 257–272.https://doi.org/10.1080/
15228830903329815.
Demetrovics, Z., Szeredi, B., & Nyikos, E. (2004). The development of the Problematic Internet Use Questionnaire.Psychiatria Hungarica, 19(2), 141–160 (in Hungarian).
Demetrovics, Z., Szeredi, B., & Rózsa, S. (2008). The three-factor model of Internet ad- diction: The development of the Problematic Internet Use Questionnaire.Behavior Research Methods, 40(2), 563–574.https://doi.org/10.3758/BRM.40.2.563.
Elhai, J. D., Vasquez, J. K., Lustgarten, S. D., Levine, J. C., Hall, B. J., & Hall, B. J. (2017).
Proneness to boredom mediates relationships between problematic smartphone use with depression and anxiety severity.Social Science Computer Review, 36(6), 707–720.
https://doi.org/10.1177/0894439317741087.
Farmer, R., & Sundberg, N. D. (1986). Boredom proneness: The development and cor- relates of a new scale.Journal of Personality Assessment, 50(1), 4–17.https://doi.org/
10.1207/s15327752jpa5001_2.
Firth, J., Torous, J., Stubbs, B., Firth, J. A., Steiner, G., Smith, L., ... Sarris, J. (2019). The
“online brain”: How the Internet may be changing our cognition.World Psychiatry, 18, 119–129.https://doi.org/10.1002/wps.20617.
Gamito, P., Morais, D. G., Oliveira, J. G., Brito, R., Rosa, P. J., & de Matos, M. G. (2016).
Frequency is not enough: Patterns of use associated with risk of Internet addiction in Portuguese adolescents.Computers in Human Behavior, 58, 471–478.https://doi.org/
10.1016/j.chb.2016.01.013.
Geck, C. (2006). The generation Z connection: Teaching information literacy to the newest net generation.Teacher Librarian, 33(3), 19–23.
Geng, J., Han, L., Gao, F., Jou, M., & Huang, C. C. (2018). Internet addiction and pro- crastination among Chinese young adults: A moderated mediation model.Computers in Human Behavior, 84, 320–333.https://doi.org/10.1016/j.chb.2018.03.013.
Griffiths, M. D. (2005). A components model of addiction within a biopsychosocial fra- mework.Journal of Substance Use, 10(4), 191–197.https://doi.org/10.1080/
14659890500114359.
Hou, X.-L., Wang, H.-Z., Guo, C., Gaskin, J., Rost, D. H., & Wang, J.-L. (2017).
Psychological resilience can help combat the effect of stress on problematic social networking site usage.Personality and Individual Differences, 109, 61–66.https://doi.
org/10.1016/j.paid.2016.12.048.
Hoyle, R. H., Stephenson, M. T., Palmgreen, P., Lorch, E. P., & Donohew, L. (2002).
Reliability and validity of scores on a brief measure of sensation seeking.Personality
and Individual Differences, 32(3), 401–414.https://doi.org/10.1016/S0191-8869(01) 00032-0.
Járai, R., Vajda, D., Hargitai, R., Nagy, L., Csókási, K., & Kiss, E. C. (2015). Characteristics of the 10-item Connor-Davidson Resilience Scale.Alkalmazott Pszichológia, 15(1), 129–136.https://doi.org/10.17627/ALKPSZICH.2015.1.129(in Hungarian).
Jenaro, C., Flores, N., Gómez-Vela, M., González-Gil, F., & Caballo, C. (2007). Problematic internet and cell-phone use: Psychological, behavioral, and health correlates.
Addiction Research & Theory, 15(3), 309–320.https://doi.org/10.1080/
16066350701350247.
Jessor, R. (1991). Risk behavior in adolescence: A psychosocial framework for under- standing and action.Journal of Adolescent Health, 12, 597–605.https://doi.org/10.
1016/1054-139X(91)90007-K.
Kara, F. M. (2019). Internet Addiction: Relationship with perceived freedom in leisure, perception of boredom and sensation seeking.Higher Education Science, 9(2), 131–140.https://doi.org/10.5539/hes.v9n2p131.
Karacic, S., & Oreskovic, S. (2017). Internet Addiction Through the Phase of Adolescence:
A Questionnaire Study.JMIR mental health, 4(2), e11.https://doi.org/10.2196/
mental.5537.
Kassambara, A. (2017).Practical Guide To Cluster Analysis in R.STHDAhttp://www.sthda.
com.
Kayri, M., & Günüç, S. (2016). Comparing Internet Addiction in students with high and low socioeconomic status levels.Addicta: The Turkish Journal on Addictions, 3, 177–183.
Kim, H. S., & Hodgins, D. C. (2018). Component Model of Addiction Treatment: A Pragmatic Transdiagnostic Treatment Model of Behavioral and Substance Addictions.
Frontiers in psychiatry, 9, 406.https://doi.org/10.3389/fpsyt.2018.00406.
Kim, H.-K., & Davis, K. E. (2009). Toward a comprehensive theory of problematic Internet use: Evaluating the role of self-esteem, anxiety,flow, and the self-rated importance of Internet activities.Computers in Human Behavior, 25, 490–500.https://doi.org/10.
1016/j.chb.2008.11.001.
Kim, H. (2013). Exercise rehabilitation for smartphone addiction.Journal of Exercise Rehabilitation, 9(6), 500–505.https://doi.org/10.12965/jer.130080.
Kim, S. M., Huh, H. J., Cho, H., Kwon, M., Choi, J. H., Ahn, H. J., ... Kim, D. J. (2014). The effect of depression, impulsivity, and resilience on smartphone addiction in uni- versity students.Journal of Korean Neuropsychiatric Association, 53(4), 214–220.
https://doi.org/10.4306/jknpa.2014.53.4.214.
Koo, H. J., & Kwon, J.-H. (2014). Risk and protective factors of Internet addiction: A meta-analysis of empirical studies in Korea.Yonsei Medical Journal, 55(6), 1691–1711.https://doi.org/10.3349/ymj.2014.55.6.1691.
Knäuper, B., Carrière, K., Chamandy, M., Xu, Z., Schwarz, N., & Rosen, N. O. (2016). How aging affects self-reports.European Journal of Ageing, 13, 185–193.https://doi.org/
10.1007/s10433-016-0369-0.
Kormas, G., Critselis, E., Janikian, M., Kafetzis, D., & Tsitsika, A. (2011). Risk factors and psychosocial characteristics of potential problematic and problematic internet use among adolescents: A cross-sectional study.BMC Public health, 11, 595.https://doi.
org/10.1186/1471-2458-11-595.
Lavin, M., Marvin, K., McLarney, A., Nola, V., & Scott, L. (1999). Sensation seeking and collegiate vulnerability to Internet dependence.CyberPsychology and Behavior, 2(5), 425–430.https://doi.org/10.1089/cpb.1999.2.425.
Lemola, S., Perkinson-Gloor, N., Brand, S., Dewald-Kaufmann, J. F., & Grob, A. (2015).
Adolescents’electronic media use at night, sleep disturbance, and depressive symp- toms in the smartphone age.Journal of Youth and Adolescence, 44(2), 405–418.
https://doi.org/10.1007/s10964-014-0176-x.
Leung, L. (2008). Leisure boredom, sensation seeking, self-esteem, addiction symptoms and patterns of cell phone use. In E. A. Konijn, S. Utz, M. Tanis, & S. B. Barnes (Eds.).
Mediated interpersonal communication(pp. 359–381). New York: Routledge.
Liao, X.-H. (2011). Analysis of the feasibility of exercise intervention in University Students' Internet Addiction on exercise psychology. In: Paper presented at the International Conference on Human Health and Biomedical Engineering, 19-22 August 2011, Jilin, China. Proceedings, pp. 740–743.https://doi.org/10.1109/
HHBE.2011.6028932.
Lim, J.-S., Bae, Y.-K., & Kim, S.-S. (2004). A learning system for Internet addiction pre- vention. In: Paper presented at the IEEE International Conference on Advanced Learning Technologies, 30 August - 1 September 2004, Joensuu, Finland.
Proceedings, pp. 836–837.https://doi.org/10.1109/ICALT.2004.1357678.
Lin, Y.-H., Chang, L.-R., Lee, Y.-H., Tseng, H.-W., & Kuo, T. B. J. (2014). Development and Validation of the Smartphone Addiction Inventory (SPAI).PLoS ONE, 9(6), e98312.
https://doi.org/10.1371/journal.pone.0098312.
Luszczynska, A., Diehl, M., Gutiérrez-Dona, B., Kuusinen, P., & Schwarzer, R. (2004).
Measuring one component of dispositional self-regulation. Attention control in goal pursuit.Personality and Individual Differences, 37(3), 555–566.https://doi.org/10.
1016/j.paid.2003.09.026.
Magyaródi, T., Nagy, H., Soltész, P., Mózes, T., & Oláh, A. (2013a). Psychometric prop- erties of a newly establishedflow state questionnaire.Pszichológia, 33(1), 15–36.
https://doi.org/10.1556/Pszicho.33.2013.1.2(in Hungarian).
Magyaródi, T., Nagy, H., Soltész, P., Mózes, T., & Oláh, A. (2013b). Psychometric prop- erties of a newly establishedflow state questionnaire.The Journal of Happiness & Well- Being, 1(2), 85–96 Downloaded:https://www.journalofhappiness.net/article/
psychometric-properties-of-a-newly-established-flow-state-questionnaire (June 24, 2019).
Malak, M.Z. (2018). Internet addiction and cognitive behavioral therapy. Chapter 10. In:
Cognitive Behavioral Therapy and Clinical Applications.https://doi.org/10.5772/
intechopen.71277.
Mayer, K., Lukács, A., & Pauer, G. (2012). Hungarian adaptation of the 8-item Sensation Seeking Scale (BSSS-8).Mentálhigiéné és Pszichoszomatika, 13(3), 297–312.https://
doi.org/10.1556/Mental.13.2012.3.3 (in Hungarian).
Mei, S., Yau, Y. H. C., Chai, J., Guo, J., & Potenza, M. N. (2016). Problematic internet use, well-being, self-esteem and self-control: Data from a high-school survey in China.
Addictive Behaviors, 61, 74–79.https://doi.org/10.1016/j.addbeh.2016.05.009.
Mitchell, L., & Hussain, Z. (2018). Predictors of problematic smartphone use: An ex- amination of the integrative pathways model and the role of age, gender, impul- siveness, excessive reassurance seeking, extraversion, and depression.Behavioral Sciences, 8, 74.https://doi.org/10.3390/bs8080074.
Mok, J.-Y., Choi, S.-W., Kim, D.-J., Choi, J.-S., Lee, J., Ahn, H., ... Song, W.-Y. (2014).
Latent class analysis on internet and smartphone addiction in college students.
Neuropsychiatric Disease and Treatment, 10, 817–828.https://doi.org/10.2147/NDT.
S59293.
Neverkovich, S. D., Bubnova, I. S., Kosarenko, N. N., Sakhieva, R. G., Sizova, Z. M., Zakharova, V. L., & Sergeeva, M. G. (2018). Students’Internet Addiction: Study and Prevention.EURASIA Journal of Mathematics, Science and Technology Education, 14(4), 1483–1495.https://doi.org/10.29333/ejmste/83723.
Pawlikowski, M., Altstötter-Gleich, C., & Brand, M. (2013). Validation and psychometric properties of a short version of Young’s Internet Addiction Test.Computers in Human Behavior, 29(3), 1212–1223.https://doi.org/10.1016/j.chb.2012.10.014.
Rettie, R. (2001). An exploration offlow during Internet use.Internet Research, 11(2), 103–113.https://doi.org/10.1108/10662240110695070.
Robertson, T. W., Yan, Z., & Rapoza, K. A. (2018). Is resilience a protective factor of Internet addiction?Computers in Human Behavior, 78, 255–260.https://doi.org/10.
1016/j.chb.2017.09.027.
Rosenberg, M. (1965).Society and the Adolescent Self-Image.Princeton, NJ: Princeton University Press.
Sallay, V., Martos, T., Földvári, M., Szabó, T., & Ittzés, A. (2014). Hungarian version of the Rosenberg Self-esteem Scale (RSES-H): An alternative translation, structural in- variance, and validity.Mentálhigiéné és Pszichoszomatika, 15(3), 259–275.https://doi.
org/10.1556/Mental.15.2014.3.7 (in Hungarian).
Shapira, N. A., Goldsmith, T. D., Keck, P., Jr., Khosla, U. M., & McElroy, S. L. (2000).
Psychiatric features of individuals with problematic Internet use.Journal of Affective Disorders, 57(1–3), 267–272.https://doi.org/10.1016/S0165-0327(99)00107-X.
Shi, J., Chen, Z., & Tian, M. (2011). Internet self-efficacy, the need for cognition, and sensation seeking as predictors of problematic use of the internet.Cyberpsychology, Behavior, and Social Networking, 14(4), 231–234.https://doi.org/10.1089/cyber.
2009.0462.
Shubnikova, E. G., Khuziakhmetov, A. N., & Khanolainen, D. P. (2017). Internet addiction of adolescents: Diagnostic problems and pedagogical prevention in the educational environment.EURASIA Journal of Mathematics Science and Technology Education, 13(8), 5261–5271.https://doi.org/10.12973/eurasia.2017.01001a.
Stone, A. L., Becker, L. G., Huber, A. M., & Catalano, R. F. (2012). Review of risk and
protective factors of substance use and problem use in emerging adulthood.Addictive Behaviors, 37, 747–775.https://doi.org/10.1016/j.addbeh.2012.02.014.
Taushanov, Z., & Berchtold, A. (2018). Markovian-Based Clustering of Internet Addiction Trajectories. In G. Ritschard, & M. Studer (Eds.).Sequence Analysis and Related Approaches. Life Course Research and Social Policies, (10)Cham: Springer.https://doi.
org/10.1007/978-3-319-95420-2_12.
Thomée, S. (2018). Mobile phone use and mental health. A review of the research that tajes a psychological perspective on exposure.Int. J. Environ. Res. Public Health, 15(12), 2692.https://doi.org/10.3390/ijerph15122692.
Vaghefi, I., & Lapointe, L. (2016). A typology of user liability to IT addiction.Information Systems Journal, 27(2),https://doi.org/10.1111/isj.12098.
Wang, P., Lei, L., Wang, X., Nie, J., Chu, X., & Jin, S. (2018). The exacerbating role of perceived social support and the“buffering”role of depression in the relation be- tween sensation seeking and adolescent smartphone addiction.Personality and Individual Differences, 130, 129–134.https://doi.org/10.1016/j.paid.2018.04.009.
Wang, W.-C. (2018). Exploring the relationship among free-time management, leisure boredom, and Internet addiction in undergraduates in Taiwan.Psychological Reports.
https://doi.org/10.1177/0033294118789034.
Ward, P., Clark, T., Zabriskie, R., & Morris, T. (2012). Paper/pencil versus online data collection: An exploratory study.Journal of Leisure Research, 44, 507–530.https://
doi.org/10.1080/00222216.2012.11950276.
Wolniewicz, C. A., Tiamiyu, M. F., Weeks, J. W., & Elhai, J. D. (2018). Problematic smartphone use and relations with negative affect, fear of missing out, and fear of negative and positive evaluation.Psychiatry Research, 262, 618–623.https://doi.org/
10.1016/j.psychres.2017.09.058.
Yadav, S., & Chakraborty, P. (2017). Children aged two to four are able to scribble and draw using a smartphone app.Acta Paediatrica, 106(6), 991–994.https://doi.org/10.
1111/apa.13818.
Zhou, P., Zhang, C., Liu, J., & Wang, Z. (2017). The relationship between resilience and Internet addiction: A multiple mediation model through peer relationship and de- pression.Cyberpsychology, Behavior, and Social Networking, 20(10), 634–639.https://
doi.org/10.1089/cyber.2017.0319.
Further reading
Ho, R. C., Zhang, M. W., Tsang, T. Y., Toh, A. H., Pan, F., Lu, Y., ... Mak, K. K. (2014). The association between internet addiction and psychiatric co-morbidity: A meta-ana- lysis.BMC Psychiatry, 14, 183.https://doi.org/10.1186/1471-244X-14-183.