CHANGES IN THE TERRITORIAL DISTRIBUTION OF POPULATION AND JOB SEEKERS WITH HIGHER EDUCATION IN HUNGARY
Tímea Győri PhD student
Hungarian University of Agricultural and Life Sciences, Doctoral School of Economics and Regional Sciences
e-mail: gyoritimi05@gmail.com Abstract
The study uses different statistical methods to examine the change in the territorial distribution and concentration of the tertiary-educated population and the unemployed between 2001 and 2019. Among the known regional inequality indicators measuring regional disparities, the Dual index and the Hoover index were used. With the help of the location quotient (LQ), the representation of those with higher education in relation to the average was explored and represented at the settlement level. Territorial autocorrelation was performed to more complexly examine the distribution and concentration of tertiary graduates within the population and the unemployed. Spatial neighborhood impact was analyzed using the Global and Local Moran Index. The autocorrelation confirmed regular spatial arrangements in the spatial distribution of tertiary graduates. The study explores whether different weighting of raw data affects the result of autocorrelation, furthermore determines the differences between the location quotient and the GIS representation of Local Moran I.
Kulcsszavak: higher education, unemployed, location quotient, territorial autocorrelation JEL besorolás: J64, R23
LCC: HD5701-6000.9
Introduction
Human capital appears as an important factor in modern theories of economic growth (Romer 1990, Aghion – Durlauf 2005, Acemoglu 2008, Varga 2009, Nagy et al. 2017). Harmonious territorial development is also determined by the labor market situation (Egri-Tánczos 2016, Egri-Kőszegi 2018). One of the basic indicators of the labor market situation is unemployment, which on the one hand should be interpreted as a social spatial structure indicator as the proportion of the unemployed, and on the other hand - from the perspective of economic spatial structure analyzes - as a potential labor reserve (PLR). The potential labor reserve is made up of the unemployed, the underemployed and the inactive, their quantity and quality can be considered as endogenous factors (Romer 1994, Capello 2007, Lengyel 2010), therefore it is justified to analyze its composition when examining competitiveness. According to Central Statistics Office (CSO) data, in 2019 approximately 50% of the labor force reserve was unemployed, 40% inactive and 10% underemployed.
According to NES data, the average number of registered jobseekers in 2000 was 329,628, and the relative ratio to the active age population was 9.4%. The working age population fell by 7.2% between 2000 and 2019, while the number of jobseekers fell by 35.7%. The number of unemployed in 2019 was 252,550, which 43.2% had primary or less school, 25.2% a skilled worker certificate, 25.4% a high school diploma and 6.2% a higher education degree. At the NUT2 level, the relative number of jobseekers is outstanding in the Northern Great Plain and Northern Hungary regions (Hajdú, 2020).The change in the number of unemployed with higher
education (∆UNE with higher education) compared to 2000 followed the same trend as the change in the total number of unemployed (Fig. 1). The effect of the economic crisis of 2008 can be clearly seen in the examined interval; from 2009 a jump-like growth took place. The pre-crisis level was reached again in 2014, with 441,936 jobseekers that year.
Figure 1. Change in the number of registered jobseekers (2000 = 100%) Source: Own calculation and editing based on NES data, 2000-2020
The coronavirus epidemic that will appear in 2019 it has an impact on the economy and the labor market. The Hungarian labor market is experiencing its third shock after the turn of the 1990s and the 2008 global economic crisis. As a result of the economic recession caused by the restrictions associated with the epidemic, unemployment it visibly rise again.
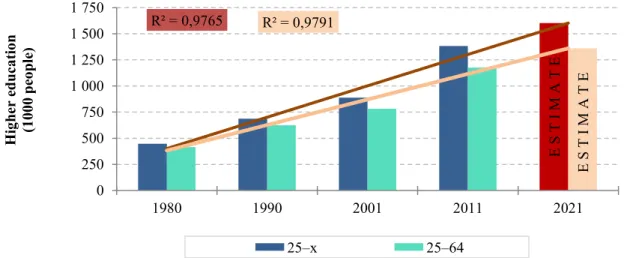
In Hungary, after 1980, the educational attainment of the population increased steadily (Kiss et al. 2008, Sánta et al. 2015, Szakálné et al. 2018); in 2011, 1,382,000 people already had a college or university degree (Fig. 2). The regression lines designated the expected 2021 values based on data from previous years; the coefficient of determination for both age groups is approximately 98%. Based on the regression lines, in 2021, the estimated number of the population with tertiary education will reach 1,603 thousand in the 25-x age group, and 1,361 thousand in the 25-64 age group.
Figure 2. Number of people with tertiary education (1000 people) Source: Own calculation and editing based on CSO data, 1980-2011
0%
50%
100%
150%
200%
250%
300%
350%
Year 2000 = 100%
∆UNE ∆UNE with higher education Year 2000 = 100%
E S T I M A T E E S T I M A T E R² = 0,9765 R² = 0,9791
0 250 500 750 1 000 1 250 1 500 1 750
1980 1990 2001 2011 2021
Higher education (1000 people)
25–x 25–64
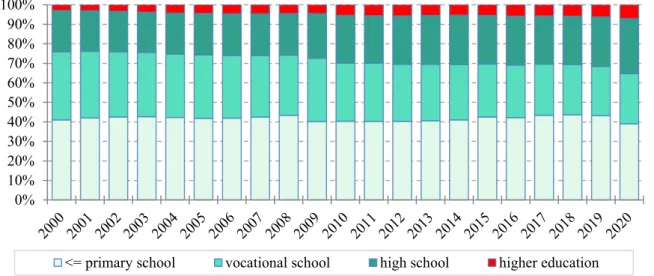
The general increase in the level of qualifications also had an effect on the distribution of the unemployed by educational attainment (Fig. 3). Within the surveyed interval, the proportion of registered jobseekers with a primary or lower education and a vocational certificate decreased slightly, while the proportion of those with a high school diploma and higher education increased. The proportion of people with tertiary (college and university) education has significantly increased with more than doubling reaching 7% in 2020.
Figure 3. Distribution of the unemployed by educational attainment (%) Source: Own calculation and editing based on NES data, 2000-2020
The study used different statistical methods to map the regional distribution and concentration of the tertiary-educated population and the registered unemployed as a highly qualified potential labor reserve in 2001, 2011, and 2019. In the framework of the research, I was looking for the answer to the question of whether regular territorial arrangements able to discovered in the territorial distribution of those with higher education.
Material and method
The basis of the spatial concentration study was the settlement level determined according to the LAU statistical zoning system. The territorial basis of the analysis was provided by the settlements of Hungary. To analyze the spatial location of the population with tertiary education, I used data from the two most recent censuses (2001 and 2011). For the unemployed, I performed my calculations with November 2001, 2011, and 2019 data. The source of the data is the databases of the CSO, the National Spatial Development and Spatial Planning Information System (NSDPIS) and the NES.
In the framework of the research, I revealed the direction and strength of the relationship between the graduate population and the number of unemployed by Pearson's correlation calculation. The coefficient is strong in absolute terms in the range of 0.7-1; medium at 0.3-0.7 intervals; and indicates a weak correlation at 0–0.3 intervals (Nemes Nagy 2005). In the framework of the research, I examined using a coefficient of determination what percentage of one criterion explains the variance of the other criterion. The coefficient of determination is equal to the square of Pearson's correlation coefficient (Zhang 2017).
In the study, the population with higher education and jobseekers with higher education (HI_UNE, HI_POP) was mapped by calculating the location quotient at the settlement level.
0%
10%
20%
30%
40%
50%
60%
70%
80%
90%
100%
<= primary school vocational school high school higher education
With the help of LQ we can get an answer as to whether the proportion of people belonging to a given group in a given settlement is under-represented or over-represented compared to the average of the group. The index can be well applied to the study of Hungarian regions (Vas et al., 2015). The method is most often used in the mapping of potential pulling sectors and clusters in Hungary (Gecse - Nikodémus 2003, Vas 2009). If LQ = 1, it can be interpreted as the same percentage distribution of people with higher education in the examined settlement as in the national average. I interpreted the index according to the following scale: no concentration below 1, moderately concentrated between 1.00-1.25, moderately concentrated between 1.26-1.50, and strongly concentrated above 1.50. The indicator expresses the regional distribution of the selected criterion with the following formula:
𝐿𝑄 = 𝐻𝐼_𝑈𝑁𝐸 𝑖
𝑈𝑁𝐸 𝑖
𝐻𝐼_𝑈𝑁𝐸 𝑈𝑁𝐸
HI_UNEi
UNEi
HI_UNE UNE
Unemployed with high education in settlement i”
Unemployed in settlement „i”
Unemployed with high education Total number of unemployment
Territorial differences in the distribution of the unemployed with tertiary education were also assessed using simple inequality indicators. These simpler inequality indicators determine the extent of spatial differences regardless of the spatial location of the data. The Dual Index is the quotient of the average of the values above the mean of the total distribution and the mean of the values below the mean of the total distribution. The Hoover index is a commonly used distribution-type indicator (Kiss - Németh 2006).
For a more complex study of the rate (Rate%) and concentration (LQ) of tertiary graduates, I used spatial autocorrelation, which is simply a correlation between values close to a variable in space (Dusek 2013). As part of my research, I also produced Global and Local Moran I statistics. Global Moran's I value change between -1 and +1, the closer it is to +1, the more significant the phenomenon of positive autocorrelation, values close to 0 indicate a random spatial distribution of the data (Dusek 2004).
Local Moran I is a spatial autocorrelation research that informs about the spatial distribution of inequalities together with GIS visualization (Tóth 2003), ignoring the extent of the differences.
Local Moran’s I assigns a numerical value to each settlement, the expected value of which is 0, so if we get a value significantly different from 0, it indicates a regularity that can be discovered in the spatial arrangement. Local Moran statistics are suitable for showing areas that are similar or different from their neighbors. We distinguish two types of regular arrangement (Anselin 1995). In the case of a positive autocorrelation, the data of the adjacent area units are similar to each other, in the case of a negative one; the adjacent areas differ from each other (Nemes Nagy 2005). In the case of non-autocorrelation, the individual values are distributed randomly; the spatial differences do not draw a regular spatial shape.
The Moran scatter plots together represent the standardized values of the variables and their associated Local Moran's I values. The four plane quarters of the resulting scatter diagram represent the High-High, Low-Low, High-Low, and Low-High clusters (Tóth 2003).
Interpretation of clusters:
• High-High: Settlements with a high value, where the settlements defined as neighboring also have a high value.
• Low-Low: Settlements with a low value, where the settlements defined as neighboring also have a low value.
• High-Low: Settlements with a high value, where settlements defined as neighboring have a low value.
• Low-High: Settlements with a low value, where settlements defined as neighboring have a high value.
In the study, I used different weight matrixes to operationalize neighborhood relations. Weight matrixes included the queen and rook contiguity taking into account common borders, furthermore distance-based (considers all territorial units within a given distance as neighbors) and also conceptualization based on the number of nearest neighbors. (Szakálné Kanó 2011, 2017, Dusek – Kotosz 2016, Egri 2017). The weight matrixes were parameterized separately in .gal, .gwt, and .swm files before running the Moran's I statistics.
Results
As the first step of the research, the correlations between the number of active age population at the settlement level (ACT_POP), the number of unemployed (UNE), the number of people with higher education (HI_POP, HI_UNE), and the values of location quotients calculated from raw data of higher education their strength was explored by Pearson's correlation calculation.
The working age population and the number of unemployed have, of course, a strong positive correlation, as are the correlations between the unemployed with tertiary education and the total unemployed (UNE - HI_UNE) and the number of tertiary graduates (HI_UNE - HI_POP).
In contrast to the above, the values of the territorial concentration of those with tertiary education show a very weak positive correlation. While the correlation between the headcount data of tertiary attainment people in 2011 was r = 0.983, the correlation between their concentration was only r = 0.494. According to the coefficient of determination, the concentration of the tertiary population explained only 24.40% of the concentration of the unemployed with tertiary education.
Table 1. Examining the relationship between selected indicators
Indicators Pearson’s
coefficient (r)
Significance (p)
Determination coefficient % (R2)
ACT_POP – UNE 2001 0,891** 0,000 79,39
ACT_POP – UNE 2011 0,962** 0,000 92,54
UNE – HI_UNE 2001 0,940** 0,000 88,36
UNE – HI_UNE 2011 0,972** 0,000 94,48
HI_UNE – HI_POP 2001 0,956** 0,000 91,39
HI_UNE – HI_POP 2011 0,983** 0,000 96,62
LQ_HI_UNE – LQ_HI_POP 2001 0,318** 0,000 10,11
LQ_HI_UNE – LQ_HI_POP 2011 0,494** 0,000 24,40
** Significant at p <0.01 level
Source: Own calculation and editing based on NES and CSO data, 2001, 2011
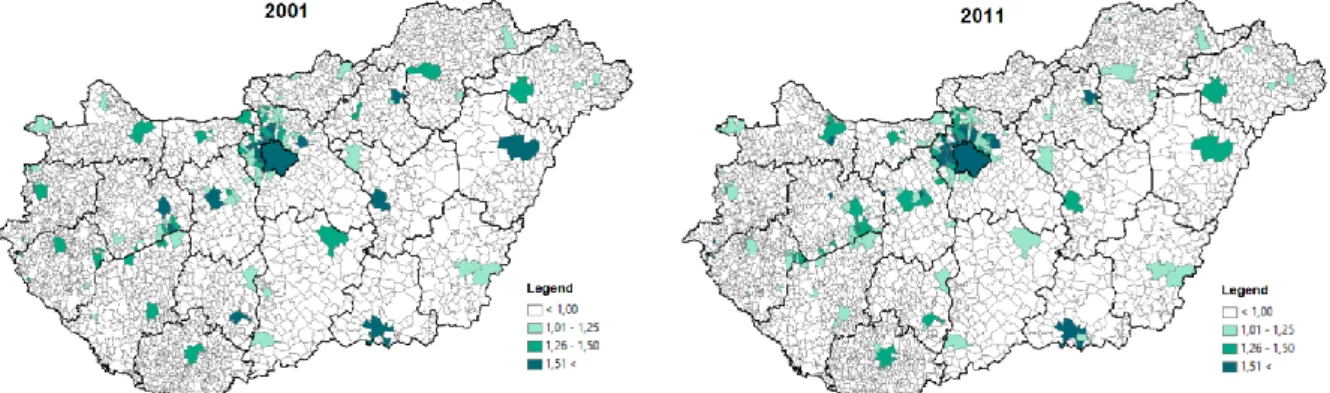
Examining the concentration of the graduate population (Fig. 4), it can be stated that in 2001 in 25 settlements and in 2011 in 37 settlements the location quotient indicated a strong (LQ> 1.5) concentration, so the proportion of graduates in these settlements was overrepresented to the average compared to. In both years, there is a significant concentration in Budapest and its catchment area, as well as in the county capitals and some larger cities where the proportion of people with higher education is higher than average.
Figure 4. Concentration of the population with tertiary education over 25 (LQ) Source: Own calculation and editing based on Census data, 2001, 2011
Almost all of the first 20 settlements with the highest concentration value belong to the Budapest agglomeration (Tab. 2), with the exception of some smaller settlements, where the concentration is due to the very low population.
Table 2. Settlements with the highest HI_POP concentration (2011) Plac
e Settlement LQ Plac
e Settlement LQ
1. Telki 2,946 11. Diósd 1,904
2. Nagykovácsi 2,438 12. Leányfalu 1,877
3. Sima 2,340 13. Sukoró 1,845
4. Budajenő 2,129 14. Bakonykúti 1,838
5. Üröm 2,122 15. Budapest 1,795
6. Budakeszi 2,099 16. Németbánya 1,780
7. Szentendre 2,048 17.
Pilisborosjen
ő 1,778
8. Solymár 2,046 18. Gödöllő 1,763
9.
Tornakápoln
a 1,974 19. Ispánk 1,709
10. Budaörs 1,974 20. Budakalász 1,695
Source: Own calculation and editing based on Census data, 2011
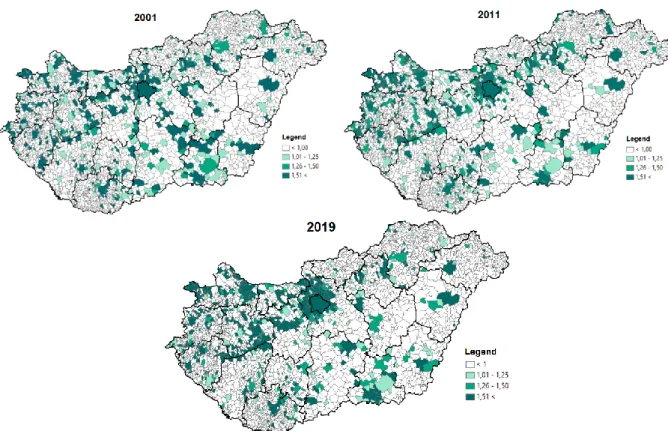
The territorial concentration of the unemployed with higher education increased between 2001 and 2019 (Fig. 5); the over-representation of graduates in 2019 affected several settlements.
The location quotient exceeded the 1.5 limit value in 359 settlements in 2001, 358 in 2011, and in 2019 already in 370 settlements. The concentration of the unemployed with higher education was also clustered in Budapest and its catchment area, furthermore accumulated around the university cities (Nyíregyháza, Debrecen, Szeged, Pécs, Győr, Kecskemét) and along Lake Balaton.
Figure 5. Concentration of the unemployed with higher education (LQ) Source: Own calculation and editing based on NES data, 2001, 2011, 2019
I also evaluated the spatial polarization with the Dual index and the differences in the spatial distribution using the Hoover index. The regional differences in the distribution of the unemployed with higher education show a leveling off in the examined period, the value of the Dual indicator decreased to 19.02 by 2019 compared to the value of 24.18 in 2001. I also examined the relationship between the unemployed with tertiary education and the total unemployed using the Hoover index, which measures the difference in territorial distributions for the 2019 data. As a result of the study, it can be stated that 43.62% of the unemployed with higher education would have to be mobilized at the settlement level in order for their territorial distribution to be the same as the distribution of jobseekers.
The simpler inequality indicators used so far in the research (location quotient, Dual index and Hoover index) determined the extent of spatial differences regardless of the spatial location of the data. The spatial autocorrelation can provide information on the spatial distribution of inequalities, regardless of their magnitude.
In the rest of the research, I analyzed the raw and calculated data (Rate%, LQ) using the Global and Local Moran's I methods in order to be able to identify exactly the territorial units that are outstanding in terms of the proportion and concentration of tertiary graduates.
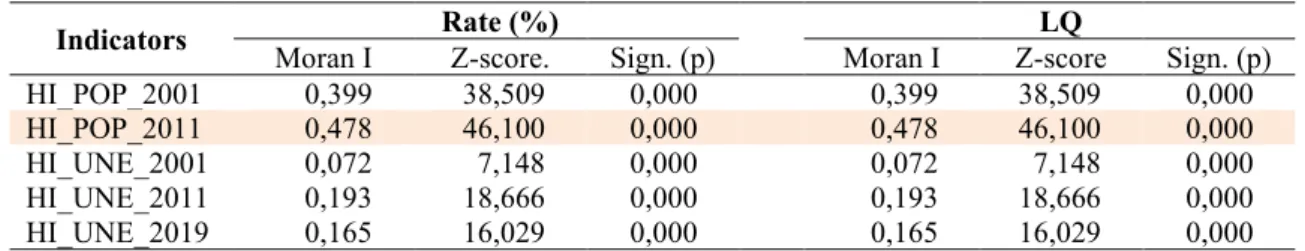
Moran's I values were also calculated for the simple percentage of the tertiary-educated population and graduate unemployed and for LQ values (Tab. 3). By examining population and unemployment indicators, I sought to answer whether weighting of raw data in different ways affects the value of Moran's I obtained. In this phase of the analysis, I used queen contiguity weight matrix to determine the neighborhood relationships, the number of permutations was 499. Table 3 shows the results of the calculations conceptualized according to the previous parameters. The calculated Moran's I and Z values can be considered significant at the p <0.001
level. The Moran I value calculated as a percentage of the graduate population was 0.390 in 2001 and 0.474 in 2011. All values had a statistically significant positive Z value, indicating clustering. Although the Moran's I values calculated for the proportion of unemployed graduates are lower (I = 0.165 in 2019); but the positive Z values here again suggest, that the spatial pattern is different such as we would expect as result of random spatial processes.
For 2011, I also obtained a higher positive spatial autocorrelation for the population and the unemployed than for 2001, so that during the equalization process, the neighboring territorial units became more and more similar to each other. The Moran's I value of the unemployed in 2019 indicates an increase in the heterogeneity of neighboring settlements, which, however, did not reach the 2001 level.
The analysis was also performed for the values of the location quotient with the same parameters. The values of the Moran I and Z-score, calculated to three decimal places, were the same as those obtained for the percentages.
Table 3. Moran's I values calculated for the ratio of graduates and LQ values
Indicators Rate (%) LQ
Moran I Z-score. Sign. (p) Moran I Z-score Sign. (p)
HI_POP_2001 0,399 38,509 0,000 0,399 38,509 0,000
HI_POP_2011 0,478 46,100 0,000 0,478 46,100 0,000
HI_UNE_2001 0,072 7,148 0,000 0,072 7,148 0,000
HI_UNE_2011 0,193 18,666 0,000 0,193 18,666 0,000
HI_UNE_2019 0,165 16,029 0,000 0,165 16,029 0,000
Source: Own calculation based on NES data 2001, 2011, 2019
Figure 6 shows the LISA indicators calculated for the 2011 data on the distribution of the population with tertiary education. The settlements that contributed the most to the value of the Moran index indicating high spatial autocorrelation can be identified on the map. In hot spot (High-High) settlements, in addition to their high tertiary education rate / concentration, they have similar neighbors with higher than average tertiary education rate / concentration (Fig.6).
Settlements with a lower than average high tertiary education and neighboring settlements also appear as true cold spots (Low-Low). In 2011, there were 359 hot spots and 281 cold spots in Hungary. The hot spots are represented by the Budapest agglomeration and the settlements surrounding Lake Balaton, supplemented by some large rural cities. The location of the hot spots shows a high degree of similarity to the high concentration indicated by the location quotients shown in Figure 4.
Figure 6. LISA map HI_POP– Queen contiguity Source: Own calculation and editing based on Census data, 2001, 2011
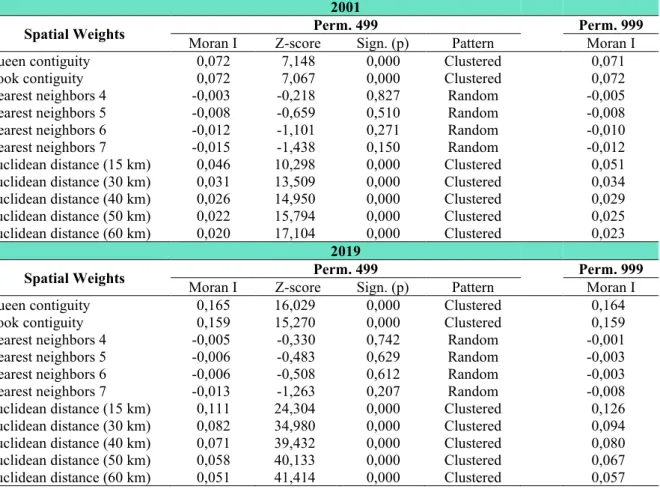
Global Moran's I statistics were also performed for the 2019 settlement-level ratios and location quotients (Rate%, LQ) of the unemployed with higher education using different types of weight matrixes. I made the calculations for 2001 and also 2019, so the changes over time could also be evaluated.
The obtained I, Z and Significance (Sign.) values as well as the information on clustering are given in Table 4. Statistics were run with 499 and 999 permutations. As the number of permutations increased, with the exception of Euclidean distances, Moran I values decreased.
Overall, it is true for the obtained results in both examined years that the Z values – with the exception of the given number of nearest neighboring weight matrixes – are significant at the p
<0.001 level. The probability that the results are due to chance is minimal. For the given number of nearest neighbors, the results obtained are not significant, the spatial distribution is random, so the distribution is not area and neighborhood dependent.
The variables showed clustering when using the queen, rook, and distance-based weight matrixes, the Z value is positive in all cases, so similar values are clustered in the territory.
Although the obtained Moran indexes are low for the weight matrixes producing a positive Z value, in spite of this the spatial autocorrelation is significant. Significant I values ranged from 0.02 to 0.072 in 2001 and from 0.051 to 0.165 in 2019. The highest Moran I values in both years studied (Imax2001 = 0.072, Imax2019 = 0.165) were given by the queen contiguity weight matrix with 499 permutations. The highest index was associated with Z = 7.148 in 2001 and Z = 16,029 in 2019.
I also obtained a high autocorrelation in relation to the research results using the rook contiguity weight matrixes. Euclidean distance-based weight matrixes gave significantly lower Moran index values. As the distance gradually increased (15 km, 30 km, 40 km, 50 km, 60 km), the Moran's I values decreased while the Z values increased. High Z values coupled with a low I value confirm the existence of a spatial autocorrelation.
Global Moran's I values increased in all cases between 2001 and 2019, so the territorial homogeneity of some spatial units increased, compared to 2001, the number of settlements belonging to the High-High and Low-Low clusters was higher in 2019 (Table 4.).
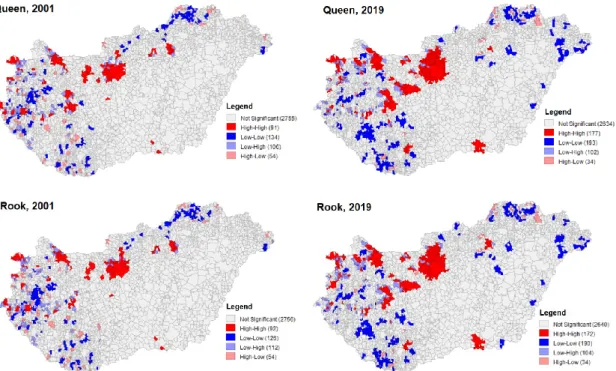
I also examined the spatial pattern of the proportion of the unemployed with tertiary education using the local test f(x) function of the territorial autocorrelation with the Local Moran I statistics. I made LISA maps about models which the highest Global Moran's I values. The models in Figure 7 included a queen neighborhood, a bastion neighborhood, and two distance- based (15 km, 30 km) weight matrices. I determined the number of permutations in 999. With the help of the map representation, it was possible to identify the spatial units in which the above-average values of the proportion / concentration of the unemployed with higher education are clustered. The maps shown only those settlements which the Local Moran I values were considered significant (p <0.05) at the 95% level.
Maps depicting LISA indexes, regardless of weighting, show more and more of both cold spot and hot spot in 2019 (Figure 7) while the number of spatial outliers (High-Low, Low-High) decreased, which certifies the Moran indexes growth, so a kind of equalization process took place. In the case of the Queen contiguity, 91 High-High and 134 Low-Low settlements can be identified in 2001, as well as 160 settlements, between which there is a sharp contrast in the
case of the selected criterion. In 2019, we can already consider 177 settlements as hot spots, 193 settlements as cold spots and a total of 136 settlements can be identified as outliers.
Table 4. Global Moran's I values calculated on the data of the proportion/concentration of the unemployed with higher education at the settlement level (2001,2019)
2001
Spatial Weights Perm. 499 Perm. 999
Moran I Z-score Sign. (p) Pattern Moran I
Queen contiguity 0,072 7,148 0,000 Clustered 0,071
Rook contiguity 0,072 7,067 0,000 Clustered 0,072
Nearest neighbors 4 -0,003 -0,218 0,827 Random -0,005
Nearest neighbors 5 -0,008 -0,659 0,510 Random -0,008
Nearest neighbors 6 -0,012 -1,101 0,271 Random -0,010
Nearest neighbors 7 -0,015 -1,438 0,150 Random -0,012
Euclidean distance (15 km) 0,046 10,298 0,000 Clustered 0,051 Euclidean distance (30 km) 0,031 13,509 0,000 Clustered 0,034 Euclidean distance (40 km) 0,026 14,950 0,000 Clustered 0,029 Euclidean distance (50 km) 0,022 15,794 0,000 Clustered 0,025 Euclidean distance (60 km) 0,020 17,104 0,000 Clustered 0,023
2019
Spatial Weights Perm. 499 Perm. 999
Moran I Z-score Sign. (p) Pattern Moran I
Queen contiguity 0,165 16,029 0,000 Clustered 0,164
Rook contiguity 0,159 15,270 0,000 Clustered 0,159
Nearest neighbors 4 -0,005 -0,330 0,742 Random -0,001
Nearest neighbors 5 -0,006 -0,483 0,629 Random -0,003
Nearest neighbors 6 -0,006 -0,508 0,612 Random -0,003
Nearest neighbors 7 -0,013 -1,263 0,207 Random -0,008
Euclidean distance (15 km) 0,111 24,304 0,000 Clustered 0,126 Euclidean distance (30 km) 0,082 34,980 0,000 Clustered 0,094 Euclidean distance (40 km) 0,071 39,432 0,000 Clustered 0,080 Euclidean distance (50 km) 0,058 40,133 0,000 Clustered 0,067 Euclidean distance (60 km) 0,051 41,414 0,000 Clustered 0,057
Source: Own calculation based on NES data, 2019
The high proportion / concentration of the unemployed with higher education in 2001 affected Budapest and its catchment area, Tatabánya, Győr, Veszprém, Siófok, Zalaegerszeg, Sopron, Eger and Gyöngyös towns and their agglomerations. Most of the settlements in the western part of the country appeared as hot spots. Most of the cold spots are located in the northern part of Borsod-Abaúj-Zemplén County, and a smaller clustering can be observed in the triangle delimited by the settlements of Pápa-Zalaegerszeg-Szombathely.
In addition to Borsod-Abaúj-Zemplén County, by 2019 Low-Low clusters also appeared in Szabolcs-Szatmár-Bereg, Baranya and Somogy counties. Between 2001 and 2019, the neighborhood effect became stronger, with hot spots covering an ever-increasing the area. The number of High-High settlements increased by 86 by 2019, new clusters appeared near Szeged and Székesfehérvár, and the existing clustering continued to expand. Overall, it can be stated that in 2019 the number of unemployed graduates was increase in Budapest and in the north- western counties of the country.
Using the rook contiguity neighborhood weight matrix, I obtained almost identical results in both years studied.
Figure 7. LISA maps with queen and rook contiguity Source: Own calculation and editing based on NES data, 2019
Based on the obtained Global Moran's I values, it can be stated (Tab. 4) that the degree of spatial autocorrelation varies as a function of distance. I also illustrated the effect of distances on autocorrelation for 2 distance-based weighting models (15 km, 30 km) on LISA maps (Fig. 8).
It can be stated that as the distances increase, the neighborhood relations also become more extensive, creating larger contiguous hot / cold spot units. However, we have to reckon with the fact that the settlements closer to each other are the most similar.
Figure 8. LISA maps with differenc distances Source: Own calculation and editing based on NES data, 2019
Conclusion
The aim of the study was to analyze the territorial change in the proportion and concentration of the population with higher education and the unemployed in 2001, 2011 and 2019. In the framework of the research, we sought the answer to the question of what territorial processes took place in terms of the proportion of people with higher education. I used statistical methods widely used in regional sciences to study territorial processes and inequalities.
A correlation study of the population with tertiary education and the number of the unemployed naturally showed a close positive correlation. However, the concentration of the examined spatial criteria according to the LQ indexes showed only a moderate positive correlation. The concentration of the population with tertiary education in 2011 explains only 24.4% of the concentration of the unemployed with tertiary education.
Several previous studies have shown that a slow, territorial leveling rate can be observed in the proportion of the population with tertiary education. The process of equalization of territorial inequalities for the unemployed with higher education was also confirmed by the values of the Dual Index and the Hoover Index used in the research.
Examining the graduate population and the concentration of the unemployed (LQ), I came to the conclusion that in those settlements where the concentration of the graduate population is high, the concentration of the graduate unemployed is also high. Almost all of the TOP20 settlements with the highest concentration value belong to the Budapest agglomeration. It can be stated that there was a significant increase in the proportion of the population with higher education, mainly in those spatial units where higher education institutions are located.
However, in many more settlements we find above-average concentrations in terms of unemployment. The concentration of graduate unemployed was also clustered in Budapest and its catchment area, and accumulated around the university cities (Nyíregyháza, Debrecen, Szeged, Pécs, Győr, Kecskemét) and along Lake Balaton.
I examined the percentage of graduates (Rate%) and their concentration (LQ indexes) using the Global Moran's I method. I was looking for the answer to whether weighting the raw data by different methods affects the value of Moran's I values obtained. The Moran I and Z-score values of the population and job seekers, calculated to three decimal places, were also the same for the Rate% and the Location quotient (LQ). Thus, I ultimately concluded that the I and Z values of the spatial autocorrelation are not affected by whether the data are expressed as a percentage or as a location quotient.
The spatial pattern of the ratio / concentration of the population with higher education and the unemployed was also examined with the local test f(x) function of the territorial autocorrelation with the Local Moran's I statistics. I compared the obtained results with the map of the LQ indexes in relation to the proportion of the population with higher education in 2011. If the non- concentration expressed by the LQ values is interpreted only in the range LQ <1, then the representation on the maps only allows the spatial representation of the concentration-density.
In turn the Local Moran statistics also make cold spots identifiable in addition to hot-spots; and also give an opportunity of GIS representation of spatial units with sharp contrasts.(spatial outliers: High-Low and Low-High spaces).
Global and Local Moran I statistics were also performed for the 2001/2019 graduate unemployment rate / concentration using different weight matrices. Different neighborhood matrices (the way in which neighborhood relationships are defined) influenced the Moran I
values obtained. The variables showed clustering when using the queen, rook and distance- based weight matrices, the Z value is positive in all cases, so similar values are clustered in the space. Global Moran's I values increased in all cases between 2001 and 2019, so the territorial homogeneity of some spatial units increased. The neighborhood effect has become stronger, with hot spots covering an ever-increasing area. The number of High-High settlements increased by 86 by 2019, new clusters appeared near Szeged and Székesfehérvár, and the existing clustering continued to expand. Overall, it can be stated that in 2019 the number of unemployed graduates was increase in Budapest and in the north-western counties of the country.
Based on the Global Moran's I values obtained, the research confirmed that the degree of spatial autocorrelation varies as a function of distance. As distances increase, neighborhood relationships also become more extensive, creating larger contiguous clusters. However, we have to reckon with the fact that the settlements closer to each other are the most similar.
Therefore, although the clustering settlements shown on the map cover larger spatial units, they were still associated with lower Moran's I indexes overall.
References
1. Acemoglu D. (2008): Introduction to Modern Economic Growth. Princeton University Press, New Yersey, ISBN 9781400835775
2. Aghion de B. A. – Durlauf, J. (2005): Handbook of Economic Growth. Elsevier.
Amsterdam, ISBN 9780444520418
3. Anselin L. (1995): Local Indicators of Spatial Association—LISA. Geographical Analysis. Vol. 27. No. 2. DOI: https://doi.org/10.1111/j.1538-4632.1995.tb00338.x 4. Capello R. (2007): A forecasting territorial model of regional growth: the MASST
model. The Annals of Regional Science. Vol. 41. No. 4. 753–787. p. DOI:
http://doi.org/c5wxvk; ISSN 1742-1780
5. Dusek T. (2004): A területi elemzések alapjai. In: ELTE TTK Regionális Földrajzi Tanszék, Regionális Tudományi Tanulmányok 10., Budapest.
6. Dusek T. (2013): A területi statisztika egyes térparamétereket használó elemzési eszközei. In: Széchenyi István Egyetem, Regionális- és Gazdaságtudományi Doktori Iskola, Habilitációs értekezés, Győr.
7. Dusek T. – Kotosz B. (2016): Területi statisztika. Akadémiai Kiadó, Budapest, ISBN 9789634540014
8. Egri Z. (2017): Magyarország városai közötti egészségegyenlőtlenségek. Területi Statisztika. 2017, Vol. 57. No. 5. 537–575. p. DOI: 10.15196/TS570504; ISSN 2064- 8251
9. Egri Z. – Kőszegi I. R. (2018): A gazdasági-társadalmi (komplex) térszerkezet kelet- közép-európai képe. Területi Statisztika. Vol. 58. No. 1. 27–56. p., DOI:
10.15196/TS580102; ISSN 2064-8251
10. Egri Z. – Tánczos T. (2016): Spatial Layers and Spatial Structure in Central and Eastern Europe. Regional Statistics. Vol. 5. No. 2. 34–61. p. ISSN 2064-8251
11. Gecse G. – Nikodémus A. (2003): A hazai klaszterek lehatárolásának problémái – lokációs hányados. Területi Statisztika. Vol. 6. No. 6. 507–522. p. ISSN 0018-7828 12. Hajdú D. (2020): A munkanélküliség és felnőttképzés területi eloszlása az Észak-
magyarországi régióban. Észak-magyarországi Stratégiai Füzetek. Vol. 17. No. 2. 62- 69. p. DOI: https://doi.org/10.32976/stratfuz.2020.14; ISSN 2560-2926
13. Kiss J. P. – Németh N. (2006): Fejlettség és egyenlőtlenségek – Magyarország megyéinek és kistérségeinek esete. In: Magyar Tudományos Akadémia Közgazdaságtudományi Intézet, Budapest. 40. p. ISBN 9789639588929
14. Kiss J. P. – Tagai G. – Telbisz E. (2008): A szürkeállomány területi különbségei – katedrán innen és túl. Területi Statisztika. Vol. 48. No. 3. 315–333. p. DOI:
10.15196/TS580602
15. Lengyel I. (2010): Regionális gazdaságfejlesztés. Versenyképesség, klaszterek és alulról szerveződő stratégiák. Budapest, Akadémiai Kiadó. ISBN 9789630588379 16. Nagy H. – Illes B. – Kaposzta J – Donnik I. (2017): Clusters and concentration of
businesses in regions of some european countries as tools for economic development.
In: 16th International Scientific Conference – Engineering for Rural Development.
248–253 p. DOI: 10.22616/ERDev2017.16.N048; ISSN 1691-5976
17. Nemes Nagy J. ed. (2005): Regionális elemzési módszerek. In: ELTE Regionális Földrajzi Tanszék, Budapest. (Regionális Tudományi Tanulmányok, 11.)
18. Romer, P. M. (1990): Endogenous Technological Change. Journal of Political Economy. Vol. 98. No. 5. S71–S102. p.
19. Romer P. M. (1994): The origins of endogenous growth. The Journal of Economic Perspectives., Vol. 8. No. 1. 3–22. p., DOI: http://doi.org/bbs8mn; ISSN 1944-7965 20. Sánta É – Szakálné Kanó I. – Lengyel I. (2015): Csökkennek az iskolázottság területi
egyenlőtlenségei? A felsőfokú végzettségűek területi eloszlása a népszámlálások adatai alapján. Területi Statisztika. Vol. 55. No. 6. 541-555. p.
21. Szakálné Kanó I. (2011): A gazdasági aktivitás térbeli eloszlásának vizsgálati lehetőségei. Statisztikai Szemle. Vol. 89. No. 1. 77–100. p.
22. Szakálné Kanó I. (2017): Gazdasági tevékenységek térbeli eloszlásának vizsgálata.
JATEPress, Szeged, ISBN 9789633153376
23. Szakálné Kanó I – Kazemi-Sánta É – Lengyel I. (2018): A felsőfokú végzettségűek területi eloszlásának alakulása Magyarországon. In: Lengyel I. (ed.) 2018: Térségek növekedése és fejlődése. JATEPress, Szeged, 174–196. p.
24. Tóth G (2003): Területi autokorrelációs vizsgálat a Local Moran I módszerével. Tér és Társadalom. Vol. 17. No. 4. 39-49. p. ISSN 2062-9923
25. Vas Zs. (2009): Közelség és regionális klaszterek: a szoftveripar Szegeden. Tér és Társadalom. Vol. 23. No. 3. 127–145. p. DOI: 10.17649/TET.23.3.1261.; ISSN 0237- 7683
26. Vas Zs. – Lengyel I. – Szakálné Kanó I. (2015): Regionális klaszterek és agglomerációs előnyök: feldolgozóipar a magyar városrégiókban. Tér és Társadalom.
Vol. 29. No. 3. 49-72. p., DOI: 10.17649/TET.29.3.2697.;ISSN 0237-7683
27. Varga A. (2009): Térszerkezet és gazdasági növekedés. Akadémiai Kiadó, Budapest.
ISBN 0109002625423
28. Zhang D. (2017): A Coefficient of Determination for Generalized Linear Models. The American Statistician. Vol. 71. No. 4. 310-316. p. DOI: 10.1080/00031305.2016.
1256839