SPATIAL ANALYSIS OF CERTAIN POPULATION PROCESSES IN THE DANUBE WINE REGION
Krisztián Járdány PhD student
Hungarian University of Agriculture and Life Sciences, Doctoral School of Economy and Regional Sciences,
E-mail: krisztian@borvar.hu Abstract
Bearing in mind that five of the seven priority initiatives of the Europe 2020 Strategy deal with demographic criteria, I largely think that it is important to present some of the population processes of the Danube wine region, the largest viticulture and wine region in Hungary. I have chosen 10 years between 2010-2019 as the studying period. My aim was to place the examined demographic processes in territorial dimensions and paying attention to spatial contexts. Data from secondary sources were analyzed using the Herfindahl – Hirschman index, location coefficient, and spatial autocorrelation. Studies have shown that the wine region is experiencing population decline and an aging process. However, the spatial structure of this process shows an unbalanced picture that differs from age group to age group. With the help of the methods used, a strong clustering of population process could be detected for the examined age groups.
The identified demographic trends could have a serious negative impact on several social and economic phenomena in the future, regarding the labor supply of the wineries operating in the area.
Kulcsszavak: Danube Wine Region, demography, population JEL besorolás: J11, J13
LCC:HB848-3697 Introduction
Population processes have an impact on the development of all socio-economic dimensions and play particularly important role in employment, social policy, health care and migration. Five of the seven flagship initiatives of the Europe 2020 Strategy pay special attention to the demographic dimension (Koncz, 2017). The word demography studying the composition of human groups, the processes of population and behavior consists of the Latin words demos (people) and graph (description). According to contemporary records, about 4,000 years ago, the Chinese were also involved in formulating population characteristics. (L. Rédei, 2006).
Every society is made up of members of a given population, and the quantitative and qualitative characteristics of that population influence social processes. Demography and population processes are dealt with in the science of demography (Andorka, 2006). The demographic science is related to several different social spheres. On the one hand, this is related to the fact that one examines man in his versatility, time, and space, and on the other hand, its conclusions can be directly interpreted in several disciplines. (L. Rédei, 2006). There are four phenomenas for the primary subject of traditional demography: fertility, mortality, international migration, internal migration [Kapitány (ed.), 2015]. One of the basic characteristics of the development of population processes is the natural reproduction or depopulation. The increases or decreases of the population can be characterized by the number of births and deaths and their differences, ignoring the migration process (Lados, 2014). Reproduction can be calculated from fertility and mortality, meaning “reproduction” of the population, i.e., how the number and composition of
the population develop in the long run under the combined effect of mortality and fertility (Andorka, 2006). In Hungary, two types of population are distinguished during censuses.
Accordingly, I can speak of a permanent population and a resident population (Andorka, 2006).
The permanent population includes persons who mark a given territorial unit as their place of residence. Resident population refers to the totality of people who report only one address as their home address and have no place to live elsewhere; and persons who have only a place of residence. In most Hungarian settlements, it is typical that the number of the resident population is higher than that of the permanent one (L. Rédei, 2006). A well-known concept in demography is also the census resident population, also known as the actual population. This concept covers persons whose only place of residence is the place of the census or, if they have more than one place of residence, the place of the census is a way of life (Bajmócy, 2007). In Hungary, after the change of regime, a gradual change in demographic patterns were observed (Spéder, 2006), which manifested itself in the approach to Western European countries and in the field of family formation and childbearing. Youth childbearing has declined, and with it the age of mothers’
first childbearing has shifted. Population decline and aging are due to a combination of childbearing, mortality, and the international migration balance (Obádovics, 2018).
The spatial development of demographic changes is nuanced by the volume of territorial capital.
An important aspect in internal migration is the possibility of employment. Spatial units with higher employment potential are more attractive to the population. This is especially evident in agglomeration zones, where territorial capital is higher, and productivity is higher. Overall, higher regional output results in higher income levels, so these spatial units have a better ability to attract population (Zsibók, 2020).
Comparison over time is a key issue in the territorial analysis of demographic indicators. Spatial mergers, and thus the spatial increase in the level of analysis, also mean the homogenization of spatial characteristics. The average value obtained for larger territorial units also includes a regional variation for a significant internal unit. The principle of territorial 'encapsulation' requires that the units do not overlap and form, as far as possible, a coherent regional unit. This may make the analysis possible in the case of any territorial division (L. Rédei, 2006). One of the basic questions of regional science is how similar or different the appearance of a phenomenon on a given territorial unit is compared to the values of neighboring territorial units.
Based on the quantification of the similarities, conclusions can be drawn about the spatial correlation system of the studied phenomenon and its nature (Tóth, 2014).
The aim of the paper is to present the changes of certain demographic processes in the Danube Wine Region between 2010-2019, with special regard to the spatial connections and regional differences.
Material and method
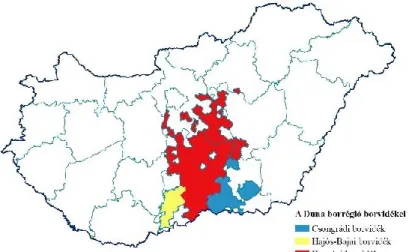
The examined territorial unit is the Danube Wine Region located in the Great Plain. Most of its territory is in the Southern Great Plain region, and a smaller part in the Central Hungarian region, with 1 settlement belonging to the wine region (which joins the wine region as an exclave) in the Northern Hungary region and 9 in the south-western part of the Northern Great Plain region. (Figure 1). The Danube Wine Region consists of three wine subregions according to 127/2009. (IX. 29.) of the Ministry of Agriculture and Rural Development: Csongrád, Hajós- Baja and Kunság wine subregions (wine subregion: the totality of the settlements listed in the demarcated production area chapter in the Protected Designations of Origin (PDO) product descriptions)
Figure 1: Location of the wine subregions (PDOs) of the Danube Wine Region in Hungary
Source: own calculation and construction based on DSPIS data, 2021
There are a total of 147 settlements in the area, of which 111 settlements (75.5%) are in the Kunság wine subregion, 19 settlements (12.9%) in the Csongrád wine subregion, and 17 settlements (11.6%) in the Hajós-Baja wine subregion. In 2019, 28.81% of the wineries with a wine production license registered in Hungary, 2130, are in the Danube Wine egion. 90%
(1917) of these wineries are in the Kunság, 7.9% (168) in the Hajós-Baja and 2.1% (45) in the Csongrád wine region. During the preparation of the dissertation, I conducted secondary research, based on several Hungarian and international literature related to the topic and methodology. After learning about these, I processed the public information obtained from the website of the Government Office of Pest County (GOPC), the databases of the Regional Development and Spatial Planning Information System (DSPIS) and the databases of the Hungarian Central Statistical Office (HCSO) for the period 2011-2019. The collected data are processed and evaluated in ArcGIS 10.6.1. software. I used several mathematical-statistical methods for the deeper analysis related to the population processes of the studied area, as well as for the measurement of the spatial concentration of the variables. I combined these methods with each other. In the first step, I used the Herfindahl – Hirschman Index (HHI) to measure the spatial distribution of the resident population. The HHI was calculated for the resident and permanent population of the study area, and for 2010 and 2019 I also applied the method to three cohorts of the permanent population (0-19; 20-64; 65+). The Herfindahl – Hirschman index shows the degree of concentration of a natural variable between territorial units (eg municipality, district, county, region).
𝐻𝐻𝐼 = ∑
𝑛
𝑖=1
𝑉𝑚𝑖2
where n is the number of elements, Vmi is the area fraction of the i-th natural variable. The index decreases with equalization of the spatial concentration of the studied variable and reaches its minimum value when the studied phenomenon is evenly distributed among the territorial units. Maximum value when the phenomenon is concentrated in one area. The minimum of the indicator depends on the development of the number of elements (Kozmarek, 2012). Given that the HHI data from the above formula took very small values, I reported the square value of a hundred times the ratio of the indicators included in the calculation for the easier interpretation. In my case, the number of examined elements is n = 147, the corresponding minimum HHI, i.e. the value for a completely uniform distribution: 68.03. To
examine the spatial density analysis of demographic data obtained from secondary databases, I calculated location quotients (LQ) for 2010 and 2019 at the settlement level for the 0-19, 20- 64, and 65+ age groups of the permanent population. The location quotient can be calculated using several basic data (Vas et al, 2015). From the obtained value I can deduce the degree of concentration of a social or economic phenomenon observed in the studied area.
𝐿𝑄 = (𝐸𝑖𝑗
𝐸𝑗) (𝐸𝑖𝑛
𝐸𝑛)
In the present dissertation, Eij is the population of age i in settlement j, Ej is the population of j settlement, Ein is the total population in age group i in the Danube Wine Region, En is the total population in the Danube Wine Region. I can talk about concentration if the value of the location quotient is greater than 1 (Patik and Deák, 2005). In this case, I can conclude a higher geographical concentration of the measured phenomenon compared to the totality of the examined territorial unit. I determined the following concentration levels based on the calculated LQ values: LQ <1: no concentration, LQ 1.01 - 1.25: moderate concentration, LQ 1.26 - 1.5: medium concentration, LQ> 1.5: strong concentration.
In the case of some data obtained from secondary sources, and using the calculated LQ values, I performed a spatial autocorrelation study using Local Moran statistics to explore the spatial correlation system.
𝐼 = 𝑛 2𝐴
∑𝑛𝑖=1 ∑𝑛𝑗=1 𝛿𝑖𝑗(𝑦𝑖 − 𝑦)(𝑦𝑗− 𝑦)
∑𝑛𝑖=1 (𝑦𝑖− 𝑦)2
where n is the number of area units, yi and yj are the values of the examined variable in each area unit, ▁y is the arithmetic mean of the examined indicator, A is the number of neighborhood relations, and the value of δij is 1 if i and j are adjacent, otherwise n is indicating the number of items (Tóth, 2014). If I> –1 / n – 1, then the autocorrelation relationship is positive, if I <–1 / n – 1, then the autocorrelation relationship is negative. If I = –1 / n – 1, there is no autocorrelation relationship between the individual territorial units (Egri, 2017). To describe the spatial patterns, I used the local test function of spatial autocorrelation, the univariate Local Moran I method developed by Anselin in 1995. This method is suitable for detecting areas that are similar or different from their neighbors (Tóth, 2014). The formula for Local Moran I is:
𝐼𝑖,𝑡 = 𝑧𝑖,𝑡∑𝑖𝑊𝑖𝑗𝑧𝑗,𝑡
where zi,t and zj,t are the standardized values of the observation units at time t. For a univariate Local Moran, zi,t and zj,t, t refer to the same database. Wij is the area weight matrix (Anselin, 1995). The obtained result classifies the settlements into four groups:
1. High–High: area units with a high value, where the neighborhood also has a high value.
2. High–Low: area units with a high value, where the neighborhood has a low value.
3. Low–Low: area units with a low value, where the neighborhood also has a low value.
4. Low–High: area units with a low value, where the neighborhood has a high value.
(Tóth 2014, Egri 2017).
I determined the significance filter of the local Moran below 0.05 and the number of permutations in 499.
Results
Figure 2: Territorial distribution and clustering of wineries in the Danube Wine Region Source: own calculation and construction based on GOPC data, 2021
The spatial distribution of wineries in the wine region is uneven. The density of the region’s wineries extends to the area of the Kiskőrös district, including the Kiskőrös and Soltvadkert centers (Figure 2). The 0.428 Moran index (z-value = 10.98, p = 0) obtained during the spatial autocorrelation study on the number of wineries showed a positive autocorrelation and confirmed the presence of high-high clustering related to the location of wineries in the Kiskőrös district. In addition, a remarkable low-low clustering was detected in the Csongrád wine subregion of the wine region, as well as in the south-eastern quarter of the Kunság wine subregion. Demographic analyzes are carried out primarily considering the clusters identified.
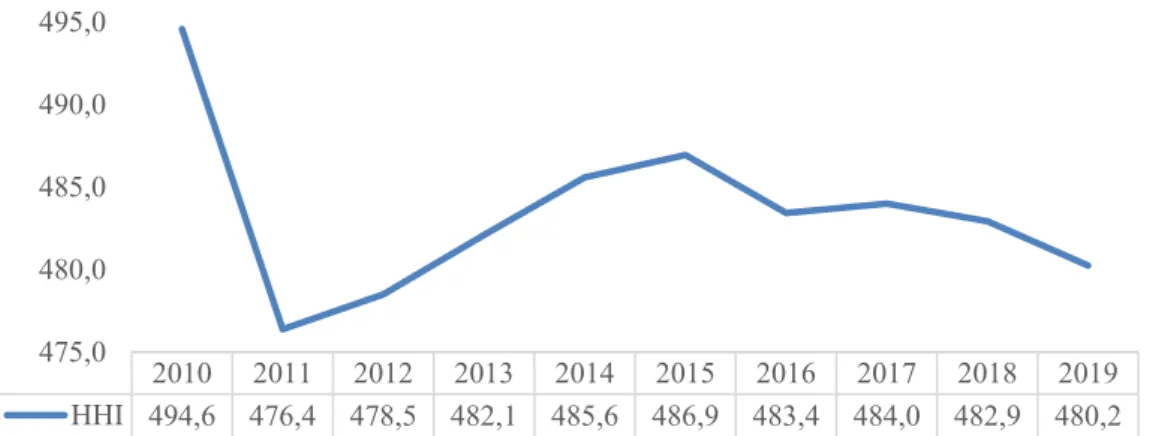
In the Danube Wine Region, the resident population decreased by 3.44% from 1,053,274 in 2010 to 46,819 in 2019. However, in addition to this decrease, a small but trend-like territorial equalization process can be detected according to the annual HHI values calculated to measure the spatial distribution of the resident population (Figure 3).
Figure 3: Changes in the HHI values of the residential population in the Danube Wine Region between 2010 and 2019
Source: own calculation and construction based on DSPIS data, 2021
2010 2011 2012 2013 2014 2015 2016 2017 2018 2019 HHI 494,6 476,4 478,5 482,1 485,6 486,9 483,4 484,0 482,9 480,2 475,0
480,0 485,0 490,0 495,0
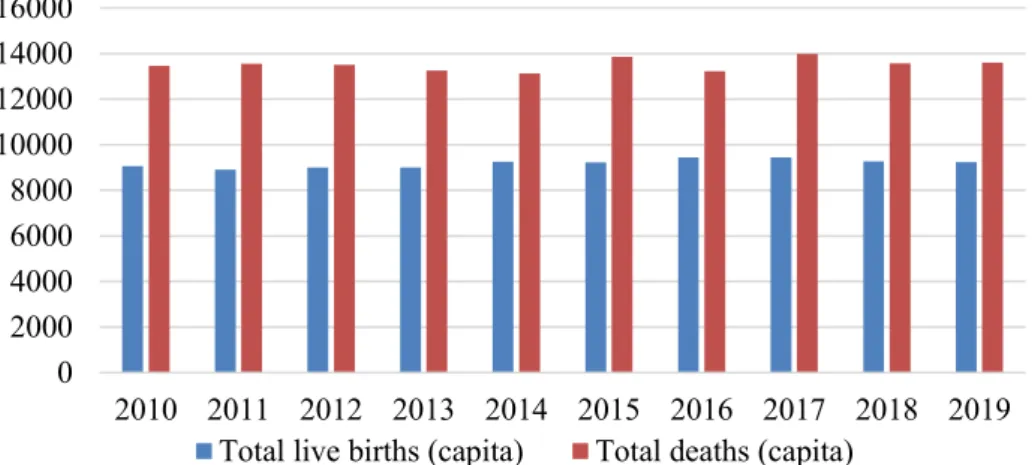
The clear explanation for the population declines between 2010 and 2019 is that the number of births remains below the number of deaths from year to year (Figure 4), as 43,301 fewer births were registered in the settlements of the Danube Wine Region than deaths in the ten years studied. As the domestic migration balance took on an additional value of 111, the remaining decrease of 3,629 can be explained by the negative international migration balance affecting the area.
Figure 4: S Birth and deaths in the Danube Wine Region, 2010-2019 Source: own calculation and construction based on DSPIS data, 2021
The change of the resident population between 2010 and 2019 occurred in different proportions in the settlements of the studied area (Figure 5). The spatial autocorrelation analysis based on the calculated data gave a clearly positive autocorrelated area at a strong significance level with I = 0.23, z = 7.670, p = 0 values. The results show that the population clearly increased around Budapest and in the south-eastern catchment area of Kecskemét during the study period, while a large population decline cluster was measurable in the less urbanized areas south of Soltvadkert and further from the agglomeration of large cities. The biggest loser of the wine region in terms of population change is the Hajós-Baja wine subregion, in which nearly two- thirds of the area has been depopulated.
Figure 5: Extent (%) of the change in the resident population and the territorial autocorrelation analysis of the change in the Danube Wine Region, 2010-2019 Source: own calculation and construction based on DSPIS data, 2021
0 2000 4000 6000 8000 10000 12000 14000 16000
2010 2011 2012 2013 2014 2015 2016 2017 2018 2019 Total live births (capita) Total deaths (capita)
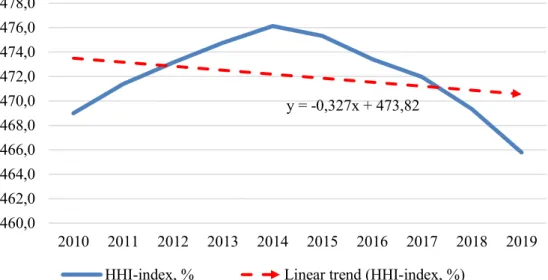
The permanent population of the wine region decreased by 1.91% between 2010 and 2019, which means 20,146 people. For this indicator, the rate of decline is nearly half the rate of decline in the resident population. The HHI values calculated in the context of the resident population are also trend-like for this variable and suggest only a small degree of territorial equalization (Figure 6).
Figure 6: Change in the HHI values of the resident population between 2010 and 2019 in the Danube Wine Region
Source: own calculation and construction based on DSPIS data, 2021
Examining the change in the age composition of the permanent population, it was found that except for the 40-49 age group and the age group over 59, the share of those belonging to other age groups decreased for both men and women (Figures 7 and 8). The extent of the change is illustrated in Table 1.
Figure 7: Age tree of the permanent population in the Danube Wine Region, 2010 (persons)
Source: own construction based on DSPIS data, 2021
y = -0,327x + 473,82
460,0 462,0 464,0 466,0 468,0 470,0 472,0 474,0 476,0 478,0
2010 2011 2012 2013 2014 2015 2016 2017 2018 2019 HHI-index, % Linear trend (HHI-index, %)
74 366 31 032 67 310 83 477
68 784 79 814
35 982 108 713
78 470 32 594
69 601 87 550 70 790 72 399 29 434 62 958
0-14 15-19 20-29 30-39 40-49 50-59 60-64 65+
Women Men
Figure 8: Age tree of the permanent population in the Danube Wine Region, 2019 (persons)
Source: own construction based on DSPIS data, 2021
Table 1: Age Groups number of changes in the Danube Wine Region in 2010-2019 between
Age Women Men Total
0-14 -2,9% -2,9% -2,90%
15-19 -18,3% -18,3% -18,29%
20-29 -11,2% -9,1% -10,13%
30-39 -20,4% -19,1% -19,75%
40-49 20,1% 23,4% 21,78%
50-59 -16,4% -9,4% -13,10%
60-64 4,3% 7,9% 5,93%
65+ 13,9% 22,4% 17,02%
Source: own construction based on DSPIS data, 2021
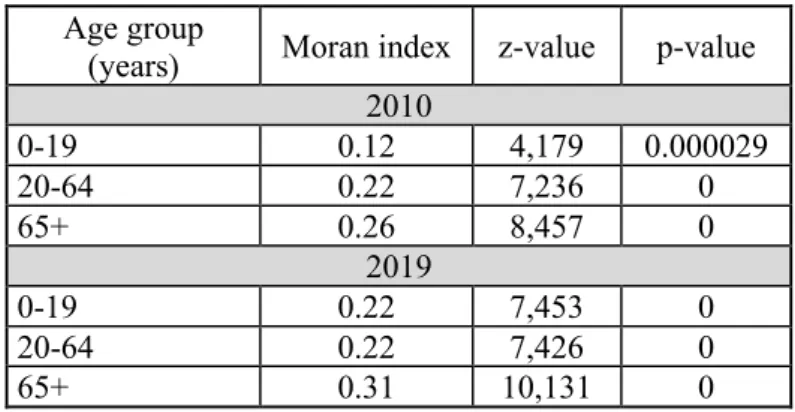
Within the permanent population, the HHI for the 0-19 age group increased from 434.51 to 431.49 between 2010 and 2019, and the HHI for the 20-64 age group decreased from 485.28 to 469.17. However, the HHI for the 65+ age group increased from 455.24 to 495.11 over this period. Thus, inequality in the spatial distribution of age groups younger than 65 years decreased slightly, while inequality in the spatial distribution of age groups older than 64 years increased. Based on the change in the territorial concentration of the above three age groups, both examined years showed a strong positive value in the examined period and for each examined age group (Table 2).
Table 2: spatial autocorrelation values of location quotients (LQ) by age group Age group
(years) Moran index z-value p-value 2010
0-19 0.12 4,179 0.000029
20-64 0.22 7,236 0
65+ 0.26 8,457 0
2019
0-19 0.22 7,453 0
20-64 0.22 7,426 0
65+ 0.31 10,131 0
Source: own calculation
72 201 25 362 59 768 66 417 82 617
66 706 37 546 123 810
76 203 26 628
63 271 70 840
87 359 65 567 31 748
77 085
0-14 15-19 20-29 30-39 40-49 50-59 60-64 65+
Women Men
Each of the results obtained is significant at the p <0.001 level, there is less than a 0.1%
probability that the results are due to randomness.
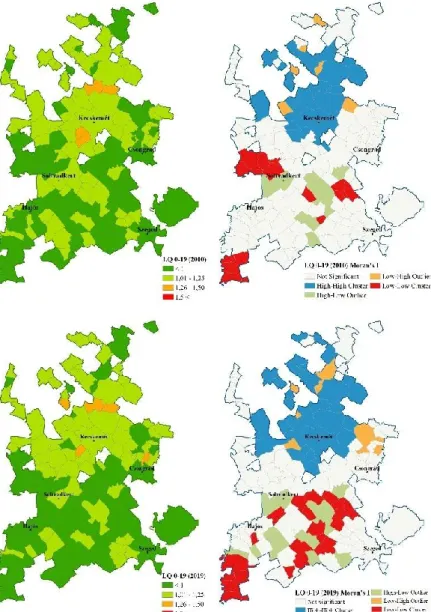
Figure 9: LQ values of the 0-19 age group per settlement and their territorial autocorrelation in 2010 and 2019 in the Danube Wine Region
Source: own calculation and construction based on DSPIS data, 2021
Based on the settlement-level LQ values of the 0-19 age group in 2010 and 2019, it can be stated that the members of the age group did not appear at a high concentration level in the examined area either in 2010 or 2019. LQ20100-19min= 0.717; LQ20100-19max= 1.313;
LQ20190-19min= 0.555; LQ20190-19max= 1.337 (Figure 9). The territorial autocorrelation study showed that in the examined period the territorial concentration of the 0-19 age group strengthened in the Kecskemét catchment area and expanded towards Budapest. The decrease in concentration was mostly measured in the Hajós-Baja wine subregion of the wine region and southeast of the town of Soltvadkert, where we can observe the widening and appearance of Low-Low clusters. It is noteworthy that the settlements of Soltvadkert and Kecel maintained their high-low outlier position in the spatial structure, even though their environment underwent a significant change in terms of the examined indicator.
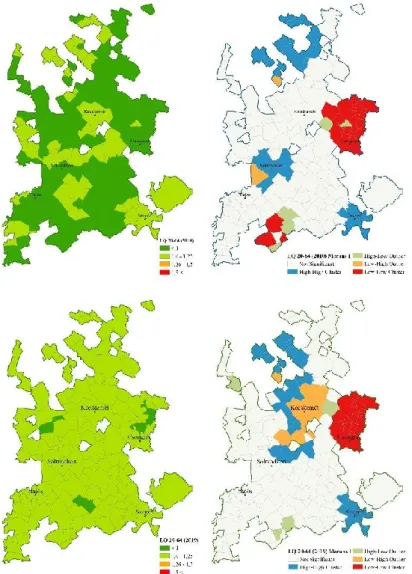
According to the LQ values of the 20-64 age group, which is the most relevant for the labor market, no strong concentration was detected in the wine region, but not even a moderate one (Figure 10).
Figure 10: LQ values per settlement of the 20-64 age group and their territorial autocorrelation in 2010 and 2019 in the Danube Wine Region
Source: own calculation and construction based on DSPIS data, 2021
However, examining the LQ values (and the HHI values for the 20-64 age group), it can be concluded that a territorial equalization took place for the age group, while the average age of the age group increased. LQ201020-64min=0.857; LQ201020-64max=1.068; LQ201920- 64min=0.912; LQ201920-64max=1.101. According to the regional autocorrelation results, the high-high cluster of the age group concentration disappeared from the Kiskőrös subregion and from the catchment area of Budapest in the northernmost areas of the wine region during the ten years examined. At the same time, a high-high cluster developed in the agglomeration of the city of Kecskemét, while in the cities of Nagykőrös and Kecskemét, and in the southern catchment area of the latter, a low-high outlier appeared. The low-low cluster measured in the area east of Kecskemét and north of Csongrád narrowed away from Kecskemét, and a high-low outlier appeared in Szentkirály. Deconcentration can be observed in the Csongrád wine region in the most important age group from the point of view of the labor market.
LQ extreme values for the age group of 65 years and older: LQ 2010 65+ min = 0.857; LQ 2010 65+ max = 1,584; LQ 2019 65+ min = 0.597; LQ 2019 65+ max = 1.497 (Figure 11).
Figure 11: LQ values of the 65+ age group per settlement and their territorial autocorrelation in 2010 and 2019 in the Danube Wine Region
Source: own calculation and construction based on DSPIS data, 2021
Territorial autocorrelation calculated using LQ values showed that high-high clustering appeared in the southern areas of the Kunság wine subregion of the wine region during the study period. In the Hajós-Baja wine subregion, the high-high cluster, which already existed in 2010, expanded almost entirely to the territory of the wine region. In the eastern outcrop of the Kunság wine region bordering the Csongrád wine region, this cluster has narrowed strongly.
The low-low clustering changed towards the southern agglomeration of Kecskemét.
Conclusions
Based on the indicators calculated from the demographic data between 2010 and 2019, the decrease in the resident population, both in proportion and in nominal terms, significantly exceeded the decrease in the permanent population in the Danube Wine Region. From this I can conclude that I am facing an intensive population decline process in the studied spatial unit.
This process could have serious negative effects on many social and economic phenomena in the long run, especially regarding labor supply. The areas most affected in this respect are
located south of the horizontal center line of the wine region. Significant population decline is exacerbated by the aging trend. This not only delays the biological reproduction of society, but also leads to a shortage of workers in the rural agricultural areas of the wine region, who typically perform manual labor, moderately heavy or heavy physical work. These demographic trends can clearly have a negative impact on the labor-intensive viticulture of the study area.
The applied methods were used to explore clusters within the wine region where the permanent population is growing. All of these occurred either in a metropolitan area or in a county town and agglomeration, in areas further away from the wine region’s wine-growing and winemaking center. It should be noted that the results of the spatial autocorrelation study of the LQ values of the 0-19 age groups also support the study of population change.
My conclusions are that the young generation living or growing in these spaces and socializing in urban subculture cannot be considered as a future human resource available either in agriculture or in the viticulture of the wine region. Based on the obtained data, the Danube Wine Region was divided into two parts along the Dunapataj - Pálmonostora axis in terms of population processes. In areas further north, the decline in demographics paints a much more moderate picture than population decline trends in areas further south of the imaginary axis.
This fact could severely affect the wine sector, as the supply of human resources to be employed in viticulture may dwindle. A significant proportion of the wine region's vineyards are in the southern areas of the wine region.
According to my research, the higher-than-average rate of population decline in the Hajós-Baja wine region and the under-representation of the 0-19 age group and the 65+ age group are because cities with higher labor absorption capacity relatively closer to the wine region for the elderly population.
The more even concentration indicators of the 20-64 age group compared to the other age groups are also since members of this age group are less “lump-bound” and more socially and economically mobile, easier to change their place of residence or work for a more stable existential background.
The willingness to move in the 65+ age group is low, which can be traced back to several reasons. On the one hand, they are typically inactive from the labor market point of view, and on the other hand, their clustering has been shown in rural areas where income levels from smaller territorial capital can be a barrier to migration to more developed regions. This factor also makes it difficult for the 20-64 age group to find mobility. It should also be mentioned that with age, local patriotism also becomes more and more important in the subjective value judgment of the individual.
References
1. ANDORKA R. (2006): Bevezetés a szociológiába. Osiris Kiadó, Budapest, 786 p.
ISBN: 9789633898482
2. ANSELIN, L. (1995): Local Indicators of Spatial Association − LISA Geographical Analysis 27 (2): 93–115.
3. BAJMÓCY P. (2007): A népességszám változás települési és megyei szintű egyenlőtlenségeinek néhány mérési lehetősége Magyarországon. Tér és Társadalom.
2007 (1) pp. 85–102.
4. EGRI Z. (2017): Magyarország városai közötti egészségegyenlőtlenségek. In: Területi Statisztika, 57 (5): pp. 537–575; DOI: 10.15196/TS570504
5. KAPITÁNY B. (szerk.) (2015): Demográfiai fogalomtár. KSH Népességtudományi Kutatóintézet, Budapest, 7., 15. o. ISBN 9789639597365
6. KOMAREK L. (2012): A magyar ipar makroszintű specializációjának kérdései. PhD értekezés. Nyugat-magyarországi Egyetem Közgazdaságtudományi Kar Széchenyi István Gazdálkodás- és Szervezéstudományok Doktori Iskola, Sopron, pp. 89.
7. KONCZ G. (2017): Demográfiai folyamatok és humán erőforrások Észak- Magyarország vidéki térségeiben In: Koncz, Gábor (szerk.) Mérföldkövek a gyöngyösi agrárkutatásban. Gyöngyös, Magyarország: Károly Róbert Kft. 81 p. pp.
75-81., 7 p.
8. L. RÉDEI M. (2006): Demográfiai ismeretek. RegInfo Kft, Budapest, 248 p.
9. LADOS M. (szerk.) (2014): A gazdaságszerkezet és vonzáskörzet alakulása.
Universitas Győr Nonprofit Kft, Győr, 279 p.
10. OBÁDOVICS Cs. (2018): A népesség szerkezete és jövője. In: MONOSTORI J. – ŐRI P. – SPÉDER Zs.: Demográfiai Portré, 2018. KSH NKI Bp., pp. 271-294.
11. PATIK R. – DEÁK SZ. (2005): Regionális klaszterek feltérképezése a gyakorlatban.
In: Tér és Társadalom, 3–4., pp. 139–170. DOI: 10.17649/TET.19.3-4.1023
12. SPÉDER Zs. (2006): Mintaváltás közben. A gyermekvállalás időzítése az életútban, különös tekintettel a szülő nők iskolai végzettségére és a párkapcsolati státusára.
Demográfia, 2006. 43. évf. 2-3. pp. 113-149.
13. TÓTH G. (2014): Térinformatika a gyakorlatban közgazdászoknak. Miskolci Egyetem, Miskolc. 107 p. ISBN 9789633580592
14. VAS ZS., LENGYEL I., SZAKÁLNÉ KANÓ I. (2015): Regionális klaszterek és agglomerációs előnyök: feldolgozóipar a magyar városrégiókban. In: Tér és Társadalom (29) 3, pp. 49-72. DOI:10.17649/TET.29.3.2697
15. ZSIBÓK ZS. (2020): A nemzeti szintű bruttó hazai termék regionális leskálázása rendszerdinamikai keretben. In: Tér, Gazdaság, Ember 8:(3) pp. 9-26.