Mobile gaming and problematic smartphone use: A comparative study between Belgium and Finland
OLATZ LOPEZ-FERNANDEZ1,2*, NIKO MÄNNIKKÖ3, MARIA KÄÄRIÄINEN4,5, MARK D. GRIFFITHS1and DARIA J. KUSS1
1International Gaming Research Unit, Psychology Department, Nottingham Trent University, Nottingham, UK
2Laboratory for Experimental Psychopathology, Institut de recherche en sciences psychologiques, Université catholique de Louvain, Louvain-La-Neuve, Belgium
3Department of Social Services and Rehabilitation, Oulu University of Applied Sciences, Oulu, Finland
4Research Unit of Nursing Science and Health Management, Oulu University Hospital, University of Oulu, Oulu, Finland
5Research Unit of Nursing Science and Health Management, Oulu University Hospital, Oulu, Finland
(Received: August 7, 2017; revised manuscript received: November 5, 2017; second revised manuscript received: November 24, 2017;
accepted: November 27, 2017)
Background and aims:Gaming applications have become one of the main entertainment features on smartphones, and this could be potentially problematic in terms of dangerous, prohibited, and dependent use among a minority of individuals. A cross-national study was conducted in Belgium and Finland. The aim was to examine the relationship between gaming on smartphones and self-perceived problematic smartphone use via an online survey to ascertain potential predictors.Methods:The Short Version of the Problematic Mobile Phone Use Questionnaire (PMPUQ-SV) was administered to a sample comprising 899 participants (30% male; age range: 18–67 years).Results:Good validity and adequate reliability were confirmed regarding the PMPUQ-SV, especially the dependence subscale, but low prevalence rates were reported in both countries using the scale. Regression analysis showed that downloading, using Facebook, and being stressed contributed to problematic smartphone use. Anxiety emerged as predictor for dependence.
Mobile games were used by one-third of the respective populations, but their use did not predict problematic smartphone use. Very few cross-cultural differences were found in relation to gaming through smartphones.Conclusion:Findings suggest mobile gaming does not appear to be problematic in Belgium and Finland.
Keywords:problematic mobile phone use, mobile gaming, dangerous smartphone use, prohibited smartphone use, smartphone dependence, cross-cultural study
INTRODUCTION
Interacting with mobile devices (e.g., smartphones and tablets) has now become strongly embedded in contempo- rary societies across the world as many different types of activity can now be engaged in (e.g., gaming, gambling, and social networking). Over the past two decades, the use of mobile technologies has evolved to comprise a set of behaviors that have become ubiquitous in people’s daily lives, especially for youth (Hoffner, Lee, & Park, 2016;
Okazaki, Skapa, & Grande, 2008). Smartphone gaming has been one form of popular mobile entertainment engaged in on a variety of devices, accounting for more than 42% (i.e., 32% for smartphones and 10% for tablets) of the global games market (i.e., 47% Asia-pacific, 25% North America, 24% Europe, Middle-East and Africa, and 4%
Latin-America; Newzoo, 2017). Given rapid developments in mobile technology, smartphone gaming requires an in-depth exploration to ascertain factors that may contribute to problematic use.
Mobile games are video games played online via a mobile device, and are particularly popular when
downloaded for free (e.g.,“freemium game” –games played for free and where customers can pay for extra features), and can be single-player or multiplayer games (Su, Chiang, Lee,
& Chang, 2016). Moreover, the social elements of most mobile games are major features in current digital gaming because social networking sites (SNSs) are successfully integrated and used across many gaming platforms. Some studies have focused on gaming through smartphones, especially in Asia (Lee, 2017;Su et al., 2016). In contrast, Europe represents a quarter of the global games market, according to the Global Games Market Report (Newzoo, 2017), with 78% of European mobile gamers playing free- mium games (Deloitte, 2015). According to a Deloitte (2014) report, mobile games represent one of the fastest
* Corresponding author: Olatz Lopez-Fernandez, PhD; Depart- ment of Psychology, Nottingham Trent University, 50 Shakespeare Street, Nottingham NG1 4FQ, UK; Laboratory for Experimental Psychopathology, Université catholique de Louvain, 10 Place du Cardinal Mercier, Louvain-La-Neuve 1348, Belgium; Phone:
+44 115 848 2977; E-mails: olatz.lopez‑fernandez@ntu.ac.uk;
lopez.olatz@gmail.com
This is an open-access article distributed under the terms of theCreative Commons Attribution-NonCommercial 4.0 International License, which permits unrestricted use, distribution, and reproduction in any medium for non-commercial purposes, provided the original author and source are credited, a link to the CC License is provided, and changes–if any–are indicated.
DOI: 10.1556/2006.6.2017.080 First published online January 8, 2018
growing sectors of the mobile application industry in Europe. Europeans have adopted mobile games, which have become the most downloaded applications (“apps”) on smart- phones. Similarly, a study conducted by the Entertainment Software Association (ESA, 2015) stated gaming has partly shifted from being console and PC-based to being multi- platform and cross-platform (i.e., video games with an online component allowing gamers to use different hardware). This study uses data from the Tech Use Disorders (TUD, 2017) project, a prospective study involving a panel of European adults followed since 2014 exploring problematic mobile phone use (PMPU) in Belgian and Finnish smartphone users, because these two countries had not been studied before in such a context (Deloitte, 2015), despite having a couple of the highest prevalence rates in mobile phone technology usage (International Telecommunication Union [ITU], 2015).
Belgium and Finland do not differ in mobile phone use.
According to the ITU (2015), between 2007 and 2015, mobile-broadband subscriptions increased 12-fold from 4% to 47% globally. In 2014, the Belgian mobile-broadband penetration was 34%, and mobile social media 36% (Euro- pean Digital Landscape, 2014). Furthermore, the ITU has recently ranked Finland and Belgium among the higher scoring nations in the Information and communication technologies Development Index (IDI) in Europe, with Finland ranking 11th (IDI=8.08) and Belgium 15th (IDI=7.83) of 40 countries. In Europe, Finland and Belgium are among the countries with the highest active mobile-broadband subscriptions per 100 inhabitants, which refer to the sum of these types of standard and dedicated subscriptions through handset-based or computer-based (USB/dongle) devices covering actual subscribers. In 2015, Finland had 144.1 and Belgium 66.6 active mobile-broadband subscriptions (see ITU, 2016, pp. 224– 225, 255). Similarly, the Global Consumer Survey (Deloitte, 2014) reported that 65% of the Finnish population had a smartphone, 29% of Finnish smartphone owners played games on their phone weekly, and the highest penetration was found among 18- to 24-year-old adults. According to the Finnish Player Barometer (Mäyrä, Karvinen, & Ermi, 2016), the proportion of Finnish players playing mobile games at least once a month had increased significantly from 2011 to 2015 (from 21% to 37%). Another survey by the Interactive Software Federation of Europe [ISFE] (2012a) reported that 53% of the Belgian online population aged between 16 and 64 years had played any video game in the past 12 months, with 26% playing weekly. In addition, Belgian respondents reported playing different types of games (e.g., downloaded games [23%], gaming apps [15%]) with one in five (19%) using mobile devices to play (i.e., 14%
smartphones, 10% tablets, and 3% iPods). Similarly, the ISFE (2012b) reported 60% of the Finnish online population aged 16–64 years had played video games last year, with 25%
playing weekly. Furthermore, Finnish respondents reported playing downloaded games (31%), gaming apps (24%), with one in three (31%) using mobile devices to play (i.e., 25%
smartphones, 13% tablets, and 2% iPods).
Despite the many benefits of mobile phones to users, it has been reported primarily by South Korean and Chinese researchers (Bae, 2017;Jeong, Kim, Yum, & Hwang, 2016;
Lee, Chang, Lin, & Cheng, 2014; Lee, Lee, & Lee, 2016;
Liu, Lin, Pan, & Lin, 2016) that there can be a negative side of smartphone usage, arguing that compulsive use of smart- phones can arise from a person’s individual characteristics and the device’s structural characteristics. First, related to users, specific psychological traits (e.g., social anxiety and lower self-control), higher stress and technostress (i.e., distress associated with problematic smartphone use), high frustration and impatience without a smartphone (e.g., irritation and fear of group exclusion) have shown to be associated with potential problematic smartphone use (Lee et al., 2014). Structural characteristics, e.g., near- misses (i.e., where gamers just miss leveling up) in the smartphone gameCandy Crushhave been shown to be more arousing than losses (i.e., where gamers do not come close to leveling up), and are the most frustrating of all outcomes, triggering the highest urge to continue playing (Larche, Musielak, & Dixon, 2017). Furthermore, smartphone con- tent (i.e., SNS, gaming, or other information and entertain- ment-related apps) and patterns of use (i.e., frequency of smartphone use on weekdays and weekend days) have also been related to problematic smartphone use (Bae, 2017;
Jeong et al., 2016; Lee et al. 2016; Liu et al., 2016).
Therefore, both internal and external factors appear to be associated with problematic smartphone use. To date, most studies in this area have assessed problematic smartphone use in adolescents rather than adults. However, problematic smartphone use among adults can include a wider range of activities that can be interfered with (e.g., driving, full-time work rather than education, and long-term relationships) because of the smartphone’s immersive properties. Conse- quently, further research is needed to study the effects of problematic smartphone uses by adults, such as gaming through smartphones.
Currently, PMPU has been theoretically defined as a heterogenic potential behavioral disorder associated with a number of different problems, such as dangerous use (i.e., use in risky situations, such as driving), prohibited use (i.e., using smartphones in venues where they are banned, such as in public places like libraries or theaters), and dependent use (i.e., having an excessive need for using smartphones, such as constantly checking notifications).
The latter can include addiction-like symptoms (Billieux, 2012, Billieux, Maurage, Lopez-Fernandez, Kuss, &
Griffiths, 2015; Kanjo, Kuss, & Ang, 2017), which can include core components of addiction, including cognitive salience, loss of control, mood modification, tolerance, withdrawal, conflict, and relapse (Griffiths, 1995,2005) as well as associated psychological and/or behavioral conse- quences (e.g., compulsion, negative consequences, and functional impairment; Lee et al., 2016; Liu et al., 2016).
PMPU is a multifaceted condition requiring further research into users’ smartphone activities, including mobile games, as these may contribute to experiencing problems and addiction-like symptoms (Griffiths & Szabo, 2014), highlighting another gap in knowledge that this study aims to address. It has also been demonstrated excessive smart- phone gaming can lead to detrimental health effects for a small minority of users, including depression, anxiety, stress, worse mood, specific personality disorders, and low self- control (Cheever, Rosen, Carrier, & Chavez, 2014; Jeong et al., 2016;Thomée, Härenstam, & Hagberg, 2011), as well
as dependence-like symptoms (Billieux, Van der Linden, &
Rochat, 2008; Cheng & Leung, 2016; Km, Park, & Lee, 2011;Kwon et al., 2013).
A study by Roberts, Yaya, and Manolis (2014) surveyed a convenience sample of 164 North American undergrad- uates to investigate which mobile phone activities (e.g., playing games and social networking) were associated with mobile phone addiction, but did notfind that playing mobile games was a predictor. Another study highlighted that high engagement across a wide range of video game genres (e.g., casual, shooter, and sport games), referred to as
“gaming versatility” (e.g., the number of different video game genres engaged in), is one of the risk factors for gaming addiction (Donati, Chiesi, Ammannato, & Primi, 2015). Game genres, such as the popular massively multi- player online role-playing games (MMORPGs), are poten- tially considered more addictive than other gaming genres (e.g.,Dauriat et al., 2011;Kuss, Louws, & Wiers, 2012), but these are the games that are usually played on PCs or gaming consoles rather than on smartphones. Therefore, the evidence regarding the addictive potential of smartphone gaming is currently scarce among adult populations in Western cultures, and no scale assesses this type of content, and therefore further studies are required.
From a psychological perspective, depression and anxiety are associated with gaming addiction (Ferguson, Coulson, & Barnett, 2011; Gentile et al., 2011). Similar findings are reported regarding adults’ PMPU (Thomée, Härenstam, & Hagberg, 2012). Anxiety can be triggered gradually in heavy users when their smartphones are unavailable (i.e., a symptom of substance withdrawal [Cheever et al., 2014]). However, a recent study observed while depression and anxiety initially positively correlated with addictive technology use proneness, depression (posi- tively) and anxiety (negatively) predicted addictive video game playing (Andreassen et al., 2016). Regarding stress, problematic online gaming can be conceptualized as a response to preexisting life stress in the framework of the stress-coping theory (Snodgrass et al., 2014), especially when playing MMORPGs. Moreover, Internet Gaming Disorder (IGD) recently included in Section 3 of the fifth edition of theDiagnostic and Statistical Manual of Mental Disorders (American Psychiatric Association, 2013) was associated with stress reactivity (Kaess et al., 2017). How- ever, very few studies exist that assess the relationships between stress and anxiety in smartphone gaming, a gap in knowledge that this study aims to fill.
From a psychosociocultural perspective, few studies have assessed smartphone gaming factors and those that have were conducted in Asia. These include a study in India assessing internal factors (Banerjee & Das, 2015), two in South Korea assessing external factors (Jang & Ryu, 2016;
Jin, Chee, & Kim, 2015), and one in China assessing external factors (Liu & Li, 2011). The Indian study found several motivations for using mobile games, including convenience, fun, escapism, easy use, visual appeal, and perceived influence of being a positive tool (e.g., being able to stay alone to enjoy gaming or socializing). One of the South Korean studies (Jin et al., 2015), focusing on a sociocultural analysis discussing how the emergence of smartphone use had shaped the development of mobile
games, indicated the factors that contributed to increases in smartphone gaming (e.g., a community-based social environment based on technology use). Jang and Ryu (2016) took a developmental approach examining the rela- tionship between parenting and adolescents’ problematic mobile game use, and suggested overexpectation regarding their children’s potential positively related to problematic mobile game use. Finally, Liu and Li (2011) reported context was the strongest predictor in mobile game adoption (e.g., affecting perceived usefulness and enjoyment).
There are a number of reasons for carrying out this study.
First, there is little empirically known regarding potentially problematic smartphone gaming, especially in adulthood.
Second, PMPU has almost exclusively been studied in relation to addictive use only rather than considering other potential problems, such as dangerous or prohibited use. To remedy this, this study investigates the multidimensional construct of PMPU across the three problematic smartphone uses. Third, while PMPU exists in Eastern cultures, little evidence has been found in Western cultures. Therefore, this study aims to explore this phenomenon in two European countries to assess smartphone gaming patterns, potential problems, and associated factors. Consequently, the objec- tives of this cross-national study were twofold. First, to investigate the extent to which Belgian and Finnish adults use mobile games, and second, to identify whether this is associated with problematic use (namely dangerous, pro- hibited, and dependent use), and to identify psychological predictors (namely depression, anxiety, and stress) and gaming patterns associated with problematic smartphone use.
METHODS
Participants
The study surveyed two convenience online samples, at the Catholic University of Louvain (Belgium; n=397) and Oulu University of Applied Sciences (Oulu UAS, Finland;
n=502) with 899 participants [30% male; age range:
18–67 years, mean (M) age 26.8 years, standard deviation (SD)=9 years], sampled from student and staff members voluntarily agreeing to participate.
Measures
The online survey was developed using Qualtrics and comprised: (a) sociodemographics, (b) smartphone use pat- terns (e.g., mobile game genre), and (c) psychometric scales assessing problematic smartphone use, depression, anxiety, and stress.
Sociodemographics examined gender, age, relationship status [i.e., single, in a relationship, legally cohabitating, married, separated, divorced, or other (e.g., widowed)], education level (i.e., primary, secondary, and higher educa- tion), and profession (i.e., student, employed, unemployed, retired, housewife/husband, self-employed, or other).
Smartphone use patterns examined possessing a smartphone, mean use in minutes per week (including daily and weekly smartphone gaming) and usual use
frequency (days/week), and online gaming activities on smartphones during the past year, i.e., downloading (e.g., apps), SNS use (i.e.,Facebookuse in general, gaming and posting and checking of received posts), or playing different mobile games by genre: casual games (e.g.,Candy Crush), solo video games (e.g.,Grand Theft Auto), vehicle simulation games (e.g., Farming Simulator 14,), strategy and management games (e.g., The Sims,), sports games (e.g., FIFA 15), first person shooters (e.g., Call of Duty), Multiplayer Online Battle Arena games (e.g., Heroes of Order & Chaos), MMORPGs (e.g., Dawn of the Immor- tals), and gaming versatility (i.e., playing more than one game genre during the past 12 months).
Psychometric tests:PMPU was assessed using the short version of the Problematic Mobile Phone Use Questionnaire (PMPUQ-SV;Billieux et al., 2008;Lopez-Fernandez et al., 2017). This assesses forbidden, dangerous, and self- perceived smartphone dependence, and was adapted to Finnish from French using the translation–back translation method (Brislin, 1970). The response rate of the PMPUQ- SV was 79.4% in Belgium and 73.6% in Finland. The PMPUQ had good psychometric properties in previous studies, regarding its original longer version (Billieux et al., 2008) and its dependence subscale (Lopez-Fernandez et al., 2017). It comprises 15 items rated on a Likert scale (ranging from 1“strongly agree”to 4“strongly disagree”).
The three subscales are: dependent use, e.g.,It is hard for me to turn my mobile phone off; dangerous use, e.g., While driving, Ifind myself in dangerous situations because of my mobile phone use, and prohibited use, e.g.,I don’t use my mobile phone when it is completely forbidden to use it. Total scores range from 15 to 60, with higher scores representing increased presence of“problematic smartphone use”.
The Depression, Anxiety, and Stress Scale (DASS;
Lovibond, & Lovibond, 1995a,1995b), which assesses these negative affective conditions was used in its shorter version (DASS-21;Antony, Bieling, Cox, Enns, & Swinson, 1998), translated into French and Finnish (Lovibond, 2017). The short DASS was shown to have excellent psychometric properties, good factorial and concurrent validity, and Cron- bach’sαs of .94 for depression, .87 for anxiety, and .91 for stress (Antony et al., 1998). It comprises 21 items rated on a Likert scale (ranging from 0“Did not apply to me at all”to 3
“Applied to me very much or most of the time”). The three subscales are: depression (assessing dysphoria, hopelessness, or anhedonia; e.g.,I couldn’t seem to experience any positive feeling at all), anxiety [assessing psychophysiological activa- tion, and arousal, the subjective experience of anxious affect/
skeletal musculature effects; e.g.,I experienced trembling (e.g.
in the hands)], and stress (difficulty relaxing, being nervous, easily agitated/impatient; e.g.,I found it hard to wind down).
Total scores range between 0 and 21 per subscale, with higher scores representing increased presence of these constructs.
Procedure
The invitation to participate used three recruitment strate- gies: (a) inviting undergraduates during the Spring semester 2015 at both universities; inviting participants via (b) electronic invitations in academic online environ- ments (e.g., Psychological Sciences Research Institute:
https://www.uclouvain.be/364770.html), and (c) SNSs (e.g., the TUD and Oulu UAS SNSs).
Statistical analysis
Comparisons of sociodemographic variables, use patterns, and mobile game genres across Belgium and Finland were tested with χ2, studentt-tests, and non-parametric Mann– Whitney U tests. Exploratory Factor Analysis (EFA) with the principal components (PC) technique (using Promax rotation) was used to test the factor validity of the PMPUQ- SV. Student t-tests, multivariate analysis of variance, and Pearson’s correlation coefficient (r) were used to determine whether specific sociodemographic and usage patterns influ- enced problematic smartphone use. Additional Cronbach’s αand Pearson’s (r) coefficients were used to obtain internal reliabilities of the PMPUQ-SV and DASS-21 subscales and their degree of association. Finally, a set of multiple linear regressions with an entry method (i.e., forward type) was performed to identify potential predictors. SPSS 21 software was used.
Ethics
The research team’s university ethics committee approved the study. All participants were informed about the study and all provided informed consent.
RESULTS
Sociodemographics and smartphone use in Belgium and Finland
Users from both countries were quite similar, as can be seen in Table 1. However, some statistical differences in socio- demographics were observed [gender:χ2(1)=5.87,p<.05;
age: t(897)=−4.15, p<.001; relationship status: χ2(6)= 175.1,p<.001; profession:χ2(6)=24.84,p<.001; educa- tional level: χ2(6)=208.29, p<.001], while their smart- phone use showed no significant differences [e.g., time/
weekday:Z =−0.95,p=.34; gaming behavior:χ2(1)=0.21, p=.65; versatile gaming:χ2(1)=0.18,p=.67].
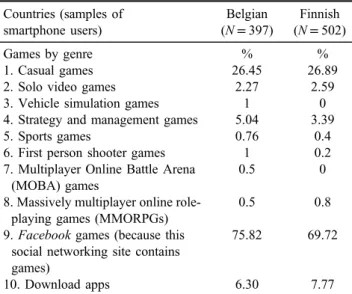
Regarding gaming, Belgian and Finnish smartphone users were not prone to smartphone gaming, as the majority had not played any mobile game. However, when they played mobile games, they played quite often. More spe- cifically, one-third of the Belgians and Finnish had played (Table1), although only a few were categorized as versatile mobile gamers. The mobile game genres played were casual games, followed by strategy and solo mobile games (Table2). Results also showed usingFacebookand down- loading apps were prevalent activities indirectly related to smartphone gaming. However, similar to smartphone gam- ing patterns described in Table1, there were no significant differences between countries in smartphone gaming activi- ties [e.g., casual games: χ2(1)=0.02, p=.88; strategy games: χ2(1)=1.53, p=.22; downloading apps: χ2(1)= 0.73, p=.39]. However, there was a weak significant difference in SNS use [Facebook: χ2(1)=4.13, p<.05;
Cramer’sV: 0.07,p<.04].
PMPUQ-SV descriptive statistics, associations, and psychometrics
The PMPUQ-SV scores were not significantly different between samples [U: Z=−0.71, p=.480; MBelgium (n= 465)=27.66, SD=7.62; MFinland (n=443)=27.18, SD= 6.37] and between subscales [e.g., dependent use: U:
Z=−0.40, p=.689; MBelgium (n=465)=11.15, SD=4.43;
MFinland(n=449)=11.14,SD=3.63]. The analysis was car- ried out merging both samples to observe potential internal and external predictors of problematic smartphone use.
The results obtained through an EFA with the PC technique were Kaiser–Meyer–Olkin=0.83, Bartlett’s test:
χ²(105)=3,615.94; p<.001, and yielded three factors that
explained 50.7% of the variance. Specifically, the sums of the squared loadings were 4.01, 2.18, and 1.42 for Factors 1
“dependent use” (26.72% variance), 2 “dangerous use” (14.53% variance), and 3 “prohibited use” (9.44% vari- ance), respectively, as expected following the factorial structure described in the method section. The 15-item scale had an overall good reliability (α=0.79), similar to its subscales (Table3); only“prohibited use”obtained a mod- est alpha, which is acceptable as it was above 0.5 as this coefficient is sensitive to the number of items in the scale (i.e., five items per PMPUQ-SV subscale; Cortina, 1993;
Helmstadter, 1964).
Sociodemographics were associated with problematic smartphone use. Females were more likely to be dependent Table 1. Sociodemographic and patterns of using mobile phones/smartphones
Countries (samples of smartphone users) Belgian (N=397) Finnish (N=502) Variables (nresponses)
Values %/M(SD) %/M(SD)
Gender
Male 25.4 33.9
Female 74.6 66.1
Age 25.38 (9.3) 27.87 (8.62)
Young adulthood (18–39 years old) 90.4 86.3
Middle adulthood (40–65 years old) 8.8 13.7
Late adulthood (66 years old) 0.8 0
Civil status
Single 57.3 31.7
In couple 27.2 13.4
Married 8.3 21
Separated 0.5 0.4
Divorced 2.5 2
Legally cohabitating 3.8 31.3
Other (e.g., widow) 0 0.2
Profession
Student 74.3 85.1
Employed 17.4 9.3
Without employment 1 1.3
Retired 0.5 0
Housewife/househusband 0.5 0.7
Liberal profession 2 1.3
Other 4.3 2.2
Educational level
Primary 0 0.2
Secondary 59.7 73.7
Higher (Bachelor, Master, and PhD) 40.1 24.6
Other (e.g., arts and continuous training) 0.3 1.5
Time on a typical weekday in min 108.23 (135.2) 91.52 (100.78)
Time on a typical weekend day in min 114.22 (138.94) 89.15 (94.65)
Days per week using the smartphone 6.53 (2.37) 6.32 (2.52)
Number of mobile games usually played 0.38 (0.79) 0.34 (0.54)
Mobile gaming behavior
No 70.5 69.1
Yes 29.5 30.9
Versatile gamer (from those who played mobile games)
Yes 3.53 3.19
Note. N=899; qualitative variables are shown with valid percentages and quantitative with mean (M) and standard deviation (SD).
on using smartphones [t(399)=−2.30, p<.05 (men:
M=11.17, SD=3.87, women: M=12.21, SD=3.72)], whereas males used smartphones more dangerously [t(399)= 2.74, p<.001 (men: M=8.42, SD=3.05, women:
M=7.47, SD=3.87)]. PMPUQ-SV scores significantly correlated with age (dangerous use: r=0.11,p<.05; pro- hibited use:r=−0.17,p<.01), and older users tended to use smartphones in dangerous situations, whereas younger people used it more often when use was banned. A MAN- OVA was computed to check the interaction between country and age (as reported in Table 1) on the PMPUQ- SV subscales. Age predicted dependent use [F(2, 755)= 11.52, p<.001] and prohibited use [F(2, 755)=11.64, p<.001]. Only a first-order interaction appeared between age and country in prohibited use [F(2, 755)=7.94, p<.01], because while in Belgium, banned smartphone use was decreasing by age groups (Erikson, 1968; young adults: M=8.86, SD=2.74; middle aged: M=6.77, SD=2.78; older adults: M=5, SD=0), the tendency of Finns was also decreasing but reversing the scores in middle adulthood and producing a cross-over interaction bet- ween young and middle adults (young adults: M=8.22, SD=2.33; middle adults:M=7.81,SD=2.17; no data for older adults were reported). The other sociodemographic
variables did not significantly predict PMPU. However, time spent using mobile games was associated with PMPU: days/week (dependent: r=.28, p<.001; danger- ous: r=.15, p<.01) and min/week (dependent: r=.36, p<0.001; dangerous:r=−.15,p<.01; prohibited:r=−.17, p<.01), supporting the PMPUQ-SV’s construct validity.
Casual gamers scored higher on the PMPUQ-SV dependence subscale than participants who did not play casual games [dependent use: t(399)=−2.06, p<.05 (yes: M=12.09, SD=3.74, no:M=10.65,SD=3.87)]. Finally, the DASS- 21 had high internal consistency and positively correlated with the PMPUQ-SV.
Predictors of perceived problematic smartphone use A multiple linear regression was computed using the whole sample (rather than the respective subsamples per country), as most variables related to gaming behavior were similar across countries, with the PMPUQ-SV as outcome variable and these predictors: patterns of smartphone use regarding gaming [i.e., being a mobile gamer, having versatile gaming behaviors, playing casual games, downloading apps, using Facebook, country (Finland and Belgium), depression, anx- iety, and stress]. The rationale behind the selected factors is that these were the more common variables related to smartphone gaming in the TUD project that showed in the descriptive analysis that Belgian and Finnish smartphone users usually associated with. Results showed the variance inflation factor (VIF) and tolerance index supported the absence of multicollinearity (i.e., VIFmax<2.07, tolerancemin=0.48). The Durbin–Watson coefficient indi- cated a lack of autocorrelation between adjacent residuals (0<2.25<4). A significant model emerged [F(8, 214)= 3.29, p<.01; R2=.11], explaining 11% of variance.
PMPUQ-SV scores were predicted by downloading apps (B=1.62,SEB=0.63,β=0.17,t=2.59,p<.05),Facebook use (B=1.27, SEB=0.53, β=.16, t=2.39, p<.05), and stress (B=0.52,SEB=0.15,β=0.31,t=3.38, p<.01).
However, dimensions of PMPU slightly changed the predictors when computing a regression per subscale. Re- garding dependent smartphone use (VIFmax<2.02, toler- ancemin=0.48, Durbin–Watson=2.18), a significant model emerged [F(8, 214)=2.55, p<.05] explaining 9% of the variance, positively predicted by Facebook use (B=0.82, SEB=0.33, β=0.17, t=2.47, p<.05) and being stressed Table 2. Games used on smartphones (N=889)
Countries (samples of smartphone users)
Belgian (N=397)
Finnish (N=502)
Games by genre % %
1. Casual games 26.45 26.89
2. Solo video games 2.27 2.59
3. Vehicle simulation games 1 0
4. Strategy and management games 5.04 3.39
5. Sports games 0.76 0.4
6. First person shooter games 1 0.2
7. Multiplayer Online Battle Arena (MOBA) games
0.5 0
8. Massively multiplayer online role- playing games (MMORPGs)
0.5 0.8
9.Facebookgames (because this social networking site contains games)
75.82 69.72
10. Download apps 6.30 7.77
Table 3. Reliability and correlation matrix of the PMPUQ-SV and the DASS-21 subscales (Cronbach’sα; Pearson’sr) in both countries (Belgium and Finland)
Subscales Cronbach’sα PMPUQ-SV-P PMPUQ-SV-D PMPUQ-SV-Dep DASS-21-D DASS-21-A DASS-21-S
PMPUQ-SV-P (n=401) .59 1
PMPUQ-SV-D (n=401) .67 0.36** 1
PMPUQ-SV-Dep (n=401) .85 0.33** 0.23** 1
DASS-21-D (n=473) .90 0.13* 0.03 0.13* 1
DASS-21-A (n=473) .81 0.17** 0.06 0.12* 0.67** 1
DASS-21-S (n=473) .86 0.21** 0.08 0.20** 0.71** 0.75** 1
Note.PMPUQ-SV-P: prohibited use; PMPUQ-SV-D: dangerous use; PMPUQ-SV-Dep: dependent use; DASS-21-D: depression; DASS- 21-A: anxiety; DASS-21-S: stress.
*p<.05. **p<.001.
(B=0.31,SEB=0.10,β=0.30,t=3.21,p<.01), but neg- atively predicted by anxiety (B=−0.27, SEB=0.12, β=
−0.52,t=−0.58,p<.05). Regarding prohibited smartphone use (VIFmax<2.08, tolerancemin=0.48, Durbin–Watson= 1.98), a significant model emerged [F(8, 214)=2.7,p<.01], explaining 9% of the variance, predicted by downloading apps (B=0.47,SEB=0.23,β=0.13,t=2.04,p<.05), and being a Belgian resident (B=−0.44,SEB=0.17,β=0.18, t=−2.63,p<.01).
DISCUSSION
Despite the increased popularity of mobile phones and smartphone gaming, gaps in current knowledge were iden- tified. This is the first study to examine the influence of smartphone and smartphone gaming on users’ self- perceived problematic use in Belgian and Finnish adults.
It also adds to the current knowledge base by investigating potentially problematic smartphone gaming from a cross- national perspective. Smartphones have features and apps that facilitate habitual usage with many benefits (i.e., increased connection, productivity, and entertainment;
Pew Research Center, 2015). The online-enabled features allow users to download and play games and interact with others anywhere at any time. In the present European sample, respondents were smartphone users regularly engaged in online activities (i.e., approximately 1.5 hr/
daily). Mobile games were used by one-third of the respec- tive populations, as stated by Deloitte (2014) for Finnish individuals and the ISFE (2012a) for Belgians. The present findings suggest smartphone gaming, specifically casual gaming, is one of the main activities engaged in in these two countries, but it is not the most popular activity because social networking (i.e., using Facebook) was more prevalent.
Thefindings showed that the favorite type of gaming on smartphones was playing casual games rather than MMORPGs, which are considered more addictive games on PCs and consoles (Kuss, 2013;Kuss et al., 2012). These results are in line with ESA findings (2015), indicating social games, puzzle games, action, and strategy games are the most commonly played mobile games. As Engl and Nacke (2013) suggested, mobile game players may engage in these activities for instant entertainment and to fill time between daily activities (e.g., playing games while com- muting). According to Jin et al. (2015), the expansion of smartphone gaming has been driven by the compact screen and easy mobility of these devices. This has generated an increasing production of casual games, similar to puzzle games, which are characterized as a leisure activity that requires sporadic attention of up to 5 min.
The PMPUQ-SV demonstrated that it had a three-factor structure in both languages and an adequate reliability, as has been shown in previous literature (Billieux et al., 2008;
Lopez-Fernandez et al., 2017). The results regarding the PMPU dependence subscale were similar to those by Roberts et al. (2014) who used the short Manolis/Roberts Cell-phone Addiction Scale, indicating smartphone gaming did not predict cell phone addiction, which is in accordance with the findings here. However, this study demonstrated
higher problem and dependence scores, which were posi- tively correlated with time spent on leisure mobile activities.
On the one hand, these associations provide evidence for construct validity and the relationship between time and dependent smartphone use (Bae, 2017). However, as a number of studies make clear, time spent using these devices and engaging in online activities excessively is not always associated with addictive use (Griffiths, 2010). Furthermore, Rosen, Whaling, Carrier, Cheever, and Rokkum (2013) noted at least two issues when discussing time perception and problematic technology uses. First, the assessment of time spent using the technology has been proven to be problematic (e.g., users are not accurate at estimating the time they spend on the computer;Junco, 2013). Second, an individual’s preference for task-switching or multitasking may explain use times (e.g., half of the time when users were online they were multitasking; especially young adults are texting or using SNS;Moreno et al., 2012). Moreover, while females scored significantly higher on dependence, concur- ring with the findings of Roberts et al. (2014), males were more likely to use their smartphones in a dangerous way, similar to studies reporting the use of smartphones while driving (McEvoy, Stevenson, & Woodward, 2006) and distraction while walking (Zhou, 2015). With respect to age and time, both were only weakly associated with slight problems and not related to dependency. Overall, the results showed that the potential predictors of problematic smart- phone use were downloading apps, using Facebook, and being stressed. Dependence was predicted by low anxiety, and prohibited use was a problem in the Belgian sample.
Evidence from previous research indicated that social networking is associated with addictive mobile behaviors (e.g., Jeong et al., 2016; Roberts et al., 2014; Salehan &
Negahban, 2013). Furthermore, some SNSs (e.g., Face- book) contain games (Griffiths, 2012), sometimes offered by gambling developers (Griffiths, 2015; Jacques et al., 2016), that can be played on smartphones by downloading the apps and accessing them via SNSs, and completing the games using different hardware (e.g., smartphones, PCs, and tablets). According to Müller, Wölfing, and Dreier (2013), the social networking component of online games indicates that a successful gamer has the subliminal quest for social- izing (e.g., to update personal knowledge about the game of choice), and this could be an alternative explanation about the interdependent use of gaming and SNS. Furthermore, Jeong et al. (2016) highlighted mobile SNS use was a stronger predictor than mobile gaming for smartphone addiction. On the other hand, downloading apps has usually been studied in relation to pirate behaviors, and mobile games are not exempt from this (Phau & Liang, 2012), which may offer a partial explanation for why downloading apps predicted prohibited smartphone use. Another expla- nation may be the social element to downloading apps (e.g., sharing results with others;Kim, Oh, Yang, & Kim, 2010).
These two motivations for downloading apps hold for free- to-play Facebookgames, which are easy and convenient, playable with friends, and as single players (Kuo-Hsiang, Shen, & Min-Yuan, 2012;Paavilainen, Hamari, Stenros, &
Kinnunen, 2013). Consequently, the presentfindings did not show that problematic gaming was present in the samples studied, in addition to gaming predictors not explaining
PMPU. This is contrary to findings from Asiatic research studies carried out among adolescent populations (Jeong et al., 2016;Lee et al., 2016). It may be that the phenomenon of smartphone gaming is more prevalent in Eastern cultures compared with Western cultures, although comparability is unclear as methods, populations, and other contextual char- acteristics (e.g., parenting, educational, and work environ- ments) are different in both cultures and external predictors have not usually been studied.
The results regarding the mental health predictors were partially in line with Andreassen et al.’s (2016) recent findings relating to addictive video gaming, as in this study anxiety also negatively predicted smartphone dependence, but depression did not. Moreover, stress positively predicted problematic smartphone use and dependence (which had not been studied previously). Regarding depression, Andreassen et al. (2016) found there was a significant but weak correla- tion with addictive gaming. Concerning stress, an alter- native explanation is required when using smartphone apps, such as games and SNSs, leading to more stress and increased self-perceived problematic smartphone use.
However, Lee et al. (2014) found there is a type of stress associated with excessively using smartphones (e.g., checking notifications), which is an outcome, instead of a predictor, of problematic smartphone use. Finally, regarding anxiety, the relationship was indirect, because anxious adult smartphone users perceive themselves to be less dependent on smartphone use, possibly due to smartphone use providing a feeling of relief, especially from social anxiety, which usually emerges when encountering strangers in public settings (Hoffner et al., 2016;Lee et al., 2014). In other words, anxiety decreases when using smartphones.
This suggests smartphone gaming is different from online gaming. As Jin et al. (2015) stated, the genre of gaming is platform-specific because online gaming is usually associated with PC games and requires a higher investment of time and effort relative to the playing of mobile games via smartphones. The psychosocial impact of mobile games may be different in comparison with non- mobile games, as are the behaviors engaged in and the online apps used across platforms, and the contexts of use (e.g., smartphones are frequently used when commuting).
This could also have implications in relation to research related to IGD, because online gaming studies are usually based on gaming via consoles and PCs rather than gaming via smartphones. Furthermore, no game variables (i.e., playing casual games and gaming versatility) were related to problematic smartphone use. This makes intuitive sense because (a) smartphone gaming on a very small screen is much less immersive than gaming via consoles and PCs (Hou, Nam, Peng, & Lee, 2012) and therefore less likely to be potentially problematic, and (b) the more addictive types of games (e.g., MMORPGs), at present, do not translate well on a small smartphone screen compared with simpler casual games that do not rely on sophisticated graphics and sound.
This study also explored gaming regarding smartphone use and problematic smartphone uses in two European countries. According to Jin et al. (2015), the increase of smartphone gaming is explained by sociocultural factors (e.g., mobility and environment), but people may play
mobile games because they are entertaining and fun (Banerjee & Das, 2015;ISFE 2012a,2012b), and they are an accepted pastime activity within Eastern and Western cultures. In this study, being Belgian predicted prohibited smartphone use, and although the literature is scarce regard- ing this technological use aspect across European cultures (e.g., ITU, 2016), it appears Belgians used smartphones when banned more than the Finnish sample in the case of young adults. One reason for this could be that younger age is related to higher smartphone use when prohibited, and in this study, the Belgian participants were younger than the Finnish participants (Table 1). According to Srivastava (2005), students and young adults appear to be the most avid users of mobile phones with little distinction between public and the private spheres (e.g., talking or texting on the phone when forbidden), despite countries attempting to regulate mobile phone usage in public (e.g., prohibiting or restricting use in restaurants, on public transport, in theatres, cinemas, and schools). However, there is not enough litera- ture yet to ascertain why these few cross-cultural differences appeared in relation to prohibited use, and this could be due to different age groups instead of different cultures. In both countries, mobile phones are banned when driving (the penalty being double in Belgium compared with Finland;
Jeanne Breen Consulting, 2009). Similarly, Campbell (2007) also had problems in interpreting why safety and security were cross-nationally differently perceived in relation to mobile phones between American and European countries. This component of PMPU requires more research.
Furthermore, cross-cultural differences in mobile phone use seem to have diminished in smartphones compared with traditional mobile phones (Campbell, 2007), probably due to Internet access. This seems to suggest there is a common Internet culture that goes beyond geographical regions, languages, and other cultural behaviors, which can be considered to be an international culture of the smartphone, at least on the European continent. This similar culture has been observed in Internet activities through cross-country comparisons in other cross-cultural studies related to other behavioral problems (e.g., while differences in Internet use, innovation and perceived risk of Internet shopping have been found between Korean and American users, no differ- ences were detected in online shopping experience and online buying intention in buying behavior; Park &
Jong-Kun, 2003). Accordingly, technological features enable and constrain human behavior, producing consisten- cies and shared perceptions in uses and effects across people and cultures, specifically the younger users’perceptions of the relevant dimensions of mobile gaming adoption, which could provide indirect evidence that different countries and cultures share common interests and motivations in terms of smartphone gaming (“mobile/global youth culture;” Okazaki et al., 2008; Van den Abeele, 2016). Castells (2002) argued the Internet is a cultural creation per se, with smartphones being the material expressions of this culture, containing a set of cognitions and behaviors that are shared among users. In other words, as Silver (2004) stated, the Internet could be considered a meta-field, even a culture, where smartphones have a space to facilitate behaviors like gaming. Consequently, mobile online gaming and other online apps are used and perceived in similar ways across
different countries and cultures, which could explain why smartphone gaming patterns were similar in both countries.
The study is not without its limitations. First, self- selected convenience samples with a self-report methodo- logy were used (which are open to social desirability and memory recall biases). However, the samples were large enough to generalize findings to similar academic popula- tions in both countries. Moreover, as more females were recruited in both universities among social science schools, it is also possible that this gender difference explained part of thefindings in this sample, as traditionally both genders appear to engage with SNSs and games differently. Females are more likely to use SNSs, while males are more likely to spend time gaming (Andreassen et al., 2016;Ko, Yen, Chen, Chen, & Yen, 2005;Szell & Thurner, 2013;Winn & Heeter, 2009). Another limitation is that participants possibly over- estimated or underestimated their true smartphone activities because of the retrospective nature of the survey, and previous research tracking mobile phone use has indicated that self-perception tends to underestimate time spent using smartphones (Lin et al., 2015). Furthermore, the short PMPUQ, although generally internally consistent, had mod- est reliability for the prohibited subscale but this does not diminish its validity (Schmitt, 1996). Finally, in future studies, other more specific predictors concerning personal characteristics of gamers (e.g., impulsivity traits, emotion regulation, and craving symptoms) and their smartphone behaviors (e.g., solely playing Facebook games, gaming- predominant vs. gaming using multiple applications) could be included (Hormes, Kearns, & Timko, 2014; Liu et al.
2016). Furthermore, the smartphone gaming context should be studied (e.g., when commuting, when multitasking at home, when used for entertainment vs. working or study- related purposes;Jang & Ryu, 2016;Jeong et al., 2016;Lee et al., 2016).
Thefindings suggest that, at present, smartphone gaming does not appear to be problematic in terms of dangerous, prohibited, or dependent use in Belgium and Finland.
Gamer characteristics (e.g., being a gamer, being a versatile gamer, or playing casual games) were not predictors of problematic smartphone use. However, when general prob- lematic smartphone use is studied in adult European users, a few predictors appear to explain it (i.e., downloading apps, Facebook use, and stress). Furthermore, for those with a smartphone dependence, low anxiety emerged as predictor, as was using a smartphone when banned. These novel findings relating to gaming via smartphones demonstrated adult behaviors were similar cross-culturally, showing com- mon characteristics, patterns, and perceptions in smartphone users, who did not perceive their smartphone use as prob- lematic in general.
Funding sources:This work was supported by the European Commission (“Tech Use Disorders;” FP7-PEOPLE-805- 2013-IEF-627999) through a grant awarded to OL-F.
Authors’contribution:OL-F was the principal investigator and oversaw the study concept and design, performed the statistical analysis, and initial interpretation of the data. Both
OL-F and NM performed the initial literature search and wrote thefirst draft. DJK and MDG reviewed the manuscript adding comments and suggestions and oversaw the second draft. MK did last reviews, especially in relation to Finnish sample. All co-authors participated contributing in revising the subsequent versions until the final write-up of the manuscript.
Conflict of interest: The authors declare no conflict of interest.
REFERENCES
American Psychiatric Association. (2013).Diagnostic and statis- tical manual of mental disorders (5th ed.). Arlington, VA:
American Psychiatric Association.
Andreassen, C. S., Billieux, J., Griffiths, M. D., Kuss, D. J., Demetrovics, Z., Mazzoni, E., & Pallesen, S. (2016). The relationship between addictive use of social media and video games and symptoms of psychiatric disorders: A large-scale cross-sectional study. Psychology of Addictive Behaviors, 30(2), 252–262. doi:10.1037/adb0000160
Antony, M. M., Bieling, P. J., Cox, B. J., Enns, M. W., & Swinson, R. P. (1998). Psychometric properties of the 42-item and 21-item versions of the Depression Anxiety Stress Scales (DASS) in clinical groups and a community sample.Psycho- logical Assessment, 10(2), 176–181. doi:10.1037/1040-3590.
10.2.176
Bae, S. (2017). The relationship between the type of smartphone use and smartphone dependence of Korean adolescents:
National survey study.Children and Youth Services Review, 81,207–211. doi:10.1016/j.childyouth.2017.08.012
Banerjee, D., & Das, K. (2015). Smartphone gaming in Indian generation Y: An exploration.Romanian Journal of Market- ing, 2,54–66.
Billieux, J. (2012). Problematic use of the mobile phone: A literature review and a pathways model. Current Psychiatry Reviews, 8(4), 299–307. doi:10.2174/157340012803520522 Billieux, J., Maurage, P., Lopez-Fernandez, O., Kuss, D. J., &
Griffiths, M. D. (2015). Can disordered mobile phone use be considered a behavioral addiction? An update on current evidence and a comprehensive model for future research.
Current Addiction Reports, 2,156–162. doi:10.1007/s40429- 015-0054-y
Billieux, J., Van der Linden, M., & Rochat, L. (2008). The role of impulsivity in actual and problematic use of the mobile phone.
Applied Cognitive Psychology, 22(9), 1195–1210. doi:10.
1002/acp.1429
Brislin, E. W. (1970). Back-translation for cross-cultural research.
Journal of Cross-Cultural Psychology, 1(3), 185–216.
doi:10.1177/135910457000100301
Campbell, S. W. (2007). A cross-cultural comparison of percep- tions and uses of mobile telephony. New Media & Society, 9(2), 343–363. doi:10.1177/1461444807075016
Castells, M. (2002, Fall). The cultures of the Internet. Queen’s Quarterly, 109,333–344.
Cheever, N. A., Rosen, L. D., Carrier, L. M., & Chavez, A. (2014).
Out of sight is not out of mind: The impact of restricting wireless mobile device use on anxiety levels among low,
moderate and high users.Computers in Human Behavior, 37, 290–297. doi:10.1016/j.chb.2014.05.002
Cheng, C., & Leung, L. (2016). Are you addicted to Candy Crush Saga? An exploratory study linking psychological factors to mobile social game addiction. Telematics and Informatics, 33(4), 1155–1166. doi:10.1016/j.tele.2015.11.005
Cortina, J. M. (1993). What is coefficient alpha? An examination of theory and applications.Journal of Applied Psychology, 78(1), 98–104. doi:10.1037/0021-9010.78.1.98
Dauriat, F. Z., Zermatten, A., Billieux, J., Thorens, G., Bondolfi, G., Zullino, D., & Khazaal, Y. (2011). Motivations to play specifically predict excessive involvement in massively multi- player online role-playing games: Evidence from an online survey.European Addiction Research, 17(4), 185–189. doi:10.
1159/000326070
Deloitte. (2014). Mobile consumer 2014: The Finnish perspec- tive. The pulse of the mobile nation. Retrieved February 7, 2017, fromhttps://www2.deloitte.com/content/dam/Deloitte/fi/ Documents/technology-media-telecommunications/Global%20 Mobile%20Consumer%20Survey%202014_medium.pdf Deloitte. (2015).Mobile games in Europe: Innovation in European
digital economy. Retrieved July 14, 2017, fromhttps://www.
euipo.europa.eu/ohimportal/delegate/webcontent-services/
admindocs/wsdocumentdl/VZIUDXOSFQUIJ5OEO6HWW APID2NVL7U276HVLNGG5TAW5S2Y3VPR253LWZXGP J64CJQZWA27DVWD2
Donati, M. A., Chiesi, F., Ammannato, G., & Primi, C. (2015).
Versatility and addiction in gaming: The number of video-game genres played is associated with pathological gaming in male adolescents. Cyberpsychology, Behavior, and Social Networking, 18(2), 129–132. doi:10.1089/cyber.
2014.0342
Engl, S., & Nacke, L. E. (2013). Contextual influences on mobile player experience–A game user experience model.Entertain- ment Computing, 4(1), 83–91. doi:10.1016/j.entcom.2012.
06.001
Entertainment Software Association [ESA]. (2015).Essential facts about the computer and video game industry. Retrieved Feb- ruary 7, 2017, fromhttp://www.theesa.com/wp-content/uploads/
2015/04/ESA-Essential-Facts-2015.pdf
Erikson, E. H. (1968). Identity, youth, and crisis. New York, NY: Norton.
European Digital Landscape. (2014). We are social. Retrieved November 4, 2017, from http://147.102.16.219/demo1/attach- ments/124_european%20digital%20landscape%202014.pdf Ferguson, C. J., Coulson, M., & Barnett, J. (2011). A meta-analysis
of pathological gaming prevalence and comorbidity with men- tal health, academic and social problems.Journal of Psychiat- ric Research, 45(12), 1573–1578. doi:10.1016/j.jpsychires.
2011.09.005
Gentile, D. A., Choo, H., Liau, A., Sim, T., Li, D., Fung, D., &
Khoo, A. (2011). Pathological video game use among youths:
A two-year longitudinal study.Pediatrics, 127(2), e319–e329.
doi:10.1542/peds.2010-1353
Griffiths, M. D. (1995). Technological addictions.Clinical Psy- chology Forum, 76,14–19.
Griffiths, M. D. (2005). A“components”model of addiction within a biopsychosocial framework. Journal of Substance Use, 10(4), 191–197. doi:10.1080/14659890500114359
Griffiths, M. D. (2010). The role of context in online gaming excess and addiction: Some case study evidence.International
Journal of Mental Health and Addiction, 8(1), 119–125.
doi:10.1007/s11469-009-9229-x
Griffiths, M. D. (2012). Facebook addiction: Concerns, criticism, and recommendations – A response to Andreassen and colleagues. Psychological Reports, 110(2), 518–520. doi:10.
2466/01.07.18.PR0.110.2.518-520
Griffiths, M. D. (2015). Adolescent gambling and gambling-type games on social networking sites: Issues, concerns, and recom- mendations. Aloma: Revista de Psicologia, Ciències de l’Educaci´o i de l’Esport, 33(2), 31–37.
Griffiths, M. D., & Szabo, A. (2014). Is excessive online usage a function of medium or activity? An empirical pilot study.
Journal of Behavioral Addictions, 3(1), 74–77. doi:10.1556/
JBA.2.2013.016
Helmstadter, G. C. (1964). Principles of psychological measure- ment. New York, NY: Appleton-Century-Crofts.
Hoffner, C. A., Lee, S., & Park, S. J. (2016).“I miss my mobile phone!”: Self-expansion via mobile phone and responses to phone loss.New Media & Society, 18(11), 2452–2468. doi:10.
1177/1461444815592665
Hormes, J. M., Kearns, B., & Timko, C. A. (2014). Craving Facebook? Behavioral addiction to online social networking and its association with emotion regulation deficits.Addiction, 109(12), 2079–2088. doi:10.1111/add.12713
Hou, J., Nam, Y., Peng, W., & Lee, K. M. (2012). Effects of screen size, viewing angle, and players’ immersion tendencies on game experience.Computers in Human Behavior, 28(2), 617– 623. doi:10.1016/j.chb.2011.11.007
Interactive Software Federation of Europe [ISFE]. (2012a).Video- games in Europe: consumer study, Belgium November 2012.
Brussels, Belgium: ISFE. Retrieved February 7, 2017, from http://www.isfe.eu/sites/isfe.eu/files/attachments/belgium_-_isfe_
consumer_study_0.pdf
Interactive Software Federation of Europe [ISFE]. (2012b).Video- games in Europe: consumer study, Finland November 2012.
Brussels, Belgium: ISFE. Retrieved February 7, 2017, from http://www.isfe.eu/sites/isfe.eu/files/attachments/finland_-_isfe_
consumer_study.pdf
International Telecommunication Union [ITU]. (2015).The World in 2015: ICT facts and figures. Geneva, Switzerland: ITU.
Retrieved February 7, 2017, fromhttp://www.itu.int/en/ITU- D/Statistics/Pages/facts/default.aspx
International Telecommunication Union [ITU]. (2016).Measuring the information society report 2016. Geneva, Switzerland:
ITU. Retrieved February 7, 2017, fromhttps://www.itu.int/en/
ITU-D/Statistics/Documents/publications/misr2016/MISR2016- w4.pdf
Jacques, C., Fortin-Guichard, D., Bergeron, P., Boudreault, C., Lévesque, D., & Giroux, I. (2016). Gambling content in Facebook games: A common phenomenon? Computers in Human Behavior, 57, 48–53. doi:10.1016/j.chb.2015.
12.010
Jang, Y., & Ryu, S. (2016). The role of parenting behavior in adolescents’ problematic mobile game use. Social Behavior and Personality, 44(2), 269–282. doi:10.2224/sbp.2016.
44.2.269
Jeanne Breen Consulting. (2009). Car telephone use and road safety: Final report an overview prepared for the European Commission. Retrieved November 4, 2017, from https://ec.
europa.eu/transport/road_safety/sites/roadsafety/files/pdf/car_
telephone_use_and_road_safety.pdf