J. Int. Financ. Markets Inst. Money 77 (2022) 101496
Available online 26 December 2021
1042-4431/© 2021 The Author(s). Published by Elsevier B.V. This is an open access article under the CC BY-NC-ND license
(http://creativecommons.org/licenses/by-nc-nd/4.0/).
Press freedom and operational losses: The monitoring role of the media
Edina Berlinger
a,*, Judit Lilla Keresztúri
a, Agnes Lubl ´ oy ´
b, Zsuzsanna V oneki ˝ Tam ´ asn ´ e
caCorvinus University of Budapest, Department of Finance, F˝ov´am t´er 8, Budapest 1093, Hungary
bStockholm School of Economics in Riga, Department of Accounting and Finance, Str¯elnieku iela 4a, R¯ıga 1010, Latvia
cOTP Bank Hungary, Operational Risk Management Department, Bab´er utca 9., Budapest 1131, Hungary
A R T I C L E I N F O JEL codes:
G32 G38 D83 Keywords:
Corporate governance Media
Press freedom Operational losses Frequency Severity Risk management Reporting bias
A B S T R A C T
We investigate the monitoring role of the media, its detection and deterrence effects in corporate operational losses. Relying on our theoretical model, we analyze 8,144 loss events from 132 countries between 2008 and 2019. Controlling for factors related to governance, living standards, business cycles, and firm size, we find that press freedom has a significant positive effect both on the frequency and severity of the observed operational losses. An improvement of one standard deviation in press freedom yields around 43% more and 71% higher public losses. Our estima- tions on hidden losses indicate that the worldwide detection rate of operational losses might be smaller than 53% and 13% in terms of number and value, respectively. Furthermore, in countries with a tightly controlled media, hidden operational risks might be tremendous. We suggest using public databases more carefully, adjusting operational risk models for the reporting bias, and promoting press freedom to improve corporate governance structures.
1. Background and motivation
Journalists publish corporate news by obtaining information from companies’ official websites designated for public relationship management, other public sources (press releases, databases, analysts, auditors, regulators, court actions), and their own in- vestigations relying, in many cases, on the hints given by whistleblowers (employees or other insiders) (Dyck, Morse & Zingales, 2010;
Miller, 2006). At the same time, companies may have strong incentives to hide unfavorable corporate events to prevent adverse market reactions (Cummins, Lewis, & Wei, 2006). For instance, the agrochemical company Monsanto Co. maintained a whole department similar to an intelligence center to control and mislead journalists and civil activists who investigated the company’s weed-killer product Roundup (glyphosate) and its association with cancer (Levin, 2019). Similarly, WireCard, a German payment processor and financial services provider part of the DAX index, hired Rami El Obeidi, the former head of Libyan foreign intelligence, to conduct sting operations against journalists and public short sellers (Storbeck, 2020).
Investigative journalists are threatened not only by corporations but also by organized crime groups and governments. According to the worldwide barometer of Reporters Without Borders (RSF, 2020a), in 2020, 47 journalists and 4 media assistants were killed (the
* Corresponding author.
E-mail addresses: edina.berlinger@uni-corvinus.hu (E. Berlinger), lilla.kereszturi@uni-corvinus.hu (J. Lilla Keresztúri), agnes.lubloy@sseriga.
edu (A. Lubl´ oy), tamasnevzs@otpbank.hu (Z. V´ ˝oneki Tam´asn´e).
Contents lists available at ScienceDirect
Journal of International Financial Markets, Institutions & Money
journal homepage: www.elsevier.com/locate/intfin
https://doi.org/10.1016/j.intfin.2021.101496 Received 23 May 2021; Accepted 21 December 2021
most in Mexico, Afghanistan, India, Iraq, Pakistan, Syria), while 384 journalists and 12 media assistants were imprisoned (the most in China, Egypt, Saudi Arabia, and Turkey). However, the media can be oppressed not only in the third world or in dictatorial regimes but also in developed democracies. In addition to physical atrocities against journalists, the oppression can manifest in legislations and market interventions as well, as witnessed in Hungary in the last decade (RSF, 2020b; Szeidl & Szucs, 2021).
In this paper, we investigate the role of the media in revealing and preventing operational loss events worldwide and show why not just rights defenders and civil activists but also investors, corporate risk managers, and financial regulators should be concerned about violations of press freedom.
Our paper can be linked to three lines of research. First, our research is related to the literature on operational risk management.
Operational losses and their determinants were thoroughly investigated both at a firm level (Chernobai, Jorion, & Yu, 2011) and at a country level (Abdymomunov, Curti, & Mihov, 2020; Alifano et al., 2019; Cope et al., 2012; Curti & Mihov, 2018; Li & Moosa, 2015).
The main contribution of this paper is the identification of the press freedom as a significant new explanatory variable and the quantification of the reporting bias. It has been recognized previously that not all loss events are detected, hence operational loss databases might be biased (Li & Moosa, 2015; Wei et al., 2018). For the first time in the literature, we trace reporting bias back to press freedom and estimate the size of the effect. We find that an improvement of one standard deviation in the press freedom results in at least 43% and 71% higher frequency and severity of public operational loss events, respectively. In the light of our findings, operation risk models should be adjusted for the reporting bias.
Second, applying a widely used methodology to assess the size of the shadow economy (Schneider & Enste, 2000; Schneider &
Buehn, 2018), we are the first in the literature to estimate the frequency and the severity of hidden operational losses for each country.
Hidden operational losses might vary greatly, similar to the size of the shadow economy which ranges from 8 to 68% (relative to GDP) (Schneider & Enste, 2018). According to our estimations, the detection rate of operational loss events ranges from 79% (in countries with a free press like Norway and Finland) to 18% (in countries with a tightly controlled press like China and Iran) in 2008–2019. We also document that while more than 85% of public losses belong to countries with high press freedom, they account only for less than 18% of hidden losses.
Third, our research is rooted in the vast body of literature on corporate governance, more specifically, on the monitoring role of the media. It has been recognized in the financial literature that the media plays an important role in corporate governance. On the one hand, journalists act as watchdogs (Miller, 2006) keeping an eye on firms’ operation, revealing, processing, and broadcasting infor- mation that is relevant to their public (You, Zhang, & Zhang, 2018; Zingales, 2000). In this regard, the media acts as a passive monitor just like auditors, regulators, investment analysts, and rating agencies (Tirole, 2006). This detection effect of the media is realized through the career development channel of journalists who are motivated to produce high-impact news by direct financial incentives (such as performance-based compensation and promotion) and long-term reputation (You et al., 2018).
On the other hand, an intensive media coverage triggers active monitors (large shareholders, banks, and venture capitalists) to exercise their control rights and to intervene, for example, by enhancing the firm’s operation, in extreme situations, by removing the incompetent management. Increased media attention can also provoke other stakeholders, such as consumers and employees, to put the firm under pressure, for example, by boycotting. Thus, indirectly, a well-functioning media functions as a deterrent improving managers’ behavior and firms’ value in the long run (Dyck, Volchkova, & Zingales, 2008; Dyck & Zingales, 2004; Wang & Li, 2019; You et al., 2018). Basically, this deterrence effect is realized through the career development channel of managers: their employment, compensation package, promotion, and reputation are threatened in the case of a negative media coverage (Dyck et al., 2008; Dyck et al., 2010; Dyck & Zingales, 2004; Jiang & Kim, 2020; Liu et al., 2017; Liu & McConnell, 2013; Vergne et al., 2018; Zingales, 2000;
You et al., 2018).
In this research, we find evidence for both the detection and deterrence effect of the media, hence for the fundamental role of the free press in corporate governance. The detection effect is manifested in the reporting bias: in countries with freer media, significantly more and larger losses are reported. The deterrence effect is apparent in the distribution of hidden losses: in countries with freer media, the frequency and severity of total hidden operational losses are significantly lower.
We advance the previous literature on the monitoring role of the media by extending the single-country analysis on Russia (Dyck et al., 2008) and China (You et al., 2018) into a multi-country analysis. In particular, we perform a cross-country comparison (not just a country case study) focusing on a longer and more recent period (2008–2019). In addition, we characterize the media in several dimensions, such as the level of media independence, transparency, pluralism, self-censorship, and the number of abuses and acts of violence against journalists. To this end, we use the World Press Freedom (WPF) index as an explanatory variable. Previous literature only focused on some of its elements like newspaper diffusion (Dyck & Zingales, 2004), the extent of state control (You et al., 2018), or the role of the target audience of the media (Dyck et al., 2008). Finally, we also differ in the broadness of our sample as our output variable is the frequency or the severity of public operational losses in each country. Operational losses are a broad category comprising all corporate loss events derived from the operation (and not just frauds as underlined in Dyck et al., 2010), and we investigate all industries, both financial and non-financial. We use the most comprehensive public database of operational loss events: SAS OpRisk Global covering 132 countries and 8,144 large corporate loss events (above US$100,000) (SAS, 2020). As a result of the wider scope in terms of countries, media dimensions, and corporate loss events, this research can be considered as more general and thus its conclusions are more widely applicable.
The article is structured as follows. In the next section, we present the theoretical framework and develop our hypotheses. Af- terwards, we introduce the variables used in the empirical analysis and describe our methodology. Then, we present and discuss the findings from the empirical investigations. The final section concludes by stressing the importance of press freedom in risk man- agement and corporate governance.
2. Theoretical framework and hypotheses development
Operational risk is defined as “the risk of loss resulting from inadequate or failed internal processes, people, and systems, or from external events” (BCBS, 2017, p. 128). This definition includes legal risk but excludes strategic and reputational risk. Operational risk is the second most important source of risk for financial institutions measured by the size of the capital requirement set by the regulator (ECB, 2017).
In the financial sector, operational risk management was institutionalized and linked to good corporate governance by the Basel II regulations (BCBS, 2003; Hull, 2015). Concepts and methods have spilled over to other industries as well. Operational risks are more difficult to model, measure, or mitigate than credit risk or market risk. It is a necessary part of doing business and there is always a danger of realizing a huge operational loss emerging from a source that was not even recognized before (Hull, 2015).
2.1. Information asymmetry and operational losses
Corporate operational risk events are rooted in asymmetric information and can even increase the degree of information asym- metry (Barakat et al., 2014; Kolbel et al., 2017; Liu & McConnell, 2013). Information asymmetry can have two negative consequences: ¨ moral hazard (hidden action) and adverse selection (hidden characteristics). In this research, we focus on the first one; large opera- tional losses can be viewed as manifestations of moral hazard and the corresponding corporate governance problems. Moral hazard arises when a principal entrusts an agent with a task but cannot fully observe the agent’s effort, while the agent may gain private benefits during the implementation (insufficient efforts, self-dealing, etc.) (Tirole, 2006). Thus, the interests of a utility-maximizing agent may conflict with the interests of the principal. Moral hazard can be reduced by transparency, incentives, or monitoring;
however, all these instruments are costly, so corporate governance is never perfect and operational risks are never fully controlled.
In a firm, principal-agent relationships, hence moral hazard, may appear in many forms. The most important relations are when (a) shareholders are the principals and the managers are the agents; (b) managers are the principals and employees are the agents; or (c) other stakeholders (lenders, consumers, civil society, state, regulators, environment, etc.) are the principals and shareholders are the agents. Operational losses are essentially the result of something not working properly in these relationships. Although there are random, exogenous shocks as well, the endogenous causes of damage can be traced back to these governance problems. Note that relations of types (a) and (b) correspond to internal information asymmetry (within the firm), while relations of type (c) to external information asymmetry (outside the firm). An active media coverage can reduce both types of asymmetries (Liu & McConnell, 2013).
The attitude of a player (shareholder, manager, employee, or other stakeholder) to an operational loss is far from being obvious.
Shareholders, for example, have interest in revealing embezzlements and other misappropriations of assets committed by managers and employees; but may prefer to keep them confidential because of the reputational risks. In other cases, also shareholders are actively involved in the misconduct (e.g., tax evasion, market manipulation, bribery, pollution), so they are interested in neither the deterrence nor the detection of operational losses, especially if losses are realized by the company (in forms of supervisory fines, damages lawsuits, etc.) only if the misconduct becomes public.
In theory, principals are interested in uncovering operational problems, while agents are interested in hiding them. Real life sit- uations, however, are more complicated. On the one hand, a particular player (shareholder or manager) can be both a principal and an agent at the same time in different relationships. On the other hand, even principals may prefer secrecy if other risks (credit, market, reputational, strategical) associated with operational losses are high (Kolbel, et al., 2017; Wei et al., 2017). ¨
Depending on the situation, shareholders, managers, employees, and even outside stakeholders might have an interest in initiating, committing, or hiding operational misconducts; or just the opposite, they might have strong incentives to avoid, reveal or even whistle blow these cases to the media. When deciding which action to take, they perform a specific cost-benefit analysis considering their tangible (shareholder value, income, bonus, career development, etc.) and intangible (reputation, health, integrity, etc.) interests (Wei et al., 2017; Zingales, 2000).
2.2. The detection and the deterrence effects of the media
The media has two effects on operational losses: detection (revealing more losses) and deterrence (retaining players from corporate misconducts), notions borrowed from criminology. These effects can act through different channels. The two most important channels are (1) the career incentives for journalists to investigate events and report them (You et al., 2018; Zingales, 2000), and (2) the career incentives for managers to ensure prudent operation (Dyck et al., 2008; Dyck et al., 2010; Dyck & Zingales, 2004; Jiang & Kim, 2020;
Liu et al., 2017; Vergne et al., 2018; Zingales, 2000; You et al., 2018). There are many prerequisites for these career development channels (both for journalists and managers) to function properly: the media should be widespread; it should be independent from both governments and corporations; incentives should be set properly; institutions should ensure the rule of law; and last but not least, the audience should be interested in corporate stories and despise abuses.
Empirical evidence shows that these prerequisites do not always hold resulting in weaker detection and deterrence effects. For example, in countries where newspapers are less widespread, larger investors have larger private benefits making small investors more vulnerable (Dyck & Zingales, 2004). At the same time, a direct or indirect state control undermines both the independence of the media and the performance-based incentive systems with serious implications on monitoring effectiveness. Analyzing news articles on non-financial firms traded on Chinese exchanges, You et al. (2018) found that the state-controlled media was less critical, less accurate, less comprehensive, and slower in response to corporate events than the market-oriented independent media. Moreover, the state-controlled media lagged far behind the market-oriented media in terms of price impact, information on fundamentals, and effects on CEO turnovers
as well. The importance of solid institutions and the rule of law was demonstrated, for example, by Dyck et al. (2010) who found that in the United States, a developed market economy, the media was more successful in revealing corporate frauds than designated monitors (regulators, auditors, etc.). Finally, the importance of the audience was emphasized, for example, by Dyck et al. (2008) who showed that in Russia, the local media targeting powerless or unconcerned domestic readers had no deterrence effect on the managers, while Anglo- American newspapers targeting international investors were highly effective even in reverting abusive corporate decisions of Russian firms.
In this research, we investigate the extent to which the detection and deterrence effects of the media are present in each country.
2.3. Model of public and hidden information
We introduce a simple model of public and hidden information which provides a theoretical framework for the empirical analysis.
Supposing an investor who plans to invest in a country, and thus intends to estimate the country-specific operational risk, we define the expected total operational risk (in percentage) TR as
TR=TL
IC (1)
where TL is the expected total operational loss in dollars, and IC is the invested capital in dollars.
The total operational loss is the sum of the public operational loss (PL) and the hidden operational loss (HL):
TL=PL+HL (2)
The detection rate, defined as the ratio of PL to TL, is an important measure showing the proportion of losses becoming public.
Rearranging (1), the public operational loss (PL) is PL=PL
TL×TR×IC (3)
According to (3), the observable part of the operational losses is the product of three factors: the detection rate, the total operational risk, and size of the invested capital. Taking the natural logarithm of both sides of (3) yields an additive model:
lnPL=lnPL
TL+lnTR+lnIC (4)
As public loss is the product of the observed frequency F (the number of public loss events in a given period) and severity S (the average loss size, i.e., the total amount of public loss in a given period divided by the number of public loss events), we get:
lnPL=lnF+lnS (5)
Thus, using (4) for the total public loss and (5) for the additivity of log frequency and log severity, we can write two separate equations, one for log frequency and another one for log severity:
lnF=aF+bFlnPL
TL+cFlnTR+dFlnIC (6)
Detection rate Total
operational risk Invested capital
Public operational loss (frequency or severity) Free media
(+) (-)
(+) (+) (+)
DETECTION effect of the media (thick black arrow) - increases public
operational loss by enhancing the detection rate
- realized through the career development channel of journalists
DETERRENCE effect of the media
(thick grey arrow) - reduces public operational loss by lowering total risk - realized through
the career development channel of firms’ managers Other factors...
Fig. 1. Detection and deterrence effects of the media.
lnS=aS+bSlnPL
TL+cSlnTR+dSlnIC (7)
where aF+aS =0, bF+bS =cF +cS =dF+dS =1.
Clearly, (6) and (7) imply (4). Equations (6) and (7) are worth investigating separately, similar to advanced risk models where frequency and severity are modelled separately.
Equations (6) and (7) provide a theoretical framework for modeling public operational loss events.
The detection effect of the media (revealing more losses) is reflected in the first terms in (6) and (7). In general, a more intensive media attention (realized through the career development channel of journalists) can lead to a higher detection rate (PL/TL), which in turn causes either higher frequency (F), or higher severity (S), or both. The deterrence effect of the media is manifested in the total risk TR components in (6) and (7). A more intensive media attention can lead to a lower level of total operational risk (revealed or hidden), which in turn causes either lower frequency (F), or lower severity (S), or both. Fig. 1 summarizes the key effects investigated in this research.
Fig. 1 presents that the media might influence the frequency and severity of public operational losses adversely. On the one hand, when journalists can write freely, they are expected to reveal more and larger operational loss events (detection effect). On the other hand, in countries with independent press publicizing facts and forming the public opinion, market players are expected to be more disciplined resulting in fewer and smaller loss events (deterrence effect).
In line with Fig. 1, we formulate two testable hypotheses:
H1: Press freedom has a positive effect both on the frequency and severity of public operational losses (detection effect).
H2: Press freedom has a negative effect both on the frequency and severity of total (public and hidden) operational losses (deterrence effect).
3. Data and method 3.1. Sample
Public operational loss data are retrieved from the SAS OpRisk Global database, the world’s most comprehensive and accurate repository of external loss events (SAS, 2015; Wei et al., 2018). The database includes all publicly reported operational losses higher than US$100,000 across all industries worldwide, see some typical cases and country-level statistics in the Online Supplementary material Table S1 and Figure S1, respectively. Data are retrieved for the period of 2008–2019, covering 132 countries and 8,144 loss events. Countries are included in the sample if at least one operational loss event occurred in that country during the sample period.
Assuming that a loss event is highly dependent on the local environment, losses are assigned to countries according to the place of the incident.
3.2. Variables
The dependent variable is either the frequency or the severity of operational losses. Frequency is the number of public operational loss events in a particular country in a given year, and severity is the average loss size. Both are expressed in natural logarithm in line with (6) and (7).
Independent variables, as suggested by (6) and (7), include variables to explain the detection rate, the total operational risk, and the size of the invested capital. Table 1 matches the variables from the theoretical model with the variables in the empirical analysis. For the empirical investigation, we first define the potential explanatory variables and then we infer them from other directly measurable indicators. Table 1 also shows the expected sign of the coefficients in the regression analysis, both for frequency and severity of losses, based on our theoretical model and/or previous literature.
First, a proxy for the detection rate (PL/TL), the key variable of interest in this research, is introduced: the PRESS variable derived Table 1
Model variables and expected signs.
Model variables Empirical analysis Expected signs
Potential explanatory variables/determinants Indicators Frequency Severity
Detection rate press freedom PRESS + +
Total risk macro-level governance (development of institutions) GOV +
financial institutions information asymmetry FIE index – –
financial markets information asymmetry FME index – –
micro-level governance (internal information asymmetry) internal fraud to total loss + + financial regulation (external information asymmetry) finance loss to total loss – –
living standards GNI per capita – +
business cycle (expansion versus recession) GDP growth – –
Size size of the economy, macro-level net income GDP + +
average size of companies with loss total assets + +
average size of companies with loss net income + +
average size of companies with loss number of employees + +
from the Word Press Freedom (WPF) index.
lnPL
TL=f(PRESS) (8)
where f is a linear function.
The detection rate is expected to be higher in countries with higher freedom of speech, where individuals can articulate their opinions and ideas without fear of retaliation, censorship, or legal sanction. The World Press Freedom index, measuring the freedom of speech, is published annually by an international non-governmental organization, Reporters Without Borders (in French, Reporters Sans Fronti`eres, RSF) for 180 countries (RSF, 2020b). The World Press Freedom index has been published since 2002, and it aggregates the most relevant qualitative and quantitative dimensions characterizing the conditions the media operates in: pluralism, media in- dependence, environment and self-censorship, legislative framework, transparency, and infrastructure (RSF, 2020b). The scores for the qualitative dimensions are based on media professionals’, lawyers’, and sociologists’ answers to an online questionnaire. Addi- tionally, quantitative dimensions consider seven different types of abuses and acts of violence against journalists, such as murder, imprisonment, firing, ruining media, exile, arrest, and aggression.
Total operational risk TR, the second component in (6) and (7) is the most difficult part to model. According to the literature, operational risk can be explained by a couple of variables (Table 1). These variables shall be considered as potential explanatory variables or determinants of operational risk.
lnTR=g (
GOV, FIE index, FME index, internal loss, finance loss, ln GNI per capita, GDP growth )
(9) where g is assumed to be a linear (increasing or decreasing) function in each variable. Variables in (9) are detailed in the following paragraphs.
Empirical evidence shows that good governance (GOV) has a strong negative effect on severity of operational loss events not only at a firm level (Chernobai, Jorion, & Yu, 2011), but also at a country level (Alifano et al., 2019; Cope et al., 2012; Curti & Mihov, 2018; Li
& Moosa, 2015). As argued by Li and Moosa (2015), good governance reduces the number of low-frequency and high-severity (LFHS) loss events at the cost of increasing high-frequency and low-severity (HFLS) events. The quality of a country’s governance can be measured by the Worldwide Governance Indicator which is retrieved from the database of the World Bank (World Bank, 2021a). The Worldwide Governance Indicator aggregates six dimensions of a country’s governance: voice and accountability; political stability and absence of violence; government effectiveness; regulatory quality; rule of law; and control of corruption (Kaufmann, Kraay, & Mas- truzzi, 2011).
Although the World Press Freedom index is a subcomponent of the Worldwide Governance Indicator and the correlation between the two is high (ρ =0.64), we include both variables separately in the empirical model for several reasons. First, press freedom is only one of the several hundred components included in the Worldwide Governance Indicator and the correlation is not perfect. Second, the Worldwide Governance Indicator is an explanatory variable for the total operational risk (TR), while press freedom is a proxy for the detection rate (PL/TL). Third, these two variables affect the number of operational loss events adversely and thus their coefficients are expected to have opposite signs. In better governed countries with sound institutions, the deterrence effect of the media is expected to be stronger, hence, operational risk is lower. In contrast, in better governed countries with higher freedom in mass media reporting, it is reasonable to assume that journalists will reveal more and larger loss events (detection effect). Finally, their interactions can be examined only if press freedom and governance are introduced separately.
In addition to the quality of a country’s governance, information asymmetry may also explain total operational risk. The higher the information asymmetry, the higher the probability and severity of operational loss events. In the empirical analysis, we define four variables for information asymmetry. The first two variables capturing a broader perspective of information asymmetry in the financial system include the Financial Institutions Efficiency (FIE) index and the Financial Markets Efficiency (FME) index. It is reasonable to assume that the more efficient financial institutions and financial markets are, the lower the level of information asymmetry. The Financial Institutions Efficiency (FIE) index complies data on the banking sector’s net interest margin, lending-deposits spread, non- interest income to total income, and overhead costs to total assets, while the Financial Markets Efficiency (FME) index complies data on the stock market’s turnover ratio (stock traded to capitalization) (Svirydzenka, 2016). Data are extracted from the IMF Financial Development Index Database (IMF, 2021). These broad indicators capture the two most widely used information asymmetry measures in the literature: bid-ask spread and trading volume (Leuz & Verrecchia, 2000; Yoon, Zo, & Ciganek, 2011). The third variable shows the ratio of losses resulting from internal fraud to total loss (internal fraud to total loss). Intuitively, among the Basel II event type categories, internal fraud is the most dependent on the internal information asymmetry and the quality of firm-level corporate governance. A high ratio in a given country signals severe deficiencies in firm-level corporate governance. In general, firms with weaker governance structures (e.g., lower board independence ratios, lower equity incentives of executive directors, and lower levels of institutional ownership) are associated with more internal fraud events, and thus exposed to higher risk (Barakat, Chernobai, & Wahrenburg, 2014).
The fourth variable, the ratio of operational losses incurring at financial institutions to total losses (finance loss to total loss) considers the weight of the highly regulated and controlled financial sector (in terms of operational losses). If the ratio is high, then firms are tightly monitored due to the considerable weight of the financial sector in the economy. As a result of the tight monitoring, which is associated with higher transparency and appropriate incentives as well, the external information asymmetry shall be lower in all industries as sophisticated risk management practices might spill over from the financial sector to other sectors.
Economic, societal, and political factors might also be considered as determinants of total operational risk (Table 1). For example, the standard of living, measured by the per capita GNI (World Bank, 2021b) was identified as a country-specific explanatory variable of
operational risk by Li and Moosa (2015). The authors showed that the higher the standard of living, the lower the frequency of losses due to higher concentration of low frequency-high severity events. At the same time, the higher the standard of living, the more severe the losses are due to the higher wealth. In addition to the standard of living, the phase of the business cycle (expansion versus recession), proxied by the GDP growth rate, might also be related to operational risk with more and larger loss events occurring during economic downturns (Abdymomunov, Curti, & Mihov, 2020).
Finally, the size of the invested capital IC in a country is proxied by the size of the economy expressed as its gross domestic product (GDP) in current USD (World Bank, 2021c) and other firm-level size variables.
lnIC=h(ln GDP, total assets, net income, number of employees) (10)
where h is assumed to be a linear function in each variable.
The GDP can be considered as a macro-level income measure, it shows the total income generated by the production of economic goods and services in a country. In the empirical analysis, we also include three firm-level size measures. We control for the average size of the sample firms in each country measured by the total assets, net income, and number of employees given the moderate correlation (0.31–0.57) among the variables (Online Supplementary Material, Table S3). Based on our theoretical model, we expect that the frequency and severity of losses are positively associated with the size of the economy and the average size of the sample firms (Table 1).
3.3. Panel regression model
Introducing (8), (9), and (10) to (6) and relying on the Durbin–Wu–Hausman test, we specify the following (country and year) fixed effects panel regression model for the frequency of operational losses:
lnFi,t=αi+βPRESSi,t+γGOVi,t+δFIEi,t+ζFMEi,t+ζInternal fraudi,t+ηFinance lossi,t+θlnGNIi,t+κGDP growthi,t+λlnGDPi,t
+μTotal assetsi,t+νNet incomei,t+ξEmployeesi,t+
∑
t
τtYEARt+εi,t
(11) where
- Fi,t is the number of public operational loss events in country i in year t;
- αi is the country-specific intercept;
- PRESS is the World Press Freedom index multiplied by minus one and scaled between 0 and 100 (a larger value means higher press freedom);
- GOV is the aggregate Worldwide Governance Indicator scaled between 0 and 100 (a larger value means better governance);
- FIE is the Financial Institutions Efficiency Index to characterize information asymmetry at financial institutions;
- FME the Financial Markets Efficiency Index to characterize information asymmetry in financial markets;
- Internal fraud is the ratio of internal fraud to total loss as documented in the SAS OpRisk Global database to characterize internal information asymmetry (within the firm);
- Finance loss is the ratio of the loss in the financial sector to the total loss as documented in the SAS OpRisk Global database to characterize external information asymmetry;
- GNI is the gross national income per capita;
- GDPgrowth is the GDP growth rate compared to the previous year;
- GDP is the gross domestic product in current USD;
- Total assets, Net income and Employees are the average size of the sample firms as reported in the SAS OpRisk Global;
- YEARt is a binary variable for year t;
- εit is the error term.
The reason for multiplying the World Press Freedom index by minus one is that in this way the higher values of the PRESS variable are associated with a more favorable situation (similarly to the GOV variable). The variables PRESS and GOV were scaled between 0 and 100 by using the min–max normalization method. Year dummies are introduced to account for the general trend in the number of loss events over the sample period. Online Supplementary Material Table S2 shows the data source used for each variable.
To expand the understanding of the relationship between the variables PRESS and GOV, we first add them separately to the re- gressions. Afterwards, we include both variables together in the model. Finally, we add their interaction terms (GOV ×PRESS) to the regression model as well. In the same specification, following an exploratory approach, we include all plausible interactions with the PRESS variable. Although we try all plausible interactions, we only keep the statistically significant and economically relevant ones in the end.
In the second round of the specifications, in line with (7), we run fixed effect panel regression models with the same independent variables as in (11) for loss severity (average loss size) as well.
In all specifications, we use the size of countries’ GDP as weights in the analysis acknowledging that larger countries in which the number and size of the firms are larger are more important observations than smaller ones. Standard errors are adjusted for hetero- scedasticity and country-level clustering.
To test the robustness of the findings, we run a set of alternative model specifications for both dependent variables (frequency and severity). First, due to the high frequency and severity of losses in the financial sector, panel regressions are run separately for the financial sector and for all other industries. Second, we exclude the US as an outlier from the analysis. In the US, 4,218 operational loss events occurred in the period of 2008–2019, which is 8.21 and 9.95 times higher than the number of loss events in India (ranked as top 2) and United Kingdom (ranked as top 3), respectively. Third, the panel data analysis is performed on a subsample of 51 countries with the largest GDP; these countries are responsible for 95% of the sample countries’ GDP. Fourth, we run the regressions on countries with the highest number of operational loss events; the 41 countries in this subsample are responsible for 95% of the number of loss events.
Fifth, the panel data analysis is performed on a subsample of countries with the largest operational losses; we include 48 countries responsible for 95% of the total loss.
Note that in our analysis, endogeneity is less of a concern when testing causality between the freedom of press and the number (or the severity) of public operational loss events. Basically, endogeneity can emerge from three sources: measurement errors in the variables, simultaneous causality, and omitted variables (Bascle, 2008). First, neither the dependent variables (frequency and severity of public operational losses) nor the key variables of interest (press freedom, governance) are supposed to be systemically biased due to measurement errors. These variables are computed from data provided by independent organizations specialized on information gathering and processing; hence, self-selection bias can be excluded. Second, neither loss frequency nor severity is supposed to have a backward effect on press freedom, so simultaneous causality can also be excluded in this context. Therefore, only omitted variables can be a source of endogeneity. Country and year fixed effects inherently control for several potentially omitted, unobserved country char- acteristics that are unchanged over time (regions, cultural differences, etc.) and time trends. Nevertheless, as a final robustness check, we address omitted variable bias by implementing a two-stage least squares (2SLS) model with instrumental variables (Bascle, 2008).
We specify three instrumental variables: individuals using the internet (% of population), the index of democracy, and the age de- pendency ratio (% of working age population) (Economist Intelligence Unit, 2020; World Bank, 2021d; World Bank, 2021e). Logically, these variables are expected to correlate with the freedom of press (relevance), while they are expected to be independent of the control variables and thus can affect operational risk only through press freedom (exogeneity).
4. Results
4.1. Descriptive statistics
The final sample includes 132 countries and 8,144 loss events with a total loss of almost $490 billion adjusted for inflation. Online supplementary material Figure S1 shows the distribution of the number of loss events for the 132 countries during the sample period.
The smallest loss amount in the sample is $0.1 million, while the largest is $23,449 million. The mean loss amount is $60.2 million. The most frequent operational loss events are caused by business processes (clients, products, and business practices) and frauds (internal and external). The highest amount of total losses is attributable to business processes and damages to physical assets. The financial sector is responsible for 38% of the total losses followed by the mining industry (24%), manufacturing (18%), and utilities (11%). The
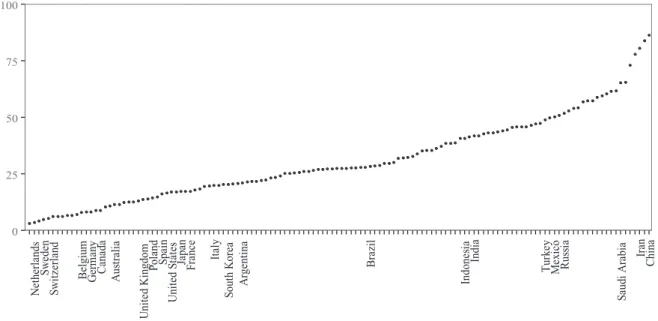
0 25 50 75 100
Netherlands Sweden Switzerland Belgium Germany Canada Australia United Kingdom Poland Spain United States Japan France Italy South Korea Argentina Brazil Indonesia India Turkey Mexico Russia Saudi Arabia Iran China
Fig. 2.World Press Freedom index, average values for 2008–2019. The points represent the average World Press Freedom index in the 132 sample countries. Norway has the lowest value (3.26), while China the highest (86.31). Larger values correspond to lower freedom of press. On the x-axis the names of the 25 countries with the largest GDP, averaged across the sample period, are shown. The World Press Freedom index varies in a wide range across the countries. Although larger economies are concentrated mostly at the lower end, some of them can be found at the upper end.
sample is dominated by loss events occurring in the United States; more than half of the loss events (50.77%) were recorded here.
Countries with the highest number of operational loss events include the United States (4,135), India (497), the United Kingdom (424), Australia (218), Russia (215), Italy (180), China (160), Canada (150), France (135), and Brazil (117). The top 10 countries are responsible for 76.51% of the number of loss events. 95% of the loss events occur in only 41 countries, roughly one-third of the sample countries. 99% of the loss events were documented in 84 countries, roughly two-thirds of the sample countries.
The freedom of the press varies greatly across countries as well. Fig. 2 presents the distribution of the average World Press Freedom index for the 132 sample countries over the period 2008–2019. The figure indicates the top 25 countries with the largest GDP. Online supplementary material Figure S2 provides more detailed information on this distribution for 2019, the last year of the sample period.
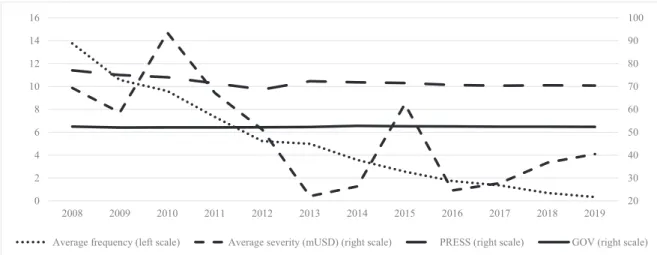
Fig. 3 shows the evolution of the key variables over time. In the period of 2008–2019, there was a declining trend both in the number and the size of loss events as well as in the value of the freedom of the press (PRESS). Note that the lower values of the PRESS variable indicate a less favorable situation (tighter control of the media).
Figs. 4a and 4b show the cross-sectional relationship between two variables: the PRESS variable (y axis) and either the frequency or the severity of operational losses (both relative to the GDP) (x axis), respectively.
Fig. 4a demonstrates that a high number of public losses are reported only in those countries where the press is free, at least to some extent. For example, in the United States, far more loss events are recorded than in China though their GDPs are comparable. However, above a certain threshold, higher freedom of press is not always associated with a higher number of losses. For example, in Germany, operational risks events are less frequent (relative to the GDP) than in the United States. Note that small countries (e.g., Bissau Guinea) might be outliers due to the uneven distribution of the loss events (small sample bias). Fig. 4b shows that loss severity is also positively associated with press freedom, however, this relationship is not driven by the US-China dichotomy, and the interaction with the GDP is less clear.
Online supplementary material Table S2 summarizes the most important descriptive statistics of the dependent and independent variables. We can see a great variation in the explanatory variables, which makes estimations more reliable.
4.2. Regression results
In all specifications, we run panel data regressions with country and year fixed effects. Throughout the analysis, we use countries’
GDP as weights; we assign larger weights to larger countries as leading world economies, such as the US, China, and Germany can be considered more important observations than smaller countries, such as Bissau Guinea (see the highlighted observations in Fig. 4a).
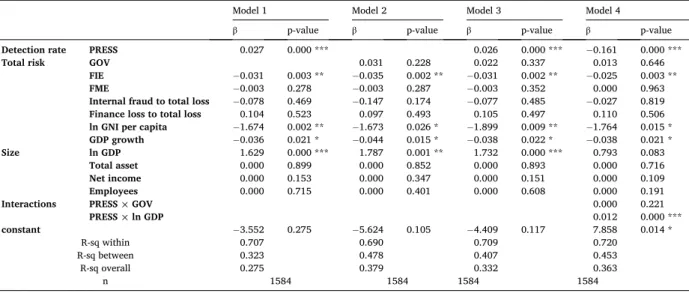
Table 2 shows the results from the regression analyses for the total sample (132 countries, 8,144 loss events); we use the loss frequency as a dependent variable. To fully understand the impact of press freedom (PRESS) and the quality of governance (GOV) on the frequency of losses, we run four specifications. As argued previously, although the PRESS and GOV variables correlate, they may affect the number of operational loss events adversely. In Model 1, the press freedom (PRESS) is included, while the quality of governance (GOV) is excluded. In Model 2 we exclude the PRESS variable, but we include the GOV variable. In Model 3, both variables are included. In Model 4, we add interactions (PRESS ×lnGDP) and (PRESS ×GOV) as well.
As shown in Table 2, in the model with the PRESS variable only (Model 1), the coefficient of the press freedom (PRESS) is positive and statistically significant. The higher the freedom of the press, the more risk events are published by the journalists. The coefficient
20 30 40 50 60 70 80 90 100
0 2 4 6 8 10 12 14 16
2008 2009 2010 2011 2012 2013 2014 2015 2016 2017 2018 2019
Average frequency (left scale) Average severity (mUSD) (right scale) PRESS (right scale) GOV (right scale)
Fig. 3.Frequency and severity of losses, freedom of press, and quality of governance 2008–2019, average values. Variables are averaged across the sample countries for each year. Frequency: average values of the frequency of loss events (left-hand scale). Severity: average values of the severity of loss events in million US dollar (right-hand scale). PRESS: average values of the PRESS variable (right-hand scale). The PRESS variable is the transformation of the World Press Freedom index (scaled between 0 and 100 so that larger values indicate higher freedom). GOV: average values of the GOV variable (right-hand scale) which is the transformation of the aggregate Worldwide Governance Indicator (scaled between 0 and 100 so that larger values indicate better governance).
Germany
Guinea-Bissaau US
China 32
42 52 62 72 82 92
0 0.1 0.2 0.3 0.4 0.5 0.6 0.7 0.8
PRESS
Average loss frequency relative to the GDP
Fig. 4a.Frequency-to-GDP versus press freedom. The x-axis shows the loss frequency relative to GDP for each country; both the loss frequency and the GDP are averaged for each country across the sample period (2008–2019). The y-axis shows the average PRESS variable for each country in 2008–2019.
Iceland
Cyprus US
China 32 42 52 62 72 82 92
0 2000 4000 6000 8000 10000 12000 14000
PRESS
Average severity relative to the GDP
Fig. 4b.Severity-to-GDP versus press freedom. The x-axis shows the loss severity relative to GDP for each country; both the loss severity and the GDP are averaged for each country across the sample period (2008–2019). The y-axis shows the average PRESS variable for each country for 2008–2019.
shows that if the PRESS variable is higher by one point, then the observed loss frequency is higher by exp(0.026)-1 =2.63%. In Model 1, the financial institutions efficiency (FIE), the living standards (GNI per capita), and the GDP growth are significant with negative signs, the size of the economy (GDP) with a positive sign, while year dummies (not shown) are insignificant with negative sign reflecting the global tendency of decreasing loss frequencies during the sample period.
When including the quality of governance (GOV) instead of the freedom of press (PRESS) in the regressions (Model 2), we document an insignificant coefficient for GOV. Thus, in spite of the positive correlation among these two variables, they cannot be used inter- changeably. When both variables are included in the analysis (Model 3), the coefficient of press freedom (PRESS) is significant with a p- value of 0.000, while the coefficient of the GOV is still insignificant. All in all, the coefficient of the PRESS variable is always significant, while the coefficient of the GOV variable is never significant, irrespective of the specification.
When adding interaction terms to the regressions (Model 4), we document a positive coefficient for both PRESS ×GOV and PRESS
×lnGDP, but only the second one is significant in statistical terms (p-values are 0.221 and 0.000, respectively). Thus, PRESS has a larger positive effect on the frequency of losses in larger countries, but the interaction between press freedom and country-level governance is not clear. Note that in the specification with interactions, the coefficients of the PRESS, GOV, and lnGDP variables cannot be interpreted in themselves.
To test the reliability of the findings reported in Table 2, we run a series of robustness checks. In each robustness check, both PRESS and GOV are included. First, we split the 8,144 operational loss events into two subsamples: loss events occurring in financial sector (Model 5) and loss events in the nonfinancial sector (Model 6). The former specification includes 4,973 loss events, while the latter 3,171 events. Afterwards, we exclude the United States as an outlier from the analysis (Model 7); run the regression on the subsample of the 51 countries with the largest GDP (Model 8), on the subsample of 41 countries with the highest number of operational losses (Model 9), and on the subsample of only 23 countries with the highest amount of total losses (Model 10). Finally, we address the omitted variable problem and implement a 2SLS model with instrumental variables (Model 11).
As shown in Table 3, the coefficient of press freedom (PRESS) is positive and significant in all these robustness checks (Models 5–11). The higher the freedom of press, the more risk events are published by the journalists. The freedom of the media affects the number of loss events revealed by journalist both in the financial and non-financial sector (Models 5–6). Models 8–10 show that the PRESS coefficient is stable to the removal of a significant proportion of the sample countries; in Model 10 less than one fifth (17.42%) of the 132 sample countries were included. In the 2SLS specification (Model 11), the coefficient of the PRESS variable is much higher than in the basic model (Model 3) and in other robustness checks.
Table 4 presents the results from the regression analysis for the dependent variable of severity S (average loss amount). Severity shall be interpreted as a conditional value: the average loss amount when there is a loss event.
In the regression analyses with the PRESS variable but without interactions (Models 12 and 14), the coefficient of the press freedom (PRESS) is positive and statistically significant. The coefficient shows that if the PRESS variable increases by one point, then the observed severity of losses increases by exp(0.039)-1 =3.98%. As in the case of frequency, PRESS is significant for severity, while GOV
Table 2
Regression results on loss frequency F for the full sample (132 countries, 8,144 loss events).
Model 1 Model 2 Model 3 Model 4
β p-value β p-value β p-value β p-value
Detection rate PRESS 0.027 0.000 *** 0.026 0.000 *** −0.161 0.000 ***
Total risk GOV 0.031 0.228 0.022 0.337 0.013 0.646
FIE −0.031 0.003 ** − 0.035 0.002 ** − 0.031 0.002 ** −0.025 0.003 **
FME −0.003 0.278 − 0.003 0.287 − 0.003 0.352 0.000 0.963
Internal fraud to total loss −0.078 0.469 − 0.147 0.174 − 0.077 0.485 −0.027 0.819 Finance loss to total loss 0.104 0.523 0.097 0.493 0.105 0.497 0.110 0.506 ln GNI per capita −1.674 0.002 ** − 1.673 0.026 * − 1.899 0.009 ** −1.764 0.015 * GDP growth −0.036 0.021 * − 0.044 0.015 * − 0.038 0.022 * −0.038 0.021 *
Size ln GDP 1.629 0.000 *** 1.787 0.001 ** 1.732 0.000 *** 0.793 0.083
Total asset 0.000 0.899 0.000 0.852 0.000 0.893 0.000 0.716
Net income 0.000 0.153 0.000 0.347 0.000 0.151 0.000 0.109
Employees 0.000 0.715 0.000 0.401 0.000 0.608 0.000 0.191
Interactions PRESS £GOV 0.000 0.221
PRESS £ln GDP 0.012 0.000 ***
constant −3.552 0.275 − 5.624 0.105 − 4.409 0.117 7.858 0.014 *
R-sq within 0.707 0.690 0.709 0.720
R-sq between 0.323 0.478 0.407 0.453
R-sq overall 0.275 0.379 0.332 0.363
n 1584 1584 1584 1584
* p <0.05; ** p <0.01; *** p <0.001
Model 1: Full sample, PRESS included, GOV excluded Model 2: Full sample, PRESS excluded, GOV included Model 3: Full sample, with PRESS and GOV
Model 4: Full sample, with PRESS, GOV, and interactions.
JournalofInternationalFinancialMarkets,Institutions&Money77(2022)101496
12
Table 3
Robustness checks on loss frequency F.
Model 5 Model 6 Model 7 Model 8 Model 9 Model 10 Model 11
β p-value β p-value β p-value β p-value β p-value β p-value β p-value
Detection
rate PRESS 0.026 0.000 *** 0.023 0.000 *** 0.019 0.000 *** 0.026 0.000 *** 0.024 0.000 *** 0.027 0.000 *** 0.230 0.000 ***
Total risk GOV 0.021 0.442 0.030 0.286 −0.015 0.297 0.028 0.271 0.049 0.068 0.056 0.076 −0.084 0.304
FIE −0.033 0.006 ** −0.034 0.003 ** −0.006 0.346 −0.031 0.001 ** −0.030 0.000 *** −0.028 0.001 ** 0.023 0.285 FME −0.002 0.691 −0.007 0.066 0.001 0.699 −0.003 0.323 −0.001 0.851 0.002 0.616 −0.003 0.791 Internal fraud to total
loss 0.032 0.784 −0.156 0.305 0.019 0.798 −0.068 0.560 −0.074 0.559 −0.089 0.551 0.967 0.142 Finance loss to total
loss 0.488 0.008 ** −0.696 0.000 *** 0.235 0.051 0.119 0.452 0.154 0.357 0.190 0.313 −0.010 0.978 ln GNI per capita −1.223 0.094 −2.128 0.006 ** −1.375 0.006 ** −2.011 0.024 * −1.914 0.063 −2.307 0.064 −3.315 0.258 GDP growth −0.037 0.041 * −0.028 0.072 −0.025 0.041 * −0.056 0.010 * −0.057 0.038 * −0.080 0.036 * 0.027 0.272 Size ln GDP 1.087 0.011 * 1.312 0.010 * 1.783 0.000 *** 1.744 0.002 ** 1.624 0.017 * 1.898 0.024 * 1.911 0.359 Total asset 0.000 0.093 0.000 0.447 0.000 0.438 0.000 0.948 0.000 0.883 0.000 0.779 0.000 0.356
Net income 0.000 0.208 0.000 0.075 0.000 0.342 0.000 0.100 0.000 0.198 0.000 0.177 0.000 0.215
Employees 0.000 0.001 ** 0.000 0.806 0.000 0.739 0.000 0.513 0.000 0.315 0.000 0.589 0.000 0.643
constant −2.331 0.480 3.867 0.259 −9.422 0.001 −3.858 0.195 −4.661 0.100 −6.110 0.062
R-sq within 0.668 0.761 0.597 0.733 0.763 0.785
R-sq between 0.415 0.097 0.423 0.424 0.465 0.499
R-sq overall 0.341 0.126 0.319 0.391 0.428 0.435
n 1332 1260 1572 612 492 276 1584
* p <0.05; ** p <0.01; *** p <0.001
Model 5: Subsample of operational loss events in the financial sector (n =4,973 loss events).
Model 6: Subsample of operational loss events for all industries excluding the financial sector (n =3,171 loss events).
Model 7: The US is excluded from the analysis (outlier).
Model 8: Subsample of countries with the largest GDP (51 countries, 95% of total GDP).
Model 9: Subsample of countries with the highest number of operational losses (41 countries, 95% of the total number of operational loss events).
Model 10 Subsample of countries with the highest amount of total losses (23 countries, 95% of the total loss).
Model 11: Full sample, with PRESS and GOV (2SLS). Statistical test results on instrument relevance and exogeneity: number of instruments: 3; first-stage F-statistics (p value in parentheses): 3.92 (p = 0.0102); Hansen J-test (Chi-sq. p-value in parentheses): 2.780 (0.2491); difference-in-Sargan statistics: each instrument is exogenous; Moreira’s conditional likelihood ratio test (p-value in parentheses):
[-0.0052539 –0.0112807] (0.04658).
Berlinger et al.
has no effect on severity in any specifications, including the one without PRESS (Model 13).
When adding interaction terms to the regressions (Model 14), we document significant coefficients for both interactions. The interaction term PRESS ×GOV is significant with a negative sign, while the interaction term PRESS ×lnGDP is significant with a positive sign. Thus, PRESS has a larger positive effect on the severity of losses if the quality of governance is lower and the GDP is higher.
To test the reliability of the findings on severity, we run a series of robustness checks, see Table 5. In particular, we run the regression on the subsample of the financial sector (Model 16); on the subsample of the nonfinancial sector (Model 17); we exclude the United States as an outlier (Model 18); run the regression on the subsample of countries with the largest GDP (Model 19), the highest number of operational losses (Model 20), and the highest amount of total losses (Model 21). The estimation results from the 2SLS regression using instrumental variables are shown in the last two columns of Table 5 (Model 22).
As shown in Table 5, the press freedom is significant in all but one specifications the coefficient is insignificant when losses in the financial sector are examined (Model 16). In the 2SLS estimation the coefficient of the PRESS variable is much higher than in the other models. In addition to the press freedom, only some year dummies (not shown) are consistently significant across all the specifications (Models 16–22).
5. Discussion
The coefficients of the press freedom variable are significant with positive signs for both the frequency and severity of public losses, so we can accept hypothesis H1. In addition to press freedom, only a few other explanatory variables proved to be significant with the same signs as the theoretical model suggested: financial institutions efficiency (-), living standards (-), GDP growth (-), and GDP (+) for frequency; and GDP growth (-) for severity. In the following, we discuss our key findings in relation to the literature.
5.1. The detection effect of the media
Table 6 summarizes the most important findings of this research: the effects of press freedom on operational losses.
For the basic model of loss frequency, for the full sample (Model 3), the estimated PRESS coefficient is 0.026. Across all specifi- cations, the estimated PRESS coefficients are between 0.019 and 0.027 (Table 6). Therefore, a one-point increase in the PRESS variable ceteris paribus improves the detection rate of the loss events by 1.92%–2.74%. For the full sample, we can estimate that one standard deviation (13.83 points) improvement in the press freedom results in exp(0.06*13.83)-1 =43.27% more losses revealed. The effect of press freedom is thus both statistically significant and economically relevant.
For severity, the estimated PRESS coefficient is 0.039 in the total sample (Model 13). Across all specifications, the estimated PRESS coefficients are between 0.036 and 0.060 (Table 5). Therefore, a one-point increase in the PRESS variable ceteris paribus improves the observed severity of the loss events by 3.67%-6.18%. For the full sample, we can estimate that one standard deviation (13.83 points) improvement in the press freedom results in exp(0.039*13.83)-1 =71.49% more severe losses revealed. Thus, the effect of press Table 4
Regression results on loss severity S for the full sample (132 countries, 8,144 loss events).
Model 12 Model 13 Model 14 Model 15
β p-value β p-value β p-value p-value
Detection rate PRESS 0.039 0.018 * 0.039 0.02 * − 0.132 0.197
Total risk GOV 0.027 0.540 0.018 0.731 0.140 0.031 *
FIE 0.029 0.06 0.024 0.104 0.030 0.062 0.027 0.082
FME − 0.001 0.923 −0.001 0.869 0.000 0.960 − 0.001 0.923
Internal fraud to total loss − 0.498 0.102 −0.617 0.103 −0.497 0.100 − 0.359 0.231 Finance loss to total loss − 0.601 0.112 −0.599 0.089 −0.601 0.110 − 0.580 0.115
ln GNI per capita 1.607 0.417 2.058 0.197 1.429 0.444 1.714 0.304
GDP growth − 0.072 0.036 * −0.081 0.014 * −0.074 0.034 * − 0.095 0.004 **
Size ln GDP − 2.093 0.237 −2.109 0.154 −2.018 0.218 − 2.957 0.027 *
Total asset 0.000 0.155 0.000 0.032 * 0.000 0.154 0.000 0.392
Net income 0.000 0.982 0.000 0.618 0.000 0.992 0.000 0.689
Employees 0.000 0.259 0.000 0.186 0.000 0.257 0.000 0.154
Interactions PRESS £GOV − 0.002 0.010 *
PRESS £ln GDP 0.018 0.001 **
constant 15.832 0.245 13.204 0.213 15.116 0.224 22.757 0.025 *
R-sq within 0.290 0.000 0.290 0.320
R-sq between 0.100 0.268 0.084 0.128
R-sq overall 0.040 0.043 0.032 0.036
n 637 637 637 637
* p <0.05; ** p <0.01; *** p <0.001
Model 12: Full sample, PRESS included, GOV excluded Model 13: Full sample, PRESS excluded, GOV included Model 14: Full sample, with PRESS and GOV
Model 15: Full sample, with PRESS, GOV, and interactions