Community ECology 20(3): 252-257, 2019 1585-8553 © AkAdémiAi kiAdó, BudApest
dOi: 10.1556/168.2019.20.3.5
Introduction
Symmetry in animal bilateral traits is a genetic indicator of aptitude, although it is frequently observed that organisms are not perfectly symmetrical (Sanseverino and Nessimian 2008). Fluctuating asymmetry (FA) represents an efficient tool to measure developmental instability in both plants and animals and has been widely used for population monitoring (Beasley et al. 2013, Alves-Silva et al. 2018), as deviations from the axis of symmetry in bilateral characters usually oc- cur due to the inability of the individual to correct minor de- velopmental changes caused by environmental and/or genetic factors that act as a source of stress (Møller 1997, Wilsey et al. 1998, Cornelissen and Stiling 2011).
As changes in the environment have been occurring rapidly in the last decades, biomonitoring studies are im- portant to understand factors that interfere with population growth, community dynamics and ecosystem functioning.
Populations in which many individuals experience develop- mental instabilities due to any type of stress are more suscep- tible to decline (Eterovick et al. 2016). FA has served as the basis for several ecological and evolutionary studies in an at- tempt to demonstrate, efficiently and at low cost, that changes in morphometry are an indicator of environmental and/or genetic stress (review in Beasley et al. 2013). FA has been
demonstrated to be a great tool to determine the stress level of natural and impacted populations of animals and plants, although its application at the community level has been rare (see Anciães and Marini 2000). We here suggest the use of FA as a biomonitoring tool for a whole community of tropical butterflies, an approach that has never been proposed.
Environmental conditions influence the dynamics, distri- bution and survival of organisms. Individuals with a higher sensitivity to habitat adequacy tend to respond negatively to the stress generated by environmental and/or genetic factors (Møller and Swaddle 1997, Vogel et al. 2012), showing in- creased levels of FA under stressful or inadequate conditions.
Increased FA has been found, for example, under intra- and interspecific competition, shortage of resources, climatic in- stability, temperature variation and pollution, amongst others (e.g., Møller 1997, Sanseverino and Nessimian 2008, Leonard et al. 2018). Changes in abiotic conditions as well as changes in vegetation structure, habitat heterogeneity, and ecosystem productivity associated to changes in elevation (Hodkinson 2005) are usually suggested as drivers of increased develop- mental instability and consequently higher FA in organisms at higher altitudes.
Altitudinal gradients have been frequently used in eco- logical studies to test the influence of climatic variation as- sociated to increased elevation and its effects on animal and
Wing asymmetry of a butterfly community: is altitude a source of stress?
N. R. Henriques
1,3and T. Cornelissen
21Departamento de Ciências Naturais, Programa de Pós-Graduação em Ecologia, UFSJ - Universidade Federal de São João Del Rei, Pç. Dom Helvécio, 74, Dom Bosco, São João Del Rei - MG, Brazil
2Departamento de Genética, Ecologia e Evolução, Programa de Pós-Graduação em Ecologia, Conservação e Manejo da Vida Silvestre, UFMG - Universidade Federal de Minas Gerais, Av. Pres. Antônio Carlos, 6627, Pampulha, Belo Horizonte - MG, Brazil
3Corresponding author, e-mail: h.nathaliaribeiro@gmail.com
Keywords: Community ecology; Developmental instability; Environmental stress; Fluctuating asymmetry; Lepidoptera.
Abstract. We present a novel analysis of fluctuating asymmetry (FA) for butterfly wings at the community-level, along an altitu- dinal gradient. FA is an important biomonitoring tool that detects deviations of perfect symmetry in bilateral characters, assum- ing that genetic and/or environmental factors can be a source of stress. This study evaluated the effects of increased altitude on the symmetry of butterfly wings, testing the hypothesis that FA should increase with increased elevation in a tropical mountain.
Butterflies were sampled along an altitudinal gradient of 800 to 1.400 m and forewings were detached, scanned and evaluated for symmetry. Length, width and area of the right and left forewings were measured as surrogates for FA and then combined into an index taking into account the variability of wing sizes of the whole butterfly community. We observed true patterns of FA in the length, width and area of the wings, and wing FA area increased with increased altitude. This study pioneered the analysis of FA for a community of butterflies and FA was efficient to detect developmental instability indicated by imperfections in but- terfly wings.
Abbreviations: ANOVA – Analysis of Variance; FA – Fluctuating Asymmetry; GLM – Generalized Linear Model; L – Left Wing; N – Abundance; R – Right Wing; S – Richness; V – Sample Variance; W – Wing Trait.
Fluctuating asymmetry of a butterfly community 253 plant communities (Hodkinson 2005, McCain and Grytnes
2010, Fernandes et al. 2016), and previous studies have linked FA with environmental stress caused by elevation in animals (Jentzsch et al. 2003, Tembotova et al. 2018, Wells et al. 2018). However, studies involving FA as evidence of envi- ronmental stress in butterflies, as well as its use as a biomoni- toring tool, are still insufficient, and the few existing studies involve morphometric measurements in populations and not in ecological communities along gradients, except for a study with passerine birds (Anciães and Marini 2000) relating FA and habitat fragmentation. Besides the use of FA for a com- munity as a surrogate of stress caused by altitude, we also advanced the idea of measuring different traits in butterfly wings that are important for movement, predator avoidance and foraging efficiency. By measuring wing length, width and area in several butterfly species we aimed to evaluate the effects of variation associated to an altitudinal gradient on the wing symmetry of butterflies, testing the hypothesis of increased FA for an entire butterfly community with increased altitude.
Materials and methods Study area
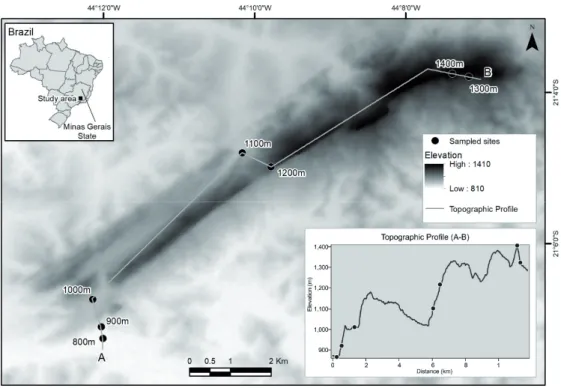
The butterflies were collected inside the Environmental Protection Area of Serra de São José mountain, in the south- central of Minas Gerais, Brazil (21° 7’ 8.87’’ S, 44° 7’ 22.84’’
W, Fig. 1). Serra de São José has elevations ranging from 800 m to 1,413 m above sea level, and exhibits phytophysiogno- mies of the Cerrado and Atlantic domains, with semidecidu-
ous seasonal forest and cerrado at its lower elevations, and campos rupestres at the highest elevations. It spans 4.758 ha (Cirino and Lima 2008) and the climate is marked by mild summers and winter droughts (Köppen classification: Cwb).
The average annual rainfall is about 1.500 mm; the average temperature ranges 19-20°C (Gonzaga et al. 2008).
Data sampling
Butterfly sampling was performed over a 1-year period (March 2016 to March 2017), over four seasons (Season 1: March and April 2016, Season 2: June and July 2016, Season 3: November and December 2016, Season 4: January, February, and March 2017) along seven altitudinal bands be- tween 800 m and 1,413 m, with sampling at every 100 m of altitude. Due to the intrinsic characteristics of the campos rupestres in most part of Serra de São José, few places ex- hibited tall trees and/or forest fragments that would allow the placement and use of traps and, for this reason, all butter- fly sampling was conducted actively, using insect nets. Net sampling was performed at each altitudinal band when the butterflies are most active, i.e., in the mornings and early af- ternoons (9 a.m. to 3 p.m., Santos et al. 2011). At each altitu- dinal band, net sampling was carried out for nearly five hours per day, totaling 140 effective hours in 28 sampling periods and all butterflies were sampled only at the campos rupestres areas of the mountain (Fig. 1). Butterflies were placed in en- tomological envelopes with descriptions of altitude, date and time of collection. They were then sacrificed, mounted, and later identified with the aid of field guides and/or specialists.
Butterflies were deposited at the Entomological Collection of
Figure 1. Map of the location of Serra de São José mountain in Minas Gerais state, Brazil, and the location of the sampling sites along the altitudinal gradient, at every 100 meters of altitude.
17 397
Fig. 1 398
399 400 401 402 403 404 405 406 407 408
254 Henriques and Cornelissen the Department of Natural Sciences of the Federal University
of São João del-Rei (DCNat/UFSJ).
Asymmetry analysis
To measure butterfly wing traits, two criteria had to be met to be included in our FA measurements: 1) There had to be at least three individuals of each species to be selected for asymmetry measurements and 2) both the right and left wings had to be undamaged to properly measure wing length, width and area. Although almost 650 butterflies belonging to 112 species were sampled during the course of our study in the entire elevational gradient (see Henriques et al. 2019), only about half of the individuals sampled meet these two criteria and could be included in our FA analyses.
We measured wings of a total of 366 butterflies, belong- ing to 30 species (Supplementary Material) of the families Nymphalidae (S = 15, N = 165), Hesperiidae (S = 6, N = 92), Pieridae (S = 5, N = 80), Lycaenidae (S = 2, N = 19) and Papilionidae (S = 2, N = 10). The butterflies from each altitudinal band were considered to belong to an independ- ent community. Although there was great variation of species composition along the altitudinal gradient, many of the spe- cies selected for the asymmetry measurement were found in more than a single altitudinal band.
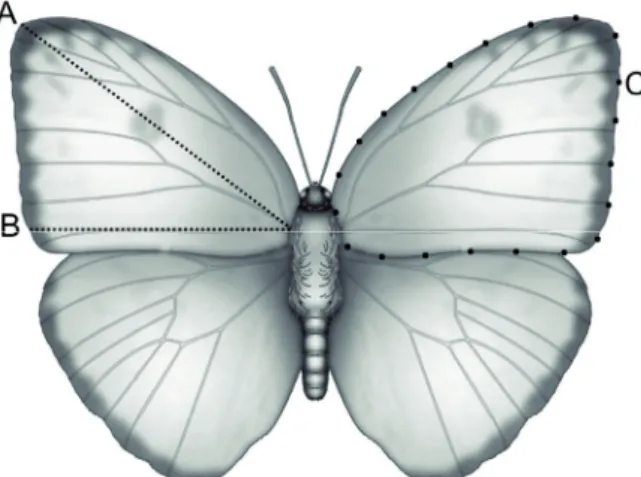
The dorsal face of both right and left forewings of each individual included in this study were digitized and later measured. Wing traits were selected according to Windig et al. (2000) and Adamski and Witkowski (2002), and we se- lected traits that could be measured for the entire commu- nity, regardless of species-specific characteristics. Length was measured from the wing insertion on thorax to the largest diagonal measurement of the forewing (Fig. 2, trait A), cross- ing the discal cell to the apex. Width was measured from the same original point to the largest horizontal measurement of the forewing, considering an angle of 180° (Fig. 2, trait B), crossing the cubital cell, following the first anal vein to the
marginal area. Total wing area was measured as the entire extent of the forewing (Fig. 2, trait C).
To evaluate the effects of altitude on wing asymmetry, forewings were carefully detached, scanned, and the images were captured with ImageJ (Schneider et al. 2012) and meas- urement unit was set to millimeters. Asymmetry for the three wing traits was calculated as the average difference between the left and right sides of the wings, based on modified in- dexes (Palmer and Strobeck 1986, Anciães and Marini 2000):
where: FA = Fluctuating Asymmetry, V = Sample Variance, WR = Right Wing trait (length, width or area), L = Left Wing trait (length, width or area). FA was calculated separately for length, width and area.
The frequency of distribution of values of the traits eval- uated on both sides (left and right) of each individual was tested with Liliefors and one-sample t-tests, and mean values with associated variance were used to generate an index of FA for the butterfly community belonging to each altitudi- nal band (see Anciães and Marini 2000). The mean values of each species were used as replicates at each altitude. A generalized linear model (GLM) was calculated relating the FA indexes for the butterfly communities and altitude. All the statistical analyses were performed using the R software (R Development Core Team 2017).
To circumvent the possibility of measurement errors, af- ter measuring length, width and area traits of the 366 but- terflies, 103 individuals (approximately 30% of the sample) were chosen at random and their measurement procedures were repeated as a double-blind test. In order to discard meas- urement errors a mixed model ANOVA was calculated using length, width and area measured twice as dependent variables and both FA measurements as factors (Palmer and Strobeck 1986).
Results
The butterfly community revealed true patterns of fluc- tuating asymmetry, demonstrated by the normal distribution of the traits measured on the left and right wings. Mean values did not deviate significantly from zero (length: t = –1.326, df = 351, P = 0.186; width: t = 1.751, df = 354, P = 0.081; area: t = –0.295, df = 364, P = 0.768). The absolute deviations of the wings (Right wing trait – Left wing trait) varied between 0 and 2.29 mm for length, between 0 and 1.3 mm for width and between 0.003 and 31.15 mm² for area, considering all the sampled butterflies. Mixed-model ANOVAs for the three traits indicated that measurements taken repeatedly at each wing (Length: F1,204 = 0.123, P = 0.726; Width: F1,204 = 0.243, P = 0.622 and Area: F1,204 = 2.712, P = 0.101) did not differ, indicating that FA measure- ments were accurate and discarding the possibility of values that reflect measurement errors.
18 409
410 411
Fig. 2 412 413 414 415 416 417 418 419 420 421 422 423 424
Figure 2. Schematic representation of bilateral traits measured on the forewings of a butterfly model (Phoebis sennae, Pieridae), where: A = Wing length, B = Wing width and C = Wing area. A, B and C were measured for both right and left forewings.
6 crossing the cubital cell, following the first anal vein to the marginal area. Total wing area 124
was measured as the entire extent of the forewing (Fig. 2, trait C).
125
To evaluate the effects of altitude on wing asymmetry, forewings were carefully 126
detached, scanned, and the images were captured with ImageJ and measurement unit was 127
set to millimeters. Asymmetry for the three wing traits was calculated as the average 128
difference between the left and right sides of the wings, based on modified indexes (Palmer 129
and Strobeck 1986, Anciães and Marini 2000):
130
FA = V �
(�����)/������� 131
where: FA = Fluctuating Asymmetry, V = Sample Variance, W = Wing Trait (length, width 132
or area), R = Right Wing, L = Left Wing. FA was calculated separately for length, width and 133
area.
134
The frequency of distribution of values of the traits evaluated on both sides (left and right) of 135
each individual was tested with Liliefors and one-sample t-tests, and mean values with 136
associated variance were used to generate an index of FA for the butterfly community 137
belonging to each altitudinal band (see Anciães and Marini 2000). The mean values of each 138
species were used as replicates at each altitude. A generalized linear model (GLM) was 139
calculated relating the FA indexes for the butterfly communities and altitude. All the 140
statistical analyzes were performed using the R software (R Development Core Team 2017).
141
To circumvent the possibility of measurement errors, after measuring length, width and area 142
traits of the 366 butterflies, 103 individuals (approximately 30% of the sample) were chosen 143
at random and their measurement procedures were repeated as a double-blind test. In order to 144
discard measurement errors a mixed model ANOVA was calculated using length, width and 145
area measured twice as dependent variables and both FA measurements as factors (Palmer 146
and Strobeck 1986).
147
Results
148
Fluctuating asymmetry of a butterfly community 255
Of the 366 butterflies sampled, only 12 individuals ex- hibited wings that were perfectly symmetric in length (right length minus left length equals zero) and only 8 had perfectly symmetric wings considering wing width (right width minus left width equals zero), but no butterfly presented both traits symmetric simultaneously. No wing exhibited perfect sym- metry in area (right area minus left area different form zero).
In combination, this high frequency of asymmetric wings (96% of the wings measured showed some degree of FA) indicates that wings for these butterflies studied did in fact present asymmetry.
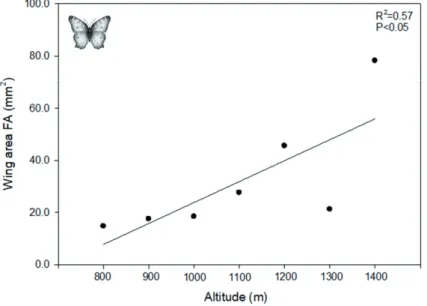
Although all three traits measured for the butterfly com- munity exhibited true patterns of FA at each altitudinal band, only wing FA area increased with increased altitude (R2 = 0.57, P = 0.04, Fig. 3). For wing length and width, there was no significant change in FA with altitude (length: R2 = 0.009, P = 0.83; width: R2 = 0.1, P = 0.48; Supplementary Material).
Discussion
The butterfly community of Serra de São José moun- tain exhibited morphological variation in traits expressed as asymmetry, showing true patterns of fluctuating asym- metry for the three evaluated traits. This implies that FA is detectable for butterflies and can be used as a quick, cheap and efficient biomonitoring tool, especially when the focus of the study is to evaluate community responses to variation in abiotic factors along environmental gradients. FA has been widely evaluated for animal and plant populations, but our novel approach to a community level has been able to show its efficiency to evaluate the health of the environment, func- tioning as a biomonitoring index (Anciães and Marini 2000, Beasley et al. 2013, Yuto et al. 2016).
Altitude has been long pointed as a source of environ- mental stress due to the impacts of changes in abiotic factors with increasing elevation (e.g., Hodkinson 2005, Fernandes et al. 2016 and references therein), potentially affecting but- terfly flight, resource acquisition, activity, reproduction and
performance (Despland et al. 2012 and references therein). In our study, variation in elevation explained almost 60 percent of the variation in symmetry of wing area and butterflies at the higher-most altitude exhibited more than doubled values of asymmetry compared to butterflies at the bottom of the al- titudinal gradient. One of the beauties of the mountain studied is that vegetation types are completely replaced by others with the rise in elevation and this replacement is mainly caused by changes in abiotic factors. Although there is not a plant list for each altitudinal band for this mountain, in a previous study at a similar mountain within the same chain (Serra do Cipó - Fernandes et al. 2016) it is shown that vegetation associated to high radiation and lower temperature (campos rupestres) prevail in higher altitudes whereas vegetation associated to lower radiation and higher temperature (cerrado) prevail on the lower altitudes. Therefore, we believe the effects of habi- tat do not have to be separated from the effects of climate, but they can be combined into a climatic-vegetation axis that influences species distribution. With our sampling design, however, we cannot detect which factor(s) that change with altitude are causing fluctuating asymmetry in butterfly com- munities at each altitudinal band.
Previous studies with butterflies along elevation gradients suggest that a complex combination of variables that change as altitude changes might be responsible for the variation ob- served in butterfly lifecycle, development, life history, host plant use, and fitness along mountains (Despland et al. 2012).
Any or a combination of these factors might influence the patterns of wing asymmetry for butterflies found along eleva- tion. For similar mountain ranges in Brazil, Fernandes et al.
(2016a) have shown an inverse relationship between butterfly species richness and altitude, indicating that changes in plant species composition and climatic factors (such as tempera- ture, wind speed and UV-radiation) combined into a climatic- vegetation axis might be responsible for the patterns found.
We believe variation in plant species composition – that act as food resources for both nectarivorous and frugivorous but- terflies – along the mountain gradient here studied, together with increased wind, decreased temperature and increased
19 425
426
427 428
Fig. 3 429
Figure 3. Relationship between fluc- tuating asymmetry (FA) in wing area of the butterfly community and the al- titudinal gradient of Serra de São José mountain, Brazil.
256 Henriques and Cornelissen UV-radiation might act as sources of stress at the highest al-
titude, causing greater values of FA for this community of butterflies. Our study is a first step towards the understanding of variation of FA with altitude for an entire community of butterflies and we believe FA might also be important as a biomonitoring tool in scenarios of global climatic change. If increased temperature, as expected for the next century (Pecl et al. 2017), for example, accelerates developmental rates of butterflies, one might expect reduction or impairment in the chances of correction in developmental error, causing there- fore higher developmental instability that can be measured and quantified as higher levels of FA under climate change.
Wing size and wing morphology have many ecological and genetic implications for butterflies (Thomas et al. 1998, Talloen et al. 2009 and references therein). Amongst several wing traits that can be measured to evaluate their effects on butterfly performance, wing area and wing size - as well as its symmetry - have been suggested as important functional traits (Aguirre-Gutiérrez et al. 2017, Graça et al. 2017 and references therein), influencing butterfly flight, efficient re- source acquisition and predator avoidance. The other two traits measured in our study (wing length and width) are also important functional traits for butterflies and other insects (butterflies in Adamski and Witkowski 2002, beetles in Javal et al. 2017, dragonflies in Modiba et al. 2017, hemipteran in Lashkari et al. 2015), but they did not vary with elevation.
Other studies with butterflies (González-Esquivel et al. 2015) and plants (Kozlov et al. 2017) have shown that not all traits evaluated are able to detect stress factors acting at organisms and communities, even when there are real patterns of asym- metry. In our study, wing area, compared to wing length and width, might be a more reliable indicator of asymmetry as measuring the entire wing may permit the detection of varia- tion in symmetry of wing regions that are not detectable when measured as single linear traits, such as forewing length and width (Fig. 2, traits A and B).
There is a clear shortage of information about fluctuating asymmetry in animal communities. This was the first study to evaluate FA for a community of butterflies in tropical and environmental gradients and our data show that FA can be used as a reliable monitor of environmental stress caused by increased elevation.
Acknowledgements. We thank Dr. M. do Vale Beirão for the assistance in butterfly species identification, Dr. D. R.
Macedo for cartographical assistance and Dr. M. S. Linares for support. We thank the reviewers for their effort and their comments that greatly improved the manuscript and UFSJ, UFMG and LEVIN for support. N. R. Henriques was support- ed by CAPES (Finance Code 001) through a graduate schol- arship. T. Cornelissen acknowledges CNPq (307210/2016-2) and FAPEMIG (APQ 03171-18).
Author contributions
NRH sampled all data, NRH and TC analyzed data and wrote the manuscript.
Conflicts of interest
The authors declare that they have no conflict of interest.
References
Adamski, P. and Z.J. Witowski. 2002. Increase in fluctuating asym- metry during a population extinction: the case of the apollo butterfly Parnassius apollo frankenbergeri in the Pieniny Mts.
Biologia 57:597–601.
Aguirre-Gutiérrez, J., M.F. WallisDeVries, L. Marshall, M. Zelfde, A.
Villalobos-Arámbula, B. Boekelo, H. Bartholomeus, M. Franzén and J.C. Biesmeijer. 2017. Butterflies show different functional and species diversity in relationship to vegetation structure and land use. Glob. Ecol. Biogeogr. 26:1126–1137.
Alves-Silva, E., J.C. Santos and T.G. Cornelissen. 2018. How many leaves are enough? The influence of sample size on estimates of plant developmental instability and leaf asymmetry. Ecol. Indic.
89:912–924.
Anciães, M. and M.Â. Marini. 2000. The effects of fragmentation on fluctuating asymmetry on passerine birds of Brazilian tropical forests. J. Appl. Ecol. 37:1013–1028.
Beasley, D.A.E., A. Bonisoli-Alquati and T.A. Mousseau. 2013. The use of fluctuating asymmetry as a measure of environmentally induced developmental instability: A meta-analysis. Ecol. Indic.
30:218–226.
Cirino, J.F. and J.E. Lima. 2008. Contingent valuation of the Environmental Protection Area (APA) São José – MG: a case study. Rev. Econ. Sociol. Rural 46:647–672.
Cornelissen, T. and P. Stiling. 2011. Similar responses of insect her- bivores to leaf fluctuating asymmetry. Arthropod-Plant Interact.
5:59–69.
Despland, E., R. Humire and S.S. Martín. 2012. Species richness and phenology of butterflies along an altitude gradient in the desert of Northern Chile. Arct. Antarct. Alp. Res. 44:423–431.
Eterovick, P.C., B.L. Sloss, J.A.M. Scalzo and R.A. Alford. 2016.
Isolated frogs in a crowded world: Effects of human-caused habitat loss on frog heterozygosity and fluctuating asymmetry.
Biol. Conserv. 195:52–59.
Fernandes, G.W. 2016. Ecology and Conservation of Mountaintop Grasslands in Brazil, 1st ed., Springer, São Paulo.
Fernandes, G.W., H.A. Almeida, C.A. Nunes, J.H.A. Xavier, N.S.
Cobb, M.A.A. Carneiro, T. Cornelissen, F.S. Neves, S.P. Ribeiro, Y.R.F. Nunes, A.C.V. Pires and M.V. Beirão. 2016a. Cerrado to rupestrian grasslands: Patterns of species distribution and the forces shaping them along an altitudinal gradient. In: G.W.
Fernandes (ed.), Ecology and Conservation of Mountaintop Grasslands in Brazil, 1st ed. Springer, São Paulo. pp. 345–377.
Gonzaga, A.P.D., A.T. Oliveira-Filho, E.L.M. Machado, P. Har- greaves and J.N.M. Machado. 2008. Floristic-structural diagno-2008. Floristic-structural diagno- sis of the arboreal component of the Serra de São José forest, Tiradentes, MG, Brazil. Acta bot. bras. 22:505–520.
González-Esquivel, J.G., A. González-Rodríguez and P. Cuervas- Reyes. 2015. Importance of urbanization on patterns of fl uctuat-2015. Importance of urbanization on patterns of fluctuat- ing asymmetry richness and abundance of Lepidoptera. Bol. Soc.
Mex. Ento. 1:88–93.
Graça, M.B., P.A.C.L. Pequeno, E. Franklin, J.L.P. Souza and J.W.
Morais. 2017. Taxonomic, functional, and phylogenetic perspec-2017. Taxonomic, functional, and phylogenetic perspec- tives on butterfly spatial assembly in northern Amazonia. Ecol.
Entomol. 42:816–826.
Henriques, N.R., M.V. Beirão, E. Brasil and T. Cornelissen. 2019.
Butterflies (Lepidoptera: Papilionoidea) from the campos rupes-
Fluctuating asymmetry of a butterfly community 257
tres of Serra de São José, Minas Gerais, Brazil. Biota Neotrop.
19:e20180655.
Hodkinson, I.D. 2005. Terrestrial insects along elevation gradients:
species and community responses to altitude. Biol. Rev. 80:489–
513.
Javal, M., G. Roux, A. Roques and D. Sauvard. 2017. Asian long- horned beetle dispersal potential estimated in computer-linked flight mills. J. Appl. Entomol. 142:282–286.
Jentzsch, A., G. Köhler and J. Schumacher. 2003. Environmental stress and fluctuating asymmetry in the grasshopper Chorthippus parallelus (Acrididae: Gomphocerinae). Zoology 106:117–125.
Kozlov, M.V., T. Cornelissen, D.E. Gavrikov, M.A. Kunavin, A.D. Lama, J.R. Milligan, V. Zverev and E.L. Zvereva. 2017.
Reproducibility of fluctuating asymmetry measurements in plants: Sources of variation and implications for study design.
Ecol. Indic. 73:733–740.
Lashkari, M., M.G. Hentz and L.M. Boykin. 2015. Morphometric comparisons of Diaphorina citri (Hemiptera: Liviidae) popula- tions from Iran, USA and Pakistan. PeerJ 3:e946.
Leonard, R.J., K.K.Y. Wat, C. McArthur and D.F. Hochuli. 2018.
Urbanisation and wing asymmetry in the western honey bee (Apis mellifera, Linnaeus 1758) at multiple scales. PeerJ:e5940.
McCain, C.M. and J.A. Grytnes. 2010. Elevation gradients in spe- cies richness. In: Jones, H. (ed.), Encyclopedia of Life Science, John Wiley and Sons, Chichester. doi: 10.1002/9780470015902.
a0022548.
Modiba, R.V., G.S. Joseph, C.L. Seymour, P. Fouché and S.H. Foord.
2017. Restoration of riparian systems through clearing of inva- sive plant species improves functional diversity of Odonate as- semblages. Biol. Conserv. 21:46–54.
Møller, A.P. 1997. Developmental stability and fitness: a review. Am.
Nat. 149:916–932.
Møller, A.P. and J.P. Swaddle. 1997. Asymmetry, Developmental Stability and Evolution. Oxford University Press, Oxford, UK.
Palmer, A.R. and C. Strobeck. 1986. Fluctuating asymmetry: mea- surement, analysis, patterns. Annu. Rev. Ecol. Evol. Syst.
391:421.
Pecl, G.T., M.B. Araújo, J.D. Bell, J. Blanchard, T.C. Bonebrake, I.
Cheng, T.D. Clark, R.K. Colwell, F. Danielsen, B. Evengard, L. Falconi, S. Ferrier, S. Frusher, R.A. Garcia, R.B. Griffis, A.J. Hobday, C. Janion-Scheepers, M.A. Jarzyna, S. Jennings, J. Lenoir, H.I. Linnetved, V.Y. Martin, P.C. McCormack, J.
McDonald, N.J. Mitchell, T. Mustonen, J.M. Pandolfi, N.
Pettorelli, E. Popova, S.A. Robinson, B.R. Scheffers, J.D. Shaw, C.J.B. Sorte, J.M. Strugnell, J.M. Sundat, M. Tuanmu, A. Vergés.
C. Villanueva, T. Wernberg, E. Wapstra and S.E. Williams. 2017.
Biodiversity redistribution under climate change: Impacts on ecosystems and human well-being. Science 355:eaai9214.
R Development Core Team. 2017. R: A language and environ- ment for statistical computing. R Foundation for Statistical Computing [Internet]. Viena, Austria: R Foundation for Statistical Computing.
Sanseverino, A.M. and J.L. Nessimian. 2008. Fluctuating asymmetry in aquatic organisms and its application for the evaluation of en- vironmental impacts. Oecologia Brasiliensis 12:382–405.
Santos, J.P., C.A. Iserhard, M.O. Teixeira and H.P. Romanowski.
2011. Fruit-feeding butterflies guide for subtropical Atlantic Forest and Araucaria Moist Forest in State of Rio Grande do Sul, Brazil. Biota Neotrop. 11:253–274.
Schneider, C.A., W.S. Rasband, W.S. and K.W. Eliceiri. 2012. NIH Image to ImageJ: 25 years of image analysis. Nature Methods 9(7):671–675.
Talloen, W., S. Van Dongen, H. Van Dyck and L. Lens. 2009.
Environmental stress and quantitative genetic variation in but- terfly wing characteristics. Evol. Ecol. 23:473–485.
Tembotova, F.A., A.H. Amshokova, E.P. Kononenko and E.A.
Kuchinova. 2018. Development stability of the skull of two rodent species (Mammalia, Rodentia) in anthropogenic and the environment of Central Caucasus mountains. AD ALTA-Journal of Interdisciplinary Research 8:35–39.
Thomas, C.D., J.K. Hill and O.T. Lewis. 1998. Evolutionary conse- quences of habitat fragmentation in a localized butterfly. J. Anim.
Ecol. 67:485–497.
Vogel, H.F., C.H. Zawadzki, G.S. Silva, C.C.O. Ramos and F.C.
Bechara. 2012. Fluctuating asymmetry: Early data from a taxo- cenose of thrushes (Passeriformes, Turdidae) in an urban park in the mid-south region of the state of Paraná, Brazil. Publicatio UEPG: Ciências Biológicas e da Saúde 18:25–30.
Wells, C., A. Munn and C. Woodworth. 2018. Geomorphic mor- phometric differences between populations of Speyeria diana (Lepidoptera: Nymphalidae). BioOne 101:195–202.
Wilsey, B.J., E. Haukioja, J. Koricheva and M. Sulkinoja. 1998. Leaf fluctuating asymmetry increases with hybridization and eleva- tion in tree-line birches. Ecology 79:2092–2099.
Windig, J.J., P.T. Rintamäki, A. Cassel and S. Nylin. 2000. How use- ful is fluctuating asymmetry in conservation biology: Asymmetry in rare and abundant Coenonympha butterflies. J. Insect Conserv.
4:253–261.
Yuto, C.M.M., L. Lumogdang and R.M. Tabugo. 2016. Fluctuating asymmetry as an indicator of ecological stress in Rhinocypha colorata (Odonata: Chlorocyphidae) in Iligan City, Mindanao, Philippines. Entomol. Appl. Sci. Lett. 3:13–20.
Received April 27, 2019 Revised August 2, September 31, 2019 Accepted October 18, 2019
Supplementary material
Table S1. Occurrence of butterfly species along the eleva- tion gradient of the Serra de São José mountain, Minas Gerais state, Brazil.
Figure S1. Relationship between fluctuating asymmetry (FA) in length (superior panel) and width (inferior panel) of wings of the butterfly community along the altitudinal gradient of Serra de São José mountain, Brazil.
The file may be downloaded from www.akademiai.com.